Biology 9700/11 — October/November 2016
Cambridge AS Level · Multiple Choice (AS Level) · answer key with instant marking and worked solutions
Topics Cell Structure · Biological Molecules · Transport in Plants · Transport in Mammals · Nucleic Acids and Protein Synthesis · Cell Membranes and Transport · +5 more
Tap an option under each question to check it — your score builds as you go.
The diagram shows a transverse section through a blood capillary.
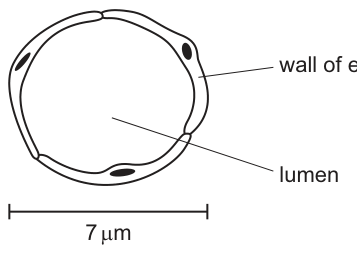
What is the magnification of the drawing?
Options
A
B
C
D
Working
The scale bar in Fig. 1.1 represents an actual length of . On the printed drawing, that scale bar measures approximately .
Answer
D
D
Background Concept
Magnification describes how many times larger a drawing (or micrograph) is than the real object. The standard formula is:
Both quantities must be expressed in the same units before dividing. A common source of error in these questions is mixing millimetres and micrometres:
A scale bar printed on a diagram is a labelled line that represents a known actual length of the specimen (here, ). It is the most reliable way to work out the magnification of a drawing, because you do not need to know the original size of the structure — you simply measure the scale bar on the page and divide by the value it represents.
Blood capillaries are very small vessels (typically in diameter), so they are drawn at high magnification to show details of the thin endothelial wall.
Understanding the Question
Fig. 1.1 is a transverse section through a blood capillary, showing a single layer of endothelium surrounding a narrow lumen. Beneath the drawing is a scale bar labelled , which tells us what real length the bar represents. The question asks for the magnification of the drawing — i.e. how many times the drawing is larger than the real capillary.
The command word here is implicitly "calculate", although it is an MCQ. We need to pick the option that matches the ratio of the scale bar's length on the page to the actual length it represents.
Approach
- Measure (or read off) the length of the scale bar on the page in mm.
- Convert that length to the same units as the actual size (µm).
- Divide the image length by the actual length.
- Match the result to the closest option.
Step-by-Step Reasoning
The scale bar on the printed diagram is approximately long. Converting to micrometres:
Applying the magnification formula with image size and actual size :
So the drawing is the size of the real capillary. This is option D.
Why the others are wrong:
- A () would imply a scale bar of only — far too small to be readable; the actual scale bar is several cm long.
- B () is a distractor that would correspond to a scale bar of about — still much too small.
- C () would require a scale bar of about — too short for what is shown.
Only D matches the long scale bar drawn beneath the figure.
Key Takeaways
- A scale bar is the easiest, most reliable way to find the magnification of any drawing or micrograph.
- Always convert both the image size and the actual size to the same units before dividing.
- Remember the key conversions: and .
- Formula: .
Common Mistakes
- Forgetting to convert units — dividing mm by µm without converting gives an answer that is wrong by a factor of 1000 (e.g. instead of ).
- Using the diameter of the capillary instead of the scale bar. The scale bar is provided precisely so you do not need to know the real diameter.
- Inverting the ratio — actual size / image size would give the reciprocal.
Things to Be Careful About
- A real capillary is only across, so very high magnifications (s) are expected when such small structures are drawn at a few cm across on paper.
- Read the scale bar label carefully — it says , not .
- The answer must include the "" symbol only in written form; in the MCQ you simply select the option letter.
The rest of this paper
39 more questions- Q2Cell Structure1M
- Q3Cell Structure1M
- Q4Cell Structure1M
- Q5Cell Structure1M
- Q6Biological Molecules1M
- Q7Biological Molecules1M
- Q8Biological Molecules1M
- Q9Biological Molecules1M
- Q10Biological Molecules1M
- Q11Biological Molecules1M
- Q12Enzymes1M
- Q13Enzymes1M
- Q14Cell Membranes and Transport1M
- Q15Cell Membranes and Transport1M
- Q16Cell Membranes and Transport1M
- Q17The Mitotic Cell Cycle1M
- Q18The Mitotic Cell Cycle1M
- Q19Nucleic Acids and Protein Synthesis1M
- Q20Nucleic Acids and Protein Synthesis1M
- Q21Nucleic Acids and Protein Synthesis1M
- Q22Nucleic Acids and Protein Synthesis1M
- Q23Transport in Plants1M
- Q24Transport in Plants1M
- Q25Transport in Plants1M
- Q26Transport in Plants1M
- Q27Transport in Plants1M
- Q28Transport in Mammals1M
- Q29Transport in Mammals1M
- Q30Transport in Mammals1M
- Q31Transport in Mammals1M
- Q32Transport in Mammals1M
- Q33Gas Exchange1M
- Q34Cell Structure1M
- Q35Gas Exchange1M
- Q36Infectious Diseases1M
- Q37Infectious Diseases1M
- Q38Immunity1M
- Q39Immunity1M
- Q40Immunity1M