Biology 9700/35 — May/June 2016
Cambridge AS Level · Advanced Practical Skills · worked solutions for every part, with the mark scheme
Topics Presentation of Data and Observations · Manipulation, Measurement and Observation · Analysis, Conclusions and Evaluation · Use of the Light Microscope
Glucose is an important substrate for cellular respiration. Glucose is absorbed into the blood from the small intestine and transported in the blood plasma to the body cells.
You are required to:
- prepare different concentrations of the glucose solution G
- carry out the Benedict’s test on each of the concentrations of glucose solution you have prepared
- carry out the Benedict’s test on the solution representing blood plasma P
- use the results of the Benedict’s tests to estimate the concentration of glucose in P.
You are provided with:
| labelled | contents | hazard | volume / |
|---|---|---|---|
| G | 1% glucose solution | none | 50 |
| W | distilled water | none | 70 |
| P | unknown concentration of glucose | none | 10 |
| Benedict’s | Benedict’s solution | none | 50 |
You are required to make a serial dilution of the 1% glucose solution, G, which reduces the concentration by half between each successive dilution.
You will need to prepare of each concentration.
Fig. 1.1 shows the first two beakers you will use to make your serial dilution.
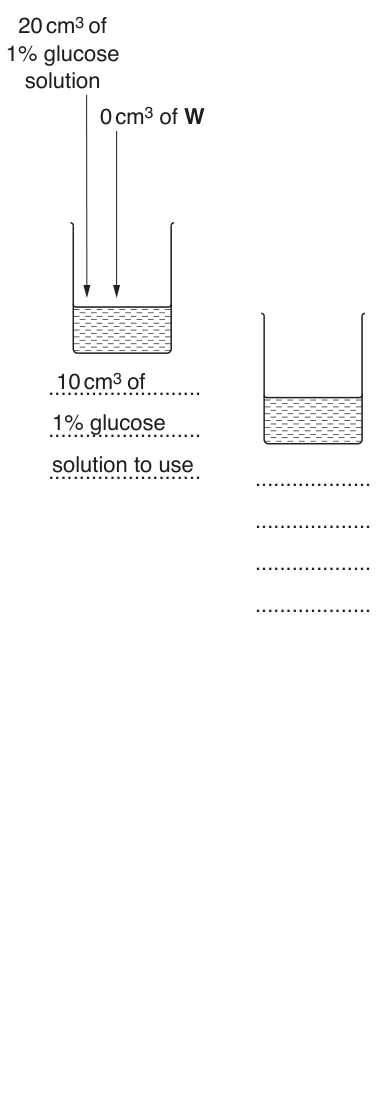
Complete Fig. 1.1 by drawing the extra beakers you need for your serial dilution.
For each beaker:
- state, under the beaker, the concentration and volume of the glucose solution available for use in the investigation
- use one arrow, with a label above the beaker, to show the concentration and volume of glucose solution added to prepare the concentration
- use another arrow, with a label above the beaker, to show the volume of W added to prepare the concentration.
State the smallest division on the syringe you used in step 3.
State the actual error when using this syringe.
actual error = ______
Calculate the percentage error when using this syringe.
You may lose marks if you do not show your working.
percentage error = ______
Proceed as follows:
- Set up a water-bath and heat to boiling ready for step 6.
- Prepare the concentrations of glucose solution as shown in Fig. 1.1.
- Put of 1% glucose solution into a test-tube.
- Put of Benedict’s solution into the same test-tube as step 3.
- Shake the test-tube gently to mix the contents.
Read step 6 to step 9 before proceeding.
You are required to:
- observe the contents of the test-tube continuously while the test-tube is heated for 60 seconds
- record the time taken for the first appearance of a colour change, if a colour change occurs during this 60 seconds
- record the colour after heating for 60 seconds.
- Put this test-tube into the water-bath you prepared in step 1 and start timing.
- Record the time taken for the first appearance of a colour change in Table 1.1. Do not stop the clock and continue heating until 60 seconds.
If there is no colour change after 60 seconds record the time as ‘more than 60’.
- At 60 seconds remove the test-tube from the water-bath, gently shake, and record the colour of the Benedict’s solution in Table 1.1.
- Repeat step 3 to step 8 for each of the glucose solutions you prepared in step 2.
You are not required to repeat this experiment.
Complete the column headings and record your results in Table 1.1.
Table 1.1
| time taken for the first appearance of a colour change / ______ | colour of Benedict’s at 60 seconds | |
|---|---|---|
Describe how you will standardise the Benedict’s test in order to enable you to estimate the concentration of glucose in P.
- Repeat step 3 to step 8 using solution P.
Record your results for solution P.
time taken for the first appearance of a colour change = ______
colour of Benedict’s at 60 seconds = ______
Estimate the concentration of glucose in P, using the colour of Benedict’s at 60 seconds recorded in Table 1.1 and (a)(v).
Describe one improvement to allow a more accurate estimate of the concentration of glucose in P to be obtained using the colour of Benedict’s at 60 seconds.
Describe how your results for the time taken for the first appearance of a colour change can be used to produce a more accurate estimate of the concentration of glucose in P than the one given in (a)(vi).
A scientist studied the change in the concentration of glucose in blood plasma after eating a meal containing carbohydrate. Samples of blood plasma were taken at regular intervals after eating the meal and the concentration of glucose in each sample was measured.
The results are shown in Table 1.2.
Table 1.2
| time after eating the meal / minutes | concentration of glucose in blood plasma / |
|---|---|
| 0 | 5.125 |
| 20 | 6.750 |
| 40 | 7.600 |
| 60 | 7.475 |
| 80 | 7.100 |
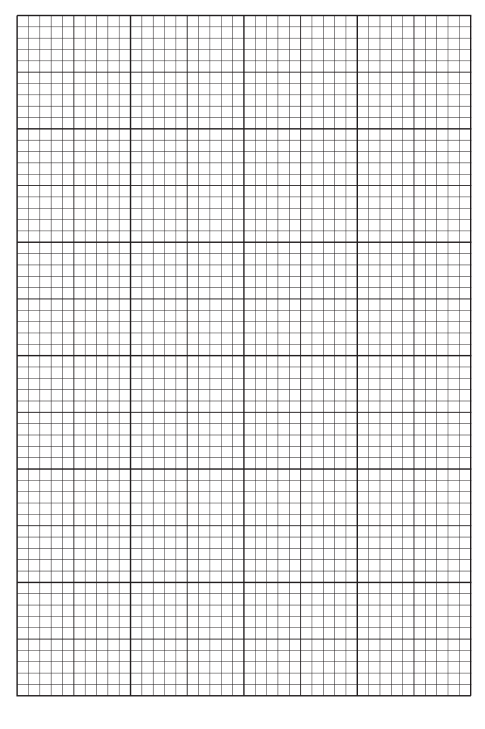
You are required to use a sharp pencil for graphs.
Plot a graph of the data shown in Table 1.2.
Calculate the percentage increase in concentration of glucose in the blood plasma between 0 minutes and 20 minutes after eating the meal.
You may lose marks if you do not show all your working.
percentage increase = ______
Use one label line and the label X to show on the graph where the rate of diffusion of glucose into the blood is most rapid.
Suggest one reason for the concentration of glucose in blood plasma decreasing between 60 minutes and 80 minutes after eating the meal.
The rest of this paper
1 more questions- Q2Use of the Light Microscope · Presentation of Data and Observations17M