Biology 9700/33 — May/June 2016
Cambridge AS Level · Advanced Practical Skills · worked solutions for every part, with the mark scheme
Topics Manipulation, Measurement and Observation · Analysis, Conclusions and Evaluation · Presentation of Data and Observations · Use of the Light Microscope
Plant cells contain an enzyme, catalase, which catalyses the hydrolysis (breakdown) of hydrogen peroxide into oxygen and water. An extract of plant tissue contains catalase.
You are required to investigate the effect of temperature (independent variable) on catalase in a plant extract solution.
You are provided with:
| labelled | contents | hazard | volume / |
|---|---|---|---|
| P | plant extract solution | none | 100 |
| H | hydrogen peroxide solution | harmful irritant | 100 |
You are advised to wear suitable eye protection, especially when using the hydrogen peroxide solution, H. If H comes into contact with your skin, wash off with cold water.
When carrying out a practical procedure the hazards of using the solutions need to be considered. Then the level of risk needs to be assessed as low or medium or high.
State the hazard with the greatest level of risk when using the solutions then state the level of risk of the procedure: low or medium or high.
hazard ______
level of risk ______
You are required to keep a sample of of the solution in P to test at the temperature of the room.
Then heat the remaining solution in P and remove samples of the solution at different temperatures including a sample at the maximum temperature of .
Use the thermometer to measure the temperature of the room.
temperature = ______
You will need to test a sample of the solution in P which has been heated to .
State the other temperatures at which you will remove each sample.
Proceed as follows:
- Put of the solution in P into a petri dish labelled with the temperature of the room you recorded in (b)(i).
- Gently heat the beaker labelled P, containing the remaining solution.
- When the temperature of the solution in P reaches the lowest temperature stated in (b)(ii), remove the Bunsen burner.
- Remove of the solution in P and put it into a labelled petri dish.
- Replace the Bunsen burner.
- Repeat step 2 to step 5 for each of the temperatures stated in (b)(ii).
- When the solution reaches , remove the last sample and put it into a labelled petri dish.
- Turn off the Bunsen burner.
- Leave the solutions to cool while you cut squares of filter paper, . You will need to decide how many squares to cut to give you confidence in your results.
- Put a mark on the test-tube from the top.
- Put H into the test-tube up to this mark.
- Use forceps to pick up one square of filter paper and dip the whole square into the solution in the petri dish that is labelled with the temperature of the room.
- Wipe the square against the petri dish to remove excess solution from both sides of the square.
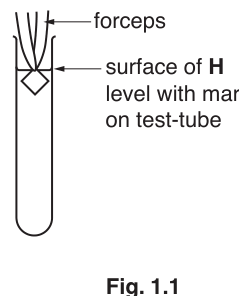
- Hold the square just below the surface of H so that the top of the square is level with the surface of H as shown in Fig. 1.1.
- Immediately release the square (you may need to shake the forceps) and start timing.
- Measure the time taken for the square to return to the surface. Record the time in (b)(iii).
If the time is more than 120 seconds, stop timing and record 'more than 120'.
- Remove the square from the test-tube.
Note: if the square remains at the bottom of the test-tube, pour off H into the container labelled H. Use water in the beaker labelled 'for washing' to rinse out the square from the test-tube. Then repeat step 11.
- Repeat step 12 to step 17 with each of the samples removed at the different temperatures.
Prepare the space below and record your results.
Identify two significant sources of error in this investigation.
Explain how the enzyme catalase was affected by the change in temperature.
This procedure investigated the effect of temperature on the activity of catalase in the plant extract.
To modify this procedure for investigating another variable, the independent variable (temperature) would need to be standardised.
Describe how the temperature could be standardised.
Now consider how you could modify this procedure to investigate the effect of the concentration of catalase in the plant extract on the breakdown of hydrogen peroxide.
Describe how this independent variable, concentration of catalase, could be investigated.
A student investigated the activity of catalase in plant extracts from different species of plants, R, S, T, U and V, by measuring the initial rate of activity.
Table 1.1 shows the results for this investigation.
Table 1.1
| different plant species | initial rate of activity of catalase / |
|---|---|
| R | 0.0750 |
| S | 0.1275 |
| T | 0.0900 |
| U | 0.0325 |
| V | 0.0625 |
You are required to use a sharp pencil for charts.
Plot a chart of the data shown in Table 1.1.
The rest of this paper
1 more questions- Q2Use of the Light Microscope · Manipulation, Measurement and Observation · Analysis, Conclusions and Evaluation19M