Biology 9700/32 — May/June 2016
Cambridge AS Level · Advanced Practical Skills · worked solutions for every part, with the mark scheme
Topics Presentation of Data and Observations · Analysis, Conclusions and Evaluation · Manipulation, Measurement and Observation · Use of the Light Microscope
Yeast cells use enzymes to hydrolyse (break down) glucose, releasing carbon dioxide.
The release of carbon dioxide can be used to measure the activity of yeast cells.
You are required to investigate the effect of temperature (independent variable) on the activity of a yeast cell suspension.
You are provided with:
| labelled | contents | hazard | volume / |
|---|---|---|---|
| Y | yeast cell suspension with glucose added | none | 100 |
You will need to test the activity of a yeast cell suspension at the temperature of the room.
Use the thermometer to measure the temperature of the room.
temperature = ______
Answer
temperature = 22 °C (whole number or to the nearest half degree, with °C).
22 °C (representative value within typical exam-room range)
Background Concept
Temperature is measured in degrees Celsius (°C). A laboratory thermometer typically has scale markings every 1 °C, and the reading can usually be estimated to the nearest 0.5 °C by interpolating between the marked lines. The temperature of an exam room is usually in the range 18–25 °C, depending on the season and the building's heating and ventilation.
Understanding the Question
You are asked to use the thermometer provided in the practical tray to read the temperature of the room and write that value (with the unit) in the space provided. This value will be used later as one of the test temperatures for the yeast suspension.
Approach
Hold or stand the thermometer so the scale can be read at eye level (reading at an angle introduces parallax error). Wait for the liquid thread to stop moving, then read to the nearest whole number or half degree. Always include the unit °C.
Step-by-Step Reasoning
- Place the thermometer bulb in the open air, away from direct sunlight, radiators, or your hands (body heat will warm the bulb and give a falsely high reading).
- Leave it for 30–60 seconds until the liquid thread stabilises.
- Read the position of the meniscus (the bottom of the liquid thread) at eye level.
- Round to the nearest whole number or half degree, e.g. 22 °C.
- Record: temperature = 22 °C.
Key Takeaways
- Always include the unit with a measurement.
- Read to the precision the instrument allows (here, ±0.5 °C).
- Be aware of sources of reading error (parallax, body heat, drafts).
Common Mistakes
- Forgetting the unit °C — the mark is lost even if the number is correct.
- Reading to an inappropriate precision (e.g. 22.3 °C is not creditworthy on a 1 °C-scale thermometer).
- Holding the bulb with warm fingers, raising the apparent room temperature.
Things to Be Careful About
The mark scheme requires either a whole number or a value to half a degree, plus °C. Anything more precise (e.g. 22.4 °C) is not credited; anything less precise (e.g. 'about 20') loses the precision mark.
You will also need to test the activity of a yeast cell suspension at the maximum temperature of .
State the other temperatures you will use in your investigation.
Answer
30 °C, 40 °C, 50 °C (at least three additional whole numbers at even intervals, with °C).
30 °C, 40 °C, 50 °C (example with room at ~22 °C and 60 °C given)
Background Concept
When investigating the effect of an independent variable, you need to choose a sensible range and a sensible number of values. For a continuous variable like temperature, you should select values that are evenly spaced (at even intervals) so that the trend you see in the results is genuinely due to the variable and not to a sampling artefact. Using whole numbers is conventional and easier to set up with standard laboratory water-baths.
Understanding the Question
You have been told to test the yeast suspension at the temperature of the room (whatever that is) and at 60 °C. You need to state at least three additional temperatures that you would test, to give a total of at least five data points. The mark scheme requires these additional temperatures to be whole numbers at even intervals, with the unit °C.
Approach
Choose three whole numbers between the room temperature and 60 °C, at equal intervals. For example, if the room is 22 °C, use 30 °C, 40 °C, and 50 °C — these are at 10 °C intervals. The key is consistency of spacing.
Step-by-Step Reasoning
- Identify the two fixed temperatures: room (e.g. 22 °C) and 60 °C.
- Decide on a sensible interval (commonly 10 °C, so you have five temperatures total).
- Pick three additional whole numbers that fit: 30 °C, 40 °C, 50 °C.
- List all five temperatures, e.g.: 22, 30, 40, 50, 60 °C.
- Check: are the additional ones whole numbers? Yes. Are they at even intervals? Yes. Are there at least three additional ones? Yes. Is °C included? Yes.
Key Takeaways
- An independent variable should be sampled at even intervals to make a trend interpretable.
- A minimum of five values (including the room temperature and 60 °C) is conventional for a temperature investigation.
- Always quote the unit.
Common Mistakes
- Choosing unevenly spaced values (e.g. 25, 35, 50).
- Not including the unit °C.
- Picking temperatures too close to the room value (no spread) or only adding one or two extra values.
- Choosing intervals so small that five temperatures barely span the range.
Things to Be Careful About
The mark scheme wants the additional temperatures, not a list of all five. You can include the room and 60 °C values too, but the additional ones must satisfy all four criteria (count, whole numbers, even intervals, units).
Proceed as follows:
Read step 1 to step 11.
- Put of the yeast cell suspension, Y, into a test-tube labelled with the temperature of the room you recorded in (a)(i).
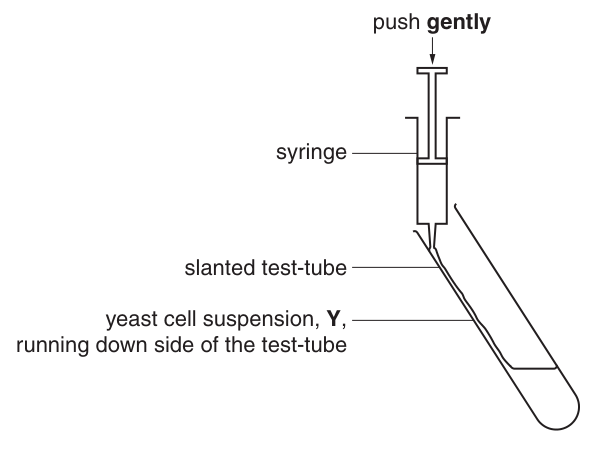
- Position the open end of the syringe so that it touches the side of the test-tube as shown in Fig. 1.1.
- Gently press the plunger of the syringe so that the yeast cell suspension runs down the side of the test-tube to the bottom with as little foam as possible being formed.
- Put this test-tube in the test-tube rack.
- Repeat step 1 to step 4 for each of the other temperatures you will use in your investigation.
- Label the beakers with the temperatures you will use in your investigation and set these up as water-baths ready for step 7.
- Put the test-tube labelled into the water-bath at that temperature.
- Repeat step 7 for each of the labelled test-tubes.
- Maintain the temperatures of the water-baths for 15 minutes.
- After 15 minutes, stop timing, take the test-tubes out of each water-bath and put them in the test-tube rack.
- Measure the height of the foam above the level of the yeast cell suspension in each of the test-tubes.
Record your results in (a)(iii).
Prepare the space below and record your results.
Answer
| temperature / °C | height of foam / mm |
|---|---|
| 22 | 4 |
| 30 | 10 |
| 40 | 22 |
| 50 | 9 |
| 60 | 2 |
(Values are illustrative; your own readings will differ. The mark scheme credits the table conventions and the increase-to-optimum-then-decrease pattern.)
See working (example values; the pattern of increase to ~40 °C then decrease is what the mark scheme credits)
Background Concept
A results table is the standard way to record raw data in a practical investigation. Each column needs a heading that names the quantity measured and gives its unit (separated by a solidus, e.g. 'temperature / °C'). Data should be recorded to a precision appropriate to the measuring instrument. For this experiment, the height of the foam layer produced by CO₂ bubbling through the yeast suspension is measured in millimetres to the nearest whole mm.
The expected pattern for yeast enzymes: the rate of CO₂ release is low at low temperatures, rises with temperature as the enzymes gain kinetic energy, reaches a maximum at the optimum temperature (around 35–40 °C for most yeast enzymes), and then falls sharply at higher temperatures as the enzymes denature and lose their active-site shape.
Understanding the Question
You need to draw a table to record the height of the foam in each test-tube after the 15-minute incubation period. The table will have one row per temperature, and you will fill in the height of the foam you observe.
Approach
- Decide on the temperatures you are using (from (a)(i) and (a)(ii)).
- Draw a table with two columns: temperature and height of foam.
- Add correct column headings with units.
- Enter the temperature in each row.
- After the experiment, measure the foam height in each tube and enter the value in mm.
- Check the pattern of your data: it should increase to a maximum and then decrease.
Step-by-Step Reasoning
A typical table is shown in the solution above. The values are illustrative — your own readings will differ. The pattern, however, should show: low activity at room temperature, increasing activity as temperature rises, peak activity at the optimum (~40 °C), and a sharp drop as the enzymes denature at high temperatures.
Key Takeaways
- Table conventions: ruled lines, heading with quantity and unit, data recorded to the precision of the instrument.
- The expected pattern for a temperature vs. enzyme activity graph is an asymmetric peak with the maximum at the enzyme's optimum temperature.
- Denaturation above the optimum is irreversible; activity does not recover on cooling.
Common Mistakes
- Omitting the unit in the column heading (e.g. 'temperature' without '°C').
- Recording foam height to inappropriate precision (e.g. 10.5 mm) — read to the nearest whole mm.
- Failing to record the result for the room temperature or 60 °C.
- Drawing a table with only one column (temperature) and no measured values.
Things to Be Careful About
The mark scheme gives 1 mark for each of the five criteria: heading 'temperature / °C', heading 'height (or length) of foam / mm', at least four rows of data, the correct pattern, and whole-mm values. To get all 5 marks, every criterion must be met.
A common error is recording values that decrease continuously (e.g. 20, 15, 10, 5, 0) without the rise-then-fall pattern. This loses the pattern mark.
Identify two significant sources of error in this investigation.
Answer
- Maintaining the water-bath temperature is difficult — the temperature of each water-bath fluctuates and the test-tubes may not actually be at the intended temperature for the full 15 minutes, so the activity measured is not at the intended temperature.
- Measuring the foam height is difficult because the foam is not an even layer — the irregular top surface, with larger bubbles in some places, makes reading to the nearest mm approximate.
- Difficulty of maintaining water-bath temperature within an acceptable range. 2. Difficulty of measuring uneven foam height.
Background Concept
A 'significant source of error' is a step in the procedure where variability, imprecision, or uncontrollable factors could meaningfully distort the measured result. To score marks, each error must be specific to the procedure and paired with a reason why it matters.
Understanding the Question
You are asked to identify two significant sources of error in the procedure you have just performed and explain each one.
Approach
Walk mentally through the procedure step by step and ask at each stage: 'What could go wrong here, and how would that affect the result?' Pick the two most significant errors.
Step-by-Step Reasoning
Two clear, mark-scheme-aligned sources of error:
- Difficulty of maintaining the water-bath temperature within an acceptable range. Even with a thermostatically controlled water-bath, the temperature of the water fluctuates by ±1–2 °C, and the test-tubes take time to equilibrate. The yeast suspension may not actually be at the intended temperature for the full 15 minutes.
- Difficulty of measuring the foam height because the foam is not an even layer. CO₂ bubbles create a foam whose top surface is irregular, with larger bubbles in some places. Measuring the height to the nearest mm is therefore approximate.
Key Takeaways
- A source of error must be specific to the procedure, not generic ('human error', 'parallax').
- Each error should be paired with a reason (how it affects the result or measurement).
- Significant errors are those that could plausibly change the qualitative conclusion or the numerical value by a meaningful amount.
Common Mistakes
- Stating 'human error' or 'parallax error' without linking it to a specific procedural step.
- Giving two errors that are essentially the same (e.g. two different temperature-control issues).
- Listing improvements (e.g. 'use a colorimeter') instead of errors.
- Giving a single error without a reason.
Things to Be Careful About
The mark scheme is generous — it gives examples ('e.g. ...'). Any error with a plausible reason, specific to this procedure, will be credited. But vague statements will not.
Describe how you could set up a control for this investigation.
Answer
Boil the yeast suspension (or replace the yeast cell suspension with the same volume of water) and treat this control tube identically in every other respect. It should produce no (or negligible) foam, confirming that the foam in the experimental tubes is due to active yeast enzymes, not to heating alone or to a non-enzymatic reaction of glucose.
Boil the yeast suspension (or replace the yeast cell suspension with the same volume of water).
Background Concept
A control is an experimental condition in which the variable of interest is removed or neutralised, so that any result obtained can be confidently attributed to the variable being investigated. In this experiment, the variable is the activity of the yeast enzymes. To prove that the foam is produced by the yeast enzymes acting on the glucose (and not, for example, by heat alone, by a chemical reaction of glucose with water, or by air being trapped in the suspension), the control must lack active yeast enzymes.
Understanding the Question
You need to describe a control for the procedure. The control should differ from the experimental tubes in only one specific way: the absence of active yeast enzymes.
Approach
Replace the active yeast with either dead yeast (boiled) or with water, while keeping everything else the same. This shows that any foam in the experimental tubes is due to the live yeast enzymes, not to some other factor.
Step-by-Step Reasoning
- Take an additional test-tube and add the same volume (10 cm³) of yeast suspension as the experimental tubes.
- Boil this suspension for several minutes to denature all the enzymes (or replace the yeast suspension with 10 cm³ of water).
- Place this control tube in one of the water-baths (e.g. 40 °C) alongside the experimental tubes.
- After 15 minutes, measure the foam height.
- The control should produce no (or negligible) foam, confirming that the foam in the experimental tubes is due to active yeast enzymes.
Key Takeaways
- A control differs from the experiment in only the variable being tested.
- Boiling denatures the enzymes without removing the substrate (glucose) or changing the volume.
- A negative result in the control (no foam) validates a positive result in the experiment.
Common Mistakes
- Changing more than one variable between control and experiment (e.g. also omitting the glucose).
- Describing a repeat rather than a control.
- Suggesting heating without specifying the elimination of enzyme activity.
Things to Be Careful About
The mark scheme accepts either 'boil the yeast suspension' or 'replace the yeast suspension with the same volume of water'. Both are valid controls. Just one sentence is enough to earn the mark.
Explain how the temperature affected the enzymes in the yeast cell suspension.
Answer
As temperature increases, the enzyme and substrate molecules have more kinetic energy. They move faster and collide more frequently, so there are more successful collisions — that is, more enzyme–substrate complexes (ESCs) formed per unit time. This increases the rate of CO₂ release.
More kinetic energy → more successful collisions / more enzyme-substrate complexes (ESCs) formed per unit time.
Background Concept
Enzymes are biological catalysts that speed up reactions by lowering the activation energy. The rate of an enzyme-catalysed reaction depends on the frequency of successful collisions between enzyme and substrate molecules. According to the kinetic theory, raising the temperature increases the average kinetic energy of molecules, so they move faster and collide more often, and with greater energy, increasing the chance that each collision has enough energy to overcome the activation energy.
When an enzyme and substrate collide successfully, they form a transient enzyme–substrate complex (ESC). The more ESCs that form per unit time, the faster the reaction proceeds and the more product (CO₂, in this case) is released per unit time.
Understanding the Question
You are asked to explain how an increase in temperature (below the optimum) leads to the observed increase in yeast activity. The mark scheme credits two ideas: increased kinetic energy, and the consequence of this (more successful collisions or more ESCs formed).
Approach
Link temperature → kinetic energy → collision frequency / energy → ESC formation → rate of reaction → CO₂ output.
Step-by-Step Reasoning
- As temperature increases, the enzyme and substrate molecules have more kinetic energy.
- This means they move faster, collide more frequently, and a greater proportion of collisions have energy ≥ the activation energy.
- The number of successful collisions per unit time increases.
- More enzyme–substrate complexes (ESCs) form per unit time.
- More product (CO₂) is released per unit time, so the rate of reaction (and hence the height of the foam) is greater.
Key Takeaways
- The kinetic theory provides the mechanism: temperature → kinetic energy → collision frequency.
- The lock-and-key / induced-fit model explains why a successful collision leads to product formation.
- The explanation applies to temperatures below the optimum; above the optimum, denaturation overrides the kinetic effect.
Common Mistakes
- Saying 'the enzymes work faster' without linking this to kinetic energy and collisions.
- Failing to mention the enzyme–substrate complex.
- Confusing the kinetic explanation with the denaturation explanation (denaturation applies only above the optimum, but the question is about the increase at lower temperatures).
- Mentioning 'denaturation' as the cause of the increase — denaturation decreases activity, not increases it.
Things to Be Careful About
The mark scheme gives marks for two specific points: kinetic energy, and successful collisions or ESCs. To get both marks, you need both ideas explicitly stated. A one-line answer like 'more heat speeds up the reaction' scores zero.
This procedure investigated the effect of temperature on the activity of a yeast cell suspension.
To modify this procedure for investigating another variable, the independent variable (temperature), would need to be standardised.
Describe how the temperature could be standardised.
Now consider how you would modify this procedure to investigate the effect of pH on the activity of a yeast cell suspension.
Describe how this independent variable, pH, could be investigated.
Answer
- Standardise the temperature by placing all tubes in a thermostatically controlled water-bath at one stated temperature (e.g. 40 °C, the optimum for yeast) for the 15-minute incubation.
- Vary the pH using at least five different pH values (e.g. pH 2, 4, 6, 8, 10).
- Use buffer solutions to maintain each pH during the reaction.
Standardise temperature (thermostatic water-bath at one stated T); use at least five pH values; use buffer solutions to maintain each pH.
Background Concept
To investigate a different independent variable (here, pH) while keeping the rest of the procedure comparable, you need to:
- Standardise the variable previously being investigated (temperature) so it no longer varies.
- Vary the new independent variable (pH) systematically across at least five values to show a clear trend.
- Hold all other variables (volume, concentration, time, apparatus) constant.
Buffers are solutions that resist changes in pH when small amounts of acid or alkali are added, or when diluted. They are used to maintain a stable, known pH during an experiment.
Understanding the Question
You are asked two things:
(i) How would you standardise the temperature?
(ii) How would you modify the procedure to investigate the effect of pH on the activity of the yeast suspension?
Approach
Standardise the temperature by holding it constant (e.g. in a thermostatically controlled water-bath at a stated value, such as 40 °C — the optimum for yeast). Vary pH using at least five different buffer solutions. Keep everything else the same.
Step-by-Step Reasoning
- Standardising temperature: Place all the test-tubes in a thermostatically controlled water-bath set to a single, stated temperature (e.g. 40 °C, the optimum for yeast enzymes) for the 15-minute incubation. This removes temperature as a variable.
- Independent variable (pH): Prepare at least five buffer solutions covering a wide pH range (e.g. pH 2, 4, 6, 8, 10). Mix each buffer with the yeast-glucose suspension in the test-tubes, OR prepare the yeast suspension in each buffer.
- Method: Use the same volumes, the same yeast/glucose source, the same incubation time, and the same measurement of foam height (or volume of CO₂) as in the original procedure. The only difference is the pH.
Key Takeaways
- An investigation of one variable requires all other variables to be standardised.
- pH is controlled by buffers, not by adding arbitrary amounts of acid/alkali.
- A range of at least five pH values is needed to see a clear trend and identify the optimum.
- Temperature standardisation is essential because temperature also affects enzyme activity.
Common Mistakes
- Forgetting to standardise the temperature.
- Suggesting 'add acid or alkali' instead of using buffers — without buffers, the pH will drift during the reaction.
- Using fewer than five pH values, making a trend hard to see.
- Changing more than one variable (e.g. also changing the temperature or the glucose concentration).
Things to Be Careful About
The mark scheme gives 1 mark for each of: (1) standardising temperature with a thermostatically controlled water-bath at a stated temperature, (2) using at least five pH values, (3) using buffers. All three marks are independent and must each be addressed.
A student investigated the effect of concentration of glucose solution on the activity of a yeast cell suspension. The volume of carbon dioxide released was measured. All other variables were standardised.
The results of the student’s investigation are shown in Table 1.1.
Table 1.1
| percentage concentration of glucose solution | volume of released / |
|---|---|
| 0.5 | 0.6 |
| 1.0 | 2.8 |
| 2.0 | 4.5 |
| 4.0 | 5.3 |
| 8.0 | 6.2 |
You are required to use a sharp pencil for graphs.
Plot a graph of the data shown in Table 1.1.
Answer
The graph plots volume of CO₂ released (y-axis, /cm³) against percentage concentration of glucose solution (x-axis). The x-axis spans 0 to 10, scaled 2.0 per 2 cm, with major marks at 0, 2, 4, 6, 8, 10. The y-axis spans 0 to 8, scaled 1.0 per 2 cm, with major marks at 0, 1, 2, 3, 4, 5, 6, 7. The five points (0.5, 0.6), (1.0, 2.8), (2.0, 4.5), (4.0, 5.3), (8.0, 6.2) are plotted as small × marks, and a single smooth curve of best fit is drawn through them, rising steeply at first and then levelling off toward an asymptote near 6.5–7.0 cm³.
See working (line graph plotted: y = volume of CO₂ / cm³, x = % glucose; smooth curve through the five points).
Background Concept
A line graph is the standard way to display data when both variables are continuous and the independent variable is a measured quantity (not a category). Key conventions:
- The independent variable goes on the x-axis; the dependent variable on the y-axis.
- Both axes are labelled with the quantity and the unit (separated by a solidus, e.g. 'volume of CO₂ released / cm³').
- The scale is chosen so that the plotted data uses at least half the grid in both directions.
- Each major gridline represents a round number (e.g. 2.0), and the scale must be consistent (no awkward breaks).
- Each data point is marked with a small, clear cross (×) or dot in a circle (•). The mark is fine — not the body of the cross.
- A smooth curve of best fit is drawn when the data show a clear trend (not a straight line if the relationship is curved).
Understanding the Question
You are given a table of five data points showing the volume of CO₂ released at five different glucose concentrations. You need to plot a line graph of these data on the grid provided.
Approach
- Label the x-axis with the independent variable: percentage concentration of glucose solution.
- Label the y-axis with the dependent variable: volume of CO₂ released, with unit / cm³.
- Choose scales that use at least half the grid: 0 to 10 on x (2.0 per 2 cm), 0 to 8 on y (1.0 per 2 cm — or 2.0 per 2 cm if you use 0 to 8).
- Plot each of the five points with a small ×.
- Draw a single smooth curve of best fit through the points. The shape should be increasing and starting to level off (asymptotic).
Step-by-Step Reasoning
The data are: (0.5, 0.6), (1.0, 2.8), (2.0, 4.5), (4.0, 5.3), (8.0, 6.2).
The trend: the volume of CO₂ increases as glucose concentration increases, but the rate of increase slows — the curve flattens off at higher concentrations. This is consistent with the enzymes becoming saturated with substrate at high glucose concentrations.
Scales: with 2.0 on x-axis = 2 cm, the x-axis spans 0 to 10 in 10 cm (about half the 20-cm grid). With 1.0 on y-axis = 2 cm, the y-axis spans 0 to 7 in 14 cm (most of the grid).
Plotting: mark each point with a small ×, with the centre on the intersection. Then draw a smooth, continuous curve through the points. Do not join the points with straight line segments.
Key Takeaways
- Independent on x, dependent on y; both axes labelled with quantity and unit.
- Use at least half the grid; major gridlines at round numbers; no awkward breaks.
- Plot points with a clear, small cross; draw a smooth line of best fit.
Common Mistakes
- Plotting the independent variable on the y-axis.
- Missing the unit on the y-axis.
- Choosing a scale that compresses all the points into a corner (e.g. 0 to 100 on the y-axis).
- Joining the points with straight line segments instead of drawing a curve of best fit.
- Drawing large crosses that obscure the gridlines.
Things to Be Careful About
The mark scheme gives 1 mark for each of: (1) correct axis labels, (2) correct scale on both axes, (3) correct plotting of all five points, (4) a thin line drawn. The line is expected to be a smooth curve, not a series of straight segments between points, because the trend is clearly non-linear.
Use your graph to estimate the volume of released at 3.5% concentration of glucose solution.
volume = ______
Answer
volume = 5.0 cm³ (acceptable range 4.8–5.2 cm³, read from the curve at 3.5% on the x-axis).
≈ 5.0 cm³
Background Concept
A line graph can be used to find values of the dependent variable at intermediate values of the independent variable (interpolation) by reading off the curve at the desired x-value. This is more accurate than simple linear interpolation between the two nearest data points, because the curve takes account of the overall trend.
Understanding the Question
You are asked to use your graph to estimate the volume of CO₂ released when the glucose concentration is 3.5%. This is a value between two of the data points (2.0% and 4.0%), so it is found by interpolation.
Approach
- Find 3.5 on the x-axis.
- Draw a vertical line up from 3.5 until it meets the curve.
- From the intersection, draw a horizontal line across to the y-axis.
- Read off the y-value at the point where the horizontal line meets the y-axis.
Step-by-Step Reasoning
- The data give 4.5 cm³ at 2.0% and 5.3 cm³ at 4.0%.
- 3.5% is 75% of the way from 2.0% to 4.0%.
- On a smooth curve that is starting to level off, the value at 3.5% is slightly above the linear midpoint (4.9 cm³).
- The reading is approximately 5.0 cm³ (acceptable range: 4.8 to 5.2 cm³, depending on the exact curve drawn).
Key Takeaways
- Interpolation is read off the curve, not by simple averaging of the two adjacent data points.
- The curve takes account of the non-linear trend, so the read-off value may differ from a linear interpolation.
Common Mistakes
- Reading off the data table by linear interpolation (4.5 + 0.75 × (5.3 − 4.5) = 5.1), missing the curve's flattening.
- Reading at the wrong x-value (e.g. 3.0 or 4.0).
- Not including the unit cm³.
Things to Be Careful About
The mark scheme gives 1 mark for a correct read-off from the graph. The exact value depends on the curve drawn, but it should be in the range 4.8 to 5.2 cm³. Always include the unit.
The rest of this paper
1 more questions- Q2Use of the Light Microscope · Presentation of Data and Observations · Analysis, Conclusions and Evaluation20M