Biology 9700/31 — May/June 2016
Cambridge AS Level · Advanced Practical Skills · worked solutions for every part, with the mark scheme
Topics Presentation of Data and Observations · Analysis, Conclusions and Evaluation · Manipulation, Measurement and Observation · Use of the Light Microscope
Visking tubing, V, is selectively permeable, so that some biological molecules will diffuse through the wall of the tubing.
You are required to investigate the diffusion of reducing sugars into the water surrounding the Visking tubing.
Fig. 1.1 shows the apparatus you will set up for this investigation before the water has been added.
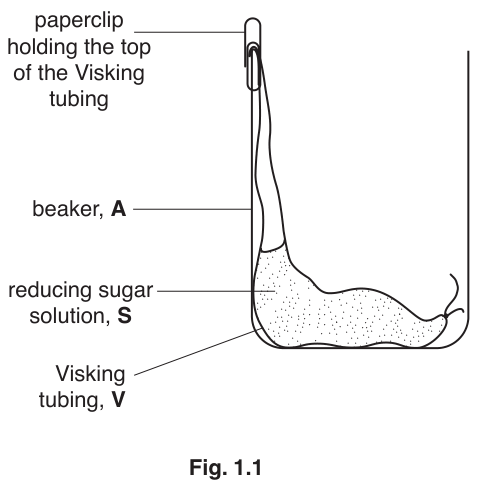
One sample of water surrounding the Visking tubing will be removed and tested using Benedict’s solution, so you need to take this into account when you decide the volume of water to put into the beaker.
Draw on Fig. 1.1 the level of water:
- before you remove the sample and label this level ‘before’
- after the volume of water needed for the test has been removed and label this level ‘after’.
Answer
Draw two horizontal lines on the inside of beaker A in Fig. 1.1:
- the higher line, labelled 'before', sits well above the level of the reducing sugar solution S inside the Visking tubing;
- the lower line, labelled 'after', is still above the level of S in the tubing, but below the 'before' line (lower by the depth that 2 cm³ of water occupies in the beaker).
Two horizontal water levels drawn on Fig. 1.1: 'before' higher, 'after' lower but still above the level of reducing sugar solution S in the Visking tubing.
Background Concept
Visking tubing is a selectively permeable membrane whose pores allow small molecules such as water and monosaccharides (e.g. glucose) to pass, but not larger molecules such as sucrose or starch. In this investigation, reducing sugar inside the tubing diffuses down its concentration gradient into the water surrounding the tubing. To test whether any reducing sugar has reached the surrounding water, a sample of that water is taken and heated with Benedict's solution: a positive result turns the blue Benedict's reagent green → yellow → orange → brick-red as the reducing sugar concentration increases.
The volume of water placed in the beaker matters for two reasons: it must be enough to submerge the lower end of the Visking tubing (otherwise no diffusion takes place), and it must include a margin so that 2 cm³ can be removed for the test without exposing the tubing to air.
Understanding the Question
Step 9 of the procedure removes 2 cm³ of water from the beaker for the Benedict's test. The candidate must mark, on Fig. 1.1, two water levels: one before the sample is removed and one after, making sure the lower level is still above the level of reducing sugar in the Visking tubing.
Approach
Estimate how much a 2 cm³ withdrawal will lower the water level in the beaker, then choose a starting level that sits safely above the top of the reducing sugar solution in the tubing. Mark this on the diagram as 'before'. Mark the same level minus the 2 cm³ volume as 'after'.
Step-by-Step Reasoning
- The Visking tubing contains 8 cm³ of reducing sugar solution S; the top of this liquid sits a little way up the inside of the tubing.
- To allow diffusion, the water in the beaker must cover the level of S inside the tubing.
- A 2 cm³ sample will be removed after 15 minutes, so the starting water level must be at least 2 cm³ higher than the minimum required to cover S.
- On Fig. 1.1, draw a line across the inside of the beaker at this safe starting level and label it 'before'.
- Draw a second line, lower than the first by the depth corresponding to 2 cm³, and label it 'after'.
- Confirm that the 'after' line is still above the top of the reducing sugar solution inside the tubing.
Key Takeaways
- The water level must always cover the Visking tubing to allow diffusion to occur.
- Any sample volume removed for testing must be allowed for when setting the initial volume.
- A simple visual way of indicating this on a figure is to draw two labelled water levels, 'before' and 'after'.
Common Mistakes
- Drawing only one line, or omitting the 'before'/'after' labels (loses 1 mark).
- Drawing the 'after' line below the level of the reducing sugar in the tubing, so that the tubing is no longer fully submerged (loses 1 mark).
- Drawing the 'after' line at the level of the reducing sugar solution rather than safely above it.
Things to Be Careful About
- The 'after' line must still leave the lower end of the Visking tubing submerged; a tiny gap will stop the diffusion and give a false negative in the Benedict's test.
You are provided with:
| labelled | contents | hazard | volume / |
|---|---|---|---|
| S | 20% reducing sugar solution | none | 25 |
| labelled | details |
|---|---|
| V | 15 cm length of Visking tubing in a beaker containing distilled water |
You are required to set up the apparatus as in Fig. 1.1, add the water and then remove a sample of this water (U) after 15 minutes.
Proceed as follows:
- Set up a water-bath and heat to boiling ready for step 13.
- Tie a knot in the Visking tubing as close as possible to one end so that it seals the end.
- To open the other end, wet the Visking tubing and rub the tubing gently between your fingers.
- Put of S into the open end of the Visking tubing.
- Rinse the outside of the Visking tubing by dipping it into the water in the container labelled ‘For washing’.
- Put the Visking tubing into the empty beaker, labelled A, as shown in Fig. 1.1.
- Make sure the open end of the Visking tubing is held in place by a paperclip.
- Put water from the container labelled V into A to the level you decided in (a)(i) and start timing. Leave for 15 minutes.
While you are waiting continue with Question 1.
- After 15 minutes, gently mix the water surrounding the Visking tubing.
Remove of the water and put this sample into a test-tube and label this U.
Stop timing.
You are required to:
- prepare different concentrations of reducing sugar solution
- find, for each reducing sugar solution, the time taken for the first appearance of a colour change when heated with Benedict’s solution
- estimate the concentration of the reducing sugar solution, U.
You are provided with:
| labelled | contents | hazard | volume / |
|---|---|---|---|
| G | 0.5% reducing sugar solution | none | 60 |
| W | distilled water | none | 250 |
| Benedict’s | Benedict’s solution | none | 50 |
You are required to prepare different concentrations of reducing sugar solution using G.
You will need to prepare of each concentration.
Table 1.1 shows how to make up one of the concentrations of reducing sugar solution you will use.
Decide which concentrations of reducing sugar solution to prepare:
- using simple dilution
- using 0.5% reducing sugar solution, G.
Complete Table 1.1 to show how you will prepare the other concentrations.
Table 1.1
| volume of 0.5% reducing sugar solution, G / | volume of distilled water, W / | final percentage concentration of reducing sugar solutions |
|---|---|---|
| 10.0 | 0.0 | 0.5 |
Answer
Use simple (proportional) dilutions of G (0.5% reducing sugar) with W (distilled water), each made up to 10 cm³ total.
| volume of 0.5% reducing sugar solution, G / cm³ | volume of distilled water, W / cm³ | final percentage concentration of reducing sugar solutions |
|---|---|---|
| 10.0 | 0.0 | 0.5 |
| 8.0 | 2.0 | 0.4 |
| 6.0 | 4.0 | 0.3 |
| 4.0 | 6.0 | 0.2 |
| 2.0 | 8.0 | 0.1 |
Each row totals 10 cm³, and the percentage concentration is calculated from C1V1 = C2V2 (e.g. (0.5 × 8.0) / 10.0 = 0.4%).
Table 1.1 completed with four simple dilutions: e.g. 0.4, 0.3, 0.2, 0.1% (volumes of G: 8, 6, 4, 2 cm³ with W: 2, 4, 6, 8 cm³ — each row totalling 10 cm³).
Background Concept
A simple (proportional) dilution is made by mixing a known volume of a stock solution with a known volume of solvent so that the final volume is fixed. The final concentration is given by the dilution equation C1V1 = C2V2, where C1 and V1 are the concentration and volume of the stock, and C2 and V2 are the concentration and total volume of the diluted solution.
Understanding the Question
The candidate must complete Table 1.1 by choosing at least four more concentrations of reducing sugar between 0% and 0.5% (i.e. between 0 cm³ of G and 10 cm³ of G), preparing each as 10 cm³ total using G and W. The dilutions should be 'simple', so the volumes of G and W should change by equal steps.
Approach
Decide the four additional concentrations you would like to use (e.g. 0.4, 0.3, 0.2, 0.1%) and back-calculate the volumes of G and W using C1V1 = C2V2 with V2 = 10 cm³. Alternatively, divide the 10 cm³ total into equal volume steps and calculate the resulting concentration for each.
Step-by-Step Reasoning
- The first row (10.0 cm³ G + 0.0 cm³ W) is given and corresponds to 0.5% (the original concentration of G).
- To make 0.4% from 0.5% in 10 cm³: C1V1 = C2V2 → 0.5 × V1 = 0.4 × 10 → V1 = 8.0 cm³ of G, so 2.0 cm³ of W.
- To make 0.3%: 0.5 × V1 = 0.3 × 10 → V1 = 6.0 cm³ of G, so 4.0 cm³ of W.
- To make 0.2%: V1 = 4.0 cm³ of G, so 6.0 cm³ of W.
- To make 0.1%: V1 = 2.0 cm³ of G, so 8.0 cm³ of W.
- Each row of the table totals 10 cm³ and gives a simple 2 cm³ dilution step from its neighbour.
Key Takeaways
- Simple dilutions use equal volume steps; this makes the table easy to read and the pipetting easy to perform.
- The dilution equation C1V1 = C2V2 is the working tool: V1 = (C2 × V2) / C1.
- For a calibration curve, five standards spanning the expected range of the unknown (here 0–0.5%) are usually appropriate.
Common Mistakes
- Choosing dilutions that do not sum to 10 cm³ (e.g. 5.0 cm³ G + 4.0 cm³ W).
- Calculating the wrong concentration, e.g. dividing 0.5 by the volume of G used (which would give 0.5 / 8.0 = 0.0625, not 0.4).
- Choosing a non-simple set of dilutions (e.g. 0.45, 0.35, 0.25, 0.15%) — the question explicitly asks for simple dilutions.
Things to Be Careful About
- Always check that V1 + Vsolvent = Vtotal (10 cm³) for every row.
- Choose a range that brackets the expected concentration of U. The unknown has diffused out of an 8 cm³, 20% solution into the water outside, so it will be much less than 20% — a range of 0.1–0.5% is sensible.
- Prepare the concentrations of reducing sugar solutions as shown in Table 1.1, in the beakers provided.
- Put of the highest percentage concentration of reducing sugar solution into a test-tube.
- Put of Benedict’s solution into the same test-tube.
- Put this test-tube into the water-bath (prepared in step 1) and record the time taken for the first appearance of a colour change in (a)(iii).
If there is no colour change after 120 seconds, stop timing and record the time as ‘more than 120’. - Repeat step 11 to step 13 for each of the other concentrations you prepared in step 10.
Prepare the space below and record your results.
Answer
A results table with the highest concentration at the top and the others in decreasing order, with the heading in the first cell (top-left), the time in whole seconds, and the correct units.
| percentage concentration of reducing sugar solution | time for first appearance of colour change / s |
|---|---|
| 0.5 | 25 |
| 0.4 | 35 |
| 0.3 | 50 |
| 0.2 | 70 |
| 0.1 | 110 |
(Values are illustrative — actual times depend on the candidate's experiment.)
Results table with the heading 'percentage concentration of reducing sugar solution', times in whole seconds with units 's', and the highest concentration at the top with the others in decreasing order.
Background Concept
The Benedict's test is a semi-quantitative test for reducing sugars. When heated with a reducing sugar, the blue Cu²⁺-containing Benedict's reagent is reduced to a brick-red precipitate of copper(I) oxide. The time taken for the first appearance of any colour change (typically a green tinge) is inversely related to the concentration of reducing sugar: a more concentrated solution produces a faster, more intense colour change.
Understanding the Question
After preparing a series of reducing sugar standards in (a)(ii), the candidate heats each with Benedict's solution in a boiling water-bath and times how long it takes for the first appearance of a colour change. They must design a results table that meets standard presentation conventions, then record their times.
Approach
Lay out a two-column table. The first column is the independent variable (concentration); the second is the dependent variable (time). Use full, descriptive headings — not just 'concentration' and 'time' — and put the units in the heading (or below a dividing line), not after every value. Order the concentrations from highest to lowest so that the trend down the table matches the trend in the variable.
Step-by-Step Reasoning
- Write the heading for the independent variable in the first cell (top-left), e.g. 'percentage concentration of reducing sugar solution'. (Mark 1)
- Write the heading for the dependent variable in the second cell, including the units, e.g. 'time for first appearance of colour change / s' (or similar wording with time + seconds). (Mark 2)
- Record the time for the highest concentration first (0.5%), then continue down the table in decreasing order. (Marks 3 and 4)
- Record each time as a whole number of seconds (no decimals), e.g. 25, 35, 50, 70, 110. (Mark 3)
- The trend in the data should be: time increases as concentration decreases (lower concentration → slower colour change → longer time).
Key Takeaways
- Headings should describe the variable, not just name it. Avoid the bare words 'concentration' and 'time'.
- Units belong in the heading, not after every value.
- The 'concentration at top, others in decreasing order' rule makes the table easy to read and matches the convention of having the highest value nearest the origin of a graph.
Common Mistakes
- Writing 'time (s)' in the heading without saying what is being timed (e.g. 'time for first appearance of colour change / s').
- Recording times to one decimal place (e.g. 25.0 s) — the procedure asks for whole seconds.
- Listing the concentrations in increasing order (lowest at top), which loses the 'concentration at top' mark.
- Using the wrong units (e.g. minutes instead of seconds).
Things to Be Careful About
- The Benedict's test is non-linear in time: doubling the concentration does not halve the time. The table does not need to show a perfectly proportional pattern — the trend simply needs to be monotonic decreasing time with increasing concentration.
- If no colour change is seen after 120 s, the instruction says to record 'more than 120' — this is still a valid whole-second entry (it is a single observation, not a precise number).
You are required to use the same procedure to estimate the concentration of reducing sugar in the sample U (from step 9).
State which variable you will need to standardise when testing U.
Answer
Any one of:
- the volume of Benedict's solution ()
- the volume of sample U ()
- the temperature of the water-bath (boiling)
For example: 'Use of Benedict's solution for every test, the same as for the standards in (a)(iii).'
e.g. volume of Benedict's solution (3 cm³).
Background Concept
A controlled (standardised) variable is one that is kept the same across every experimental run, so that any change in the dependent variable can be attributed to the independent variable. In a Benedict's test, the reaction rate depends not only on the concentration of reducing sugar (the independent variable here) but also on the temperature, the volume of Benedict's solution, the volume of sugar solution, and the timing protocol. To make a fair comparison between the unknown sample U and the standards, all of these must be held constant.
Understanding the Question
The procedure used in (a)(iii) was: 2 cm³ of reducing sugar + 3 cm³ of Benedict's, heated in a boiling water-bath, timed to the first colour change. The same procedure will now be applied to U, but the question asks specifically which ONE variable needs to be standardised to make this comparison fair.
Approach
Look at the things that the candidate is free to vary when running the test on U: the volume of Benedict's they pipette, the volume of U they transfer, the temperature of the water-bath, the depth of the tube in the bath, the start-time convention, and so on. Pick the one that is most obviously a separate variable and most strongly affects the result.
Step-by-Step Reasoning
- The unknown sample U must be tested under the SAME conditions as the standards, otherwise the time recorded for U is not directly comparable to the times in (a)(iii).
- The mark scheme accepts any of three answers:
- the volume of Benedict's solution (3 cm³),
- the volume of sample U (2 cm³),
- the temperature of the water-bath (boiling).
- Any of these is correct; choose one and state it clearly.
Key Takeaways
- In a calibration / estimation experiment, the unknown and the standards must be run under identical conditions.
- Volume of reagent, volume of sample, and temperature are the three most commonly standardised variables in a Benedict's test.
Common Mistakes
- Naming 'concentration of Benedict's solution' — this is the same for every test because the same Benedict's stock is used, so it is not a variable the candidate is free to change.
- Naming 'time' — the time is the dependent variable, not a variable to be standardised.
- Naming 'amount of reducing sugar' — that is what the test is trying to measure, not standardise.
Things to Be Careful About
- The mark scheme accepts any one of three answers; giving more than one does not earn extra credit and can be a sign of uncertainty.
- Carry out the standardised test for the sample, U.
Record the time taken for the first appearance of a colour change for U.
U = ______
Answer
U = 45 s (representative value — the actual time depends on the candidate's own experiment; the mark is for whole seconds and the correct unit).
Acceptable format: a whole number followed by the unit 's' (or 'seconds').
e.g. 45 s.
Background Concept
The Benedict's test for reducing sugar is timed from the moment the test-tube is placed in the boiling water-bath until the first appearance of any colour change (typically the first green tinge in the otherwise blue solution). The shorter the time, the higher the concentration of reducing sugar in the sample.
Understanding the Question
After standardising the test conditions in (a)(iv), the candidate runs the same Benedict's test on the unknown sample U and records the time for the first colour change.
Approach
Place the test-tube (containing 2 cm³ of U and 3 cm³ of Benedict's) in the boiling water-bath, start timing immediately, and stop the timer the moment a colour change is first visible. Record the time to the nearest whole second.
Step-by-Step Reasoning
- The volume of U and the volume of Benedict's must be the same as for the standards (2 cm³ + 3 cm³), so the comparison is fair.
- Start the timer as soon as the test-tube enters the boiling water-bath.
- Watch the lower part of the liquid (where the colour is easiest to see) and stop the timer the moment any change from blue is observed.
- Record the time as a whole number of seconds, e.g. '45 s'.
- The mark scheme awards 1 mark for the time being a whole number with the correct unit.
Key Takeaways
- The format of a timed observation in Paper 3 is: whole number + unit (e.g. '45 s', never '45' alone, and never '0.75 min' as the procedure uses seconds).
- The result will be used in (a)(vi) to estimate the concentration of U from the calibration curve in (a)(iii).
Common Mistakes
- Writing the time with decimal places (e.g. 45.0 s) — the procedure says to time in whole seconds.
- Omitting the unit (e.g. just '45').
- Writing the unit as 'sec' or 'seconds' is acceptable as long as the unit is unambiguous.
Things to Be Careful About
- The end-point is the FIRST appearance of colour change, not the final brick-red colour. Watching the very start of the colour change is harder than waiting for the full colour, so the candidate should look carefully.
Use your results in (a)(iii) to estimate the percentage concentration of reducing sugar in U.
Answer
The time for U is compared with the times for the standards in (a)(iii) and the concentration of the closest standard is quoted (or interpolated between two adjacent standards).
For example, if U = 45 s, the standards at 0.3% (50 s) and 0.4% (35 s) bracket it. By interpolation, the concentration of U is approximately:
so the estimated concentration of U is about 0.3% (representative — depends on the candidate's own times).
e.g. ~0.3% (representative — depends on the candidate's own data in (a)(iii) and (a)(v)).
Background Concept
A calibration curve (or calibration table) is built from a series of standards of known concentration. Once the curve is established, the concentration of an unknown can be read off by finding the value on the y-axis (the dependent variable — here, the time for the first colour change) and reading across to the curve, then down to the x-axis (the independent variable — concentration).
Understanding the Question
The candidate must use the times recorded in (a)(iii) for the standards and the time recorded in (a)(v) for U to estimate the percentage concentration of reducing sugar in U. The mark is for giving a numerical estimate that is consistent with the candidate's own data.
Approach
Look at the time for U and find the standard with the closest (or bracketing) time. Read off that standard's concentration, or interpolate between two adjacent standards to get a more accurate value.
Step-by-Step Reasoning
- The candidate's results in (a)(iii) give times for 0.5, 0.4, 0.3, 0.2 and 0.1% reducing sugar standards. (The exact values depend on the experiment; the illustrative set used here is 25, 35, 50, 70 and 110 s.)
- The time for U in (a)(v) is, say, 45 s. (Again, illustrative.)
- 45 s falls between 50 s (0.3%) and 35 s (0.4%).
- By linear interpolation between these two standards, the concentration of U is:
- 0.3% + (50 − 45) / (50 − 35) × (0.4 − 0.3) = 0.3 + (5/15) × 0.1 ≈ 0.33%.
- The estimate is therefore approximately 0.3% (or 0.33% to two significant figures).
Key Takeaways
- A simple read-across from a calibration table is the basis of an estimation, not a precise measurement.
- Interpolation between two adjacent standards is more accurate than simply choosing the closest standard.
- The mark scheme requires the candidate's estimate to be consistent with their own (a)(iii) and (a)(v) data — there is no single 'correct' answer, only a reasonable one.
Common Mistakes
- Giving a value wildly outside the calibrated range, e.g. 5% or 0.01% — the diffusion from a 20% solution into a much larger volume of water cannot produce such a value.
- Failing to use the candidate's own data — quoting a textbook number instead of their own time.
- Interpolating incorrectly (e.g. using the wrong pair of standards).
Things to Be Careful About
- The calibration is non-linear: the time roughly doubles when the concentration halves, but the exact relationship depends on the experimental conditions. The estimate should be reasonable, not over-precise.
Reducing sugars are produced when an enzyme, E, hydrolyses sucrose. The reducing sugars change the colour of pink potassium manganate(VII) solution to a colourless end-point.
The rate of colour change depends on the concentration of the reducing sugar solution. The greater the reducing sugar concentration the faster the end-point is reached.
A student investigated the effect of the concentration of sucrose solution on the activity of enzyme, E by recording the time taken to decolourise potassium manganate(VII) solution.
All other variables were standardised.
The results of the student’s investigation are shown in Table 1.2.
Table 1.2
| percentage concentration of sucrose solution | time to decolourise potassium manganate(VII) solution / s |
|---|---|
| 0.5 | 158.0 |
| 1.0 | 84.0 |
| 1.5 | 74.0 |
| 2.0 | 32.0 |
| 2.5 | 22.0 |
You are required to use a sharp pencil for graphs.
Plot a graph of the data shown in Table 1.2.

Answer
A line graph plotted on the given grid:
- x-axis: percentage concentration of sucrose solution, from 0.5 to 2.5;
- y-axis: time to decolourise potassium manganate(VII) solution / s, from 40 to 180;
- x-scale: 0.5 per 2 cm (so 0.5, 1.0, 1.5, 2.0, 2.5 are each labelled at 2 cm intervals);
- y-scale: 20 s per 2 cm (so 40, 60, 80, 100, 120, 140, 160, 180 are each labelled at 2 cm intervals);
- points: each plotted as a small cross or an encircled dot at (0.5, 158), (1.0, 84), (1.5, 74), (2.0, 32), (2.5, 22);
- line: a single thin line of best fit through the points (a smooth curve, falling steeply at first and then more gradually, with the data points scattered around it).
Line graph on the supplied grid: x = % sucrose, y = time / s; five points plotted as small crosses with a thin line of best fit.
Background Concept
A line graph is used when both the independent and the dependent variables are continuous (here, percentage concentration and time in seconds). A well-drawn line graph has:
- the independent variable on the x-axis and the dependent variable on the y-axis;
- axes labelled with the quantity AND the unit (in the heading or below a dividing line);
- a scale that uses at least half of the grid in both directions, is round-number friendly, and does not have an awkward zero break (unless the data really demands one);
- points plotted as small, precise crosses or encircled dots;
- a thin line of best fit (a smooth curve or a straight line) drawn through the points — not dot-to-dot.
Understanding the Question
The candidate must plot the data in Table 1.2 on the given grid, with the percentage concentration of sucrose on the x-axis and the time to decolourise potassium manganate(VII) on the y-axis, and then draw a line of best fit. The marks are for the four presentation conventions described below.
Approach
Decide a sensible scale for each axis (looking at the range of the data and the size of the grid), label the axes with quantity and unit, plot the five points accurately, and add a single thin line that follows the trend.
Step-by-Step Reasoning
- Axes and labels (Mark 1):
- x-axis: percentage concentration of sucrose solution (the % symbol or 'percentage' is part of the heading).
- y-axis: time to decolourise potassium manganate(VII) solution / s.
- Scales (Mark 2):
- x-axis from 0.5 to 2.5; 0.5 takes 2 cm (so labels at 0.5, 1.0, 1.5, 2.0, 2.5 — each at 2 cm intervals, filling 10 cm of the 20 cm grid).
- y-axis from 40 to 180; 20 s takes 2 cm (so labels at 40, 60, 80, 100, 120, 140, 160, 180 — eight labels, filling 16 cm of the grid).
- Plots (Mark 3):
- (0.5, 158) — near the top-left of the grid;
- (1.0, 84) — about a third of the way up the y-axis;
- (1.5, 74) — slightly lower than the previous point;
- (2.0, 32) — near the bottom of the y-axis;
- (2.5, 22) — slightly lower than the previous point.
- Line of best fit (Mark 4):
- A single thin line drawn through the points. The trend is sharply falling at first (158 → 84 as % goes 0.5 → 1.0) and then more gradual (74 → 32 → 22 as % goes 1.5 → 2.0 → 2.5). A smooth curve, not dot-to-dot, captures this best.
Key Takeaways
- The choice of scale is a key part of the mark scheme. Use a round-number scale that covers the data and uses at least half the grid; here 0.5 per 2 cm and 20 per 2 cm work well.
- A non-zero origin on the y-axis (here, starting at 40 rather than 0) is acceptable, but the candidate should consider whether the truncation distorts the shape of the trend. With 22 as the lowest data point, starting at 0 would compress the data into the top half of the grid, which is why the mark scheme starts at 40.
- The line of best fit is a single line that follows the trend; the data points are scattered around it, not on it.
Common Mistakes
- Plotting the axes as if the x-axis were the dependent variable (i.e. time on the x-axis, concentration on the y-axis).
- Omitting the unit on the y-axis heading, or putting 's' after every plotted point.
- Using a non-linear or awkward scale (e.g. 3 s per 2 cm), which makes plotting difficult.
- Joining the points dot-to-dot (rather than drawing a single line of best fit).
- Drawing a thick, doubled or fuzzy line — the mark scheme requires a thin line.
Things to Be Careful About
- The y-axis scale starts at 40 (not 0) because the lowest data point is 22. If the scale started at 0, the 20 s per 2 cm scale would push the highest data point (158) close to the right edge of the grid.
- The candidate should use a sharp pencil so the points and line are clear and unambiguous.
Estimate the time to decolourise potassium manganate(VII) solution at 1.75% sucrose concentration.
Show on your graph how you obtained the time to decolourise potassium manganate(VII) solution.
time = ______
Answer
On the graph in (b)(i), draw a vertical dashed line from x = 1.75 up to the line of best fit, then a horizontal dashed line from that intersection across to the y-axis. Read the y-value where the horizontal line meets the y-axis.
By linear interpolation between the two data points (1.5, 74) and (2.0, 32):
So the time to decolourise at 1.75% sucrose is approximately 53 s (representative — the actual value depends on the candidate's own line of best fit).
e.g. 53 s.
Background Concept
Reading a value from a graph at an x-value that is not a data point is called interpolation. The standard technique is to draw a vertical line from the x-value up (or down) to the curve, then a horizontal line from the curve to the y-axis, and read the value at the point where the horizontal line meets the y-axis. When the curve is roughly linear between two adjacent data points, a simple linear interpolation gives a good estimate.
Understanding the Question
The candidate must read off the time to decolourise potassium manganate(VII) at 1.75% sucrose from the graph drawn in (b)(i) and show the construction (the two dashed lines).
Approach
Locate 1.75 on the x-axis (midway between 1.5 and 2.0), draw a vertical dashed line up to the line of best fit, then a horizontal dashed line from that intersection across to the y-axis. Read the value on the y-axis and quote it with the unit (s).
Step-by-Step Reasoning
- The data points either side of 1.75% are (1.5, 74) and (2.0, 32). The line of best fit passes between them.
- 1.75 is the midpoint of 1.5 and 2.0, so a linear interpolation gives the midpoint of 74 and 32:
- time ≈ (74 + 32) / 2 = 106 / 2 = 53 s.
- The same result is obtained by drawing a vertical dashed line at x = 1.75 and reading where it meets the line of best fit.
- Quote the value to the nearest whole second with the correct unit, e.g. 53 s.
Key Takeaways
- The mark scheme awards 1 mark for the numerical value and 1 mark for the unit (s).
- Always show the construction (the two dashed lines) on the graph — the question asks for it explicitly ('Show on your graph how you obtained the time to decolourise…').
- A simple linear interpolation is appropriate when the data on either side of the read-off x-value is approximately linear.
Common Mistakes
- Reading the value from a data point rather than from the line of best fit (e.g. quoting 74 s — the time at 1.5% — instead of the time at 1.75%).
- Omitting the unit (s).
- Quoting the value to too many significant figures (e.g. 53.0 s) — the read is to the nearest whole second.
- Failing to show the dashed construction lines on the graph.
Things to Be Careful About
- The mark scheme says 'correctly reads from graph', so the value must come from the candidate's OWN line of best fit, not from a textbook value.
Using the data in Table 1.2 and your graph, explain the relationship between the concentration of sucrose solution and the enzyme activity.
Answer
- As the concentration of sucrose increases, there is more substrate available for enzyme E to act on.
- This means that, per unit time, more active sites of enzyme E are occupied / more enzyme-substrate complexes (ESCs) form, so the rate of hydrolysis of sucrose is higher.
- A higher rate of hydrolysis produces reducing sugars faster, so potassium manganate(VII) is decolourised more quickly and the time taken to the end-point is shorter.
More sucrose gives more substrate so more active sites of enzyme E are occupied / more enzyme–substrate complexes form per unit time, increasing the rate of hydrolysis and shortening the time to decolourise KMnO4.
Background Concept
The rate of an enzyme-catalysed reaction depends on how often enzyme and substrate molecules collide productively. At low substrate concentrations, many enzyme active sites are empty and the rate is limited by substrate availability; as substrate concentration rises, more active sites are filled at any one time, more enzyme–substrate complexes (ESCs) form per second, and the rate of reaction increases. Eventually the enzyme becomes saturated and the rate plateaus (the Vmax).
In this experiment, enzyme E hydrolyses sucrose into its component monosaccharides (glucose and fructose), both of which are reducing sugars. The reducing sugars then reduce the purple potassium manganate(VII) to a colourless solution; the time taken to reach the colourless end-point is therefore a measure of how fast the reducing sugars are being produced — i.e. a measure of the rate of the enzyme-catalysed reaction.
Understanding the Question
Using the data in Table 1.2 and the graph in (b)(i), the candidate must explain the relationship between sucrose concentration and the time to decolourise KMnO4. The two marks are for two linked ideas: more substrate, and more active sites occupied / more ESCs.
Approach
State the observed trend (as sucrose concentration rises, the time to decolourise falls, i.e. the rate rises). Then explain it in two steps: (1) more sucrose = more substrate; (2) more substrate = more active sites occupied / more ESCs per unit time = higher rate = less time to decolourise.
Step-by-Step Reasoning
- The data show that the time to decolourise KMnO4 falls from 158 s at 0.5% sucrose to 22 s at 2.5% sucrose — a 7-fold decrease in time, i.e. a 7-fold increase in rate.
- The enzyme is present at a fixed concentration, so the change in rate is due to the change in substrate concentration.
- With more sucrose, there are more substrate molecules available to collide with the active sites of enzyme E.
- As a result, more active sites are occupied at any one moment, and more enzyme-substrate complexes (ESCs) form and break down per unit time.
- Each ESC that breaks down releases reducing sugars, so the concentration of reducing sugars rises faster, and KMnO4 is reduced (decolourised) more quickly.
- Therefore, the time to decolourise KMnO4 is inversely related to the sucrose concentration.
Key Takeaways
- The mark scheme awards one mark for the idea of 'more substrate / higher activity' and one for the mechanism ('more active sites occupied' or 'more ESCs'). Both points must be made.
- The biological principle is the substrate-concentration dependence of enzyme rate up to Vmax; here, all five sucrose concentrations are still on the rising part of the rate vs. [substrate] curve.
- The experiment is a coupled assay: the enzyme reaction produces the reducing sugar, and the reducing sugar drives the colour change. The colour change is therefore an indirect measure of enzyme activity.
Common Mistakes
- Saying 'more enzyme activity' without explaining why (i.e. without linking it to substrate availability and active-site occupancy).
- Confusing enzyme concentration with substrate concentration (the enzyme concentration is constant; only the sucrose concentration varies).
- Saying 'faster collisions' without specifying that the collisions are between enzyme and substrate and lead to ESCs.
- Saying the rate increases with substrate concentration but failing to explain how that produces a SHORTER time to decolourise KMnO4.
Things to Be Careful About
- 'Higher enzyme activity' is acceptable shorthand for the first mark, but the second mark REQUIRES the mechanistic explanation (more active sites occupied / more ESCs).
- Note that the reaction is substrate-limited, not enzyme-limited: at higher sucrose concentrations the rate continues to rise because there are still free active sites. The data do not yet show a plateau, so Vmax has not been reached in this range.
This student’s procedure investigated the effect of sucrose concentration on the rate of enzyme activity.
To modify this procedure for investigating another variable, the independent variable (sucrose concentration) would need to be standardised.
Describe how sucrose concentration could be standardised.
Now consider how you could modify the student’s procedure to investigate the effect of pH on the hydrolysis of sucrose.
Describe how this independent variable, pH, could be investigated.
Answer
-
Standardise the sucrose concentration: use the same (named) percentage concentration of sucrose solution in every experimental run, e.g. 2.0%.
-
Range of pH: use at least five different pH values, e.g. pH 4, 5, 6, 7, 8 (regular intervals across the working range of the enzyme).
-
Method of setting pH: use buffer solutions at each chosen pH to prepare the sucrose solution (or to incubate the enzyme and substrate together), so that the pH is held constant during the reaction.
Standardise: use the same (e.g. 2.0%) sucrose concentration in every run. pH: test at least five pH values across the working range. Method: use buffer solutions at each pH to control the pH of the reaction mixture.
Background Concept
To investigate the effect of a NEW independent variable on the rate of an enzyme-catalysed reaction, every other variable must be held constant. In a fair test:
- the enzyme concentration is fixed (otherwise changes in rate could be due to changes in enzyme, not the variable of interest);
- the substrate concentration is fixed (otherwise changes in rate could be due to substrate, not the variable of interest);
- the temperature is fixed (otherwise changes in rate could be due to temperature, not the variable of interest);
- the pH is the independent variable — it is the only thing that changes between experimental runs.
Buffer solutions are used to maintain a constant pH during a reaction. A buffer resists changes in pH when small amounts of acid or alkali are added, and so keeps the pH of the reaction mixture close to the chosen value. The standard buffer systems for A-level Biology are:
- phosphate buffer (effective around pH 6–8);
- citrate buffer (effective around pH 3–6);
- carbonate/bicarbonate buffer (effective around pH 9–10);
- Tris buffer (effective around pH 7–9).
Understanding the Question
The candidate is asked first how to standardise the existing independent variable (sucrose concentration) when it is no longer the variable of interest, and then how to design the new investigation around pH as the independent variable.
Approach
For (1): state that the same sucrose concentration will be used in every run, and ideally name a specific value.
For (2): give at least five pH values, spaced at regular intervals across the working range of the enzyme.
For (3): describe the use of buffer solutions to maintain each pH.
Step-by-Step Reasoning
- Standardise the sucrose concentration: pick a value from the centre of the range used in the original experiment (e.g. 2.0%) and use the same 2.0% sucrose solution in every run. This means changes in rate can be attributed to pH, not to changes in substrate availability.
- Range of pH: choose at least five pH values. For a typical hydrolysis enzyme, pH 4, 5, 6, 7 and 8 is a sensible range. The values should be evenly spaced and bracket the expected optimum.
- Method of setting pH: dissolve the sucrose in a buffer solution at the chosen pH (or pre-incubate the enzyme in the buffer) so that the pH of the reaction mixture is held at the desired value. The buffer must be at the same pH as the test value; the sucrose concentration must be the same in every buffer (so it does not vary between runs).
- All other variables (temperature, enzyme concentration, volume of reactants, timing procedure) are kept the same as in the original procedure.
Key Takeaways
- A controlled experiment changes ONE independent variable at a time and holds everything else constant.
- Buffer solutions are the standard way to maintain a constant pH during a reaction; using a strong acid or alkali directly would not keep the pH constant as the reaction proceeds.
- Five values of the independent variable is the minimum for a meaningful trend; the standard CIE advice is to use at least five.
Common Mistakes
- Suggesting 'use different concentrations of HCl and NaOH to change the pH' — these would not maintain a constant pH during the reaction, and would also add chloride or sodium ions that could affect the enzyme.
- Naming fewer than five pH values (e.g. just 'pH 5 and pH 7') — the mark scheme requires at least five.
- Failing to name a specific sucrose concentration to standardise (e.g. just saying 'use the same sucrose concentration').
- Adding the enzyme to the buffer BEFORE adjusting the pH, or vice versa, without a clear order of operations.
Things to Be Careful About
- The enzyme concentration must ALSO be standardised (although the mark scheme does not require it to be stated, it is implicit in a fair test).
- The temperature of the water-bath must remain the same in every run (this is also part of the standardised variables, even though the question focuses on sucrose and pH).
The rest of this paper
1 more questions- Q2Use of the Light Microscope · Presentation of Data and Observations · Analysis, Conclusions and Evaluation18M