Biology 9700/33 — February/March 2016
Cambridge AS Level · Advanced Practical Skills · worked solutions for every part, with the mark scheme
Topics Manipulation, Measurement and Observation · Presentation of Data and Observations · Analysis, Conclusions and Evaluation · Use of the Light Microscope
The concentration of protein in a person’s urine may be measured to identify certain health problems.
You are required to:
- prepare different concentrations of the protein solution, P
- standardise and carry out the tests for protein concentration
- record the results of tests for the known concentrations of protein and an unknown sample, U
- estimate the concentration of protein in U.
The protein concentration can be measured by using potassium hydroxide solution and copper sulfate solution.
Fig. 1.1 shows the result of adding potassium hydroxide solution and copper sulfate solution to a sample containing protein.
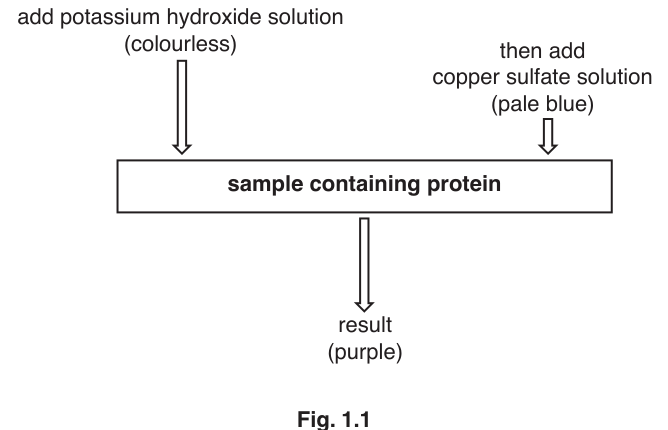
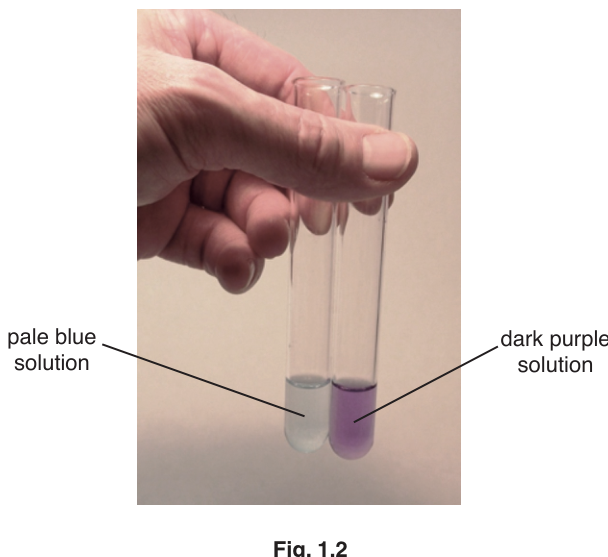
Fig. 1.2 shows an example of a solution containing no protein (pale blue) and an example of a solution containing a high concentration of protein (dark purple), after testing.
You are provided with:
| labelled | contents | hazard | volume / |
|---|---|---|---|
| P | 1.0% protein solution | none | 25 |
| U | sample of unknown protein concentration | none | 10 |
| W | distilled water | none | 25 |
| K | potassium hydroxide solution | corrosive | 15 |
| C | copper sulfate solution | none | 15 |
You are advised to wear suitable eye protection, especially when using the potassium hydroxide solution, K. If K comes into contact with your skin, wash off with cold water.
When carrying out a practical procedure, the hazards of using the solutions need to be considered. Then the level of risk needs to be assessed as low or medium or high.
State the hazard with the greatest level of risk when using the solutions, then state the level of risk of the procedure: low or medium or high.
hazard ______
level of risk ______
Table 1.1 shows how to make up two of the concentrations of protein solution you will use.
Decide which concentrations of protein solution to prepare using simple dilution of the 1.0% protein solution, P.
Complete Table 1.1 to show how you will prepare the other concentrations.
Table 1.1
| volume of 1.0% protein solution, P / | volume of distilled water, W / | percentage concentration of protein solution |
|---|---|---|
| 5 | 0 | 1.0 |
| 0 | 5 | 0.0 |
Proceed as follows:
- Prepare the concentrations of protein solution, as shown in Table 1.1, in the beakers provided.
- Put of the 1.0% protein solution into a test-tube.
- Put of K into the same test-tube. Shake gently to mix.
- Using the syringe labelled C, put of C into the same test-tube. Shake gently to mix.
You are required to standardise this test (step 2 to step 4) to be able to use the results to estimate the concentration of protein in U.
State which variable you will need to standardise when testing the other protein solutions and U.
Read step 5 to step 8 before proceeding.
- Carry out the standardised test for each of the protein solutions prepared in step 1.
- Record your observations of the colour of each solution in (b)(iii).
- In a test-tube rack, put the test-tubes in order of palest blue to darkest purple.
- Record in (b)(iii) each colour as a number using the scale shown in Fig. 1.3.
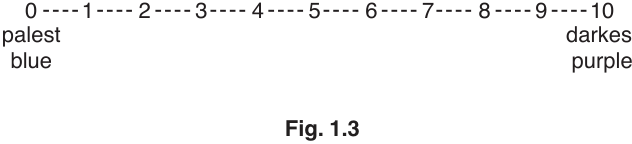
Prepare the space below and record your observation for each test-tube as a colour and its number, using the scale in Fig. 1.3.
- Carry out the standardised test with a sample of U.
Using the scale in Fig. 1.3 and the result for this test of U, state the number that represents the colour when compared with the results in (b)(iii).
number for U ______
Use your results to estimate the concentration of protein in U.
estimated concentration of protein in U = ______
Identify one significant source of error when estimating the concentration of protein in U.
Scientists may use another method to measure the protein concentration in urine samples. A sample of urine is put into a test-tube and an equal volume of reagent X is added.
When the mixture is shaken, a cloudy precipitate of protein forms.
A colorimeter can be used to measure the quantity of light absorbed (absorbance) by a solution.
After adding reagent X, a scientist used a colorimeter to obtain the absorbance of:
- six solutions of known protein concentration
- a urine sample (of unknown protein concentration).
A calibration graph was drawn by plotting the absorbance against the known concentrations of protein in the six solutions. The graph can be used to estimate the concentration of protein in the urine sample.
Table 1.2 shows the results for the absorbance of solutions of known protein concentration.
Table 1.2
| protein concentration / | absorbance |
|---|---|
| 0 | 0.00 |
| 100 | 0.06 |
| 200 | 0.36 |
| 450 | 0.28 |
| 760 | 0.47 |
| 900 | 0.52 |
State two of the variables which need to be standardised when using this method to compare different samples of urine.
Describe a method which can be used to standardise each of these variables.
variable 1 ______
description ______
variable 2 ______
description ______
Plot a graph of the data shown in Table 1.2.

Draw a circle on the graph to show the anomalous result.
Use your graph to estimate the concentration of protein in a urine sample with an absorbance of 0.49.
Show on your graph how you estimated the concentration of protein.
concentration of protein = ______
The rest of this paper
1 more questions- Q2Use of the Light Microscope · Manipulation, Measurement and Observation · Analysis, Conclusions and Evaluation · Presentation of Data and Observations18M