Biology 9700/36 — October/November 2015
Cambridge AS Level · Advanced Practical Skills · worked solutions for every part, with the mark scheme
Topics Use of the Light Microscope · Manipulation, Measurement and Observation · Presentation of Data and Observations · Analysis, Conclusions and Evaluation
When onion cells are placed into a solution, water will move depending on the water potential inside the cells and the water potential of the surrounding solution.
You are required to:
- investigate the effect of sodium chloride solution on onion epidermis cells
- observe the effect of adding iodine solution to the onion epidermis cells
- observe the effect on the onion epidermis cells of replacing the sodium chloride solution with water
- calculate the percentage plasmolysis of the cells in the onion epidermis.
You are provided with:
| labelled | contents | hazard | volume / |
|---|---|---|---|
| W | distilled water | none | 50 |
| I | iodine solution | irritant | 10 |
You are also provided with:
- onion tissue in sodium chloride solution, in a container labelled S1.
You are required to observe and draw cells from:
- onion tissue from S1
- onion tissue from S1 after staining with solution I.
Proceed as follows:
- Label one clean and dry microscope slide as S1 and put the slide on a paper towel.
- Put a few drops of sodium chloride solution from S1 onto the slide.
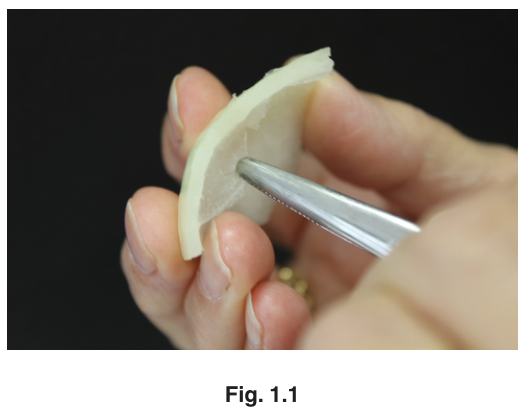
- Remove a piece of the onion tissue from S1 and, using forceps or fingers, peel off the inner epidermis as shown in Fig. 1.1.
- Cut one piece of the epidermis that will fit under a coverslip. Replace the remaining epidermis into S1.
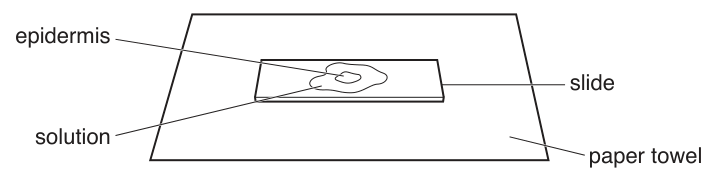
- Place the epidermis on the slide as shown in Fig. 1.2. If the epidermis is folded, you may need to add more drops from S1 so that it floats and uncurls.
- To prevent the epidermis from drying out add more drops from S1 if needed.
- Cover the epidermis with a coverslip so that one edge of the epidermis is close to the edge of the coverslip. Use a paper towel to remove any excess liquid that is outside the coverslip.
- View the slide using the microscope.
You may need to reduce the amount of light entering the microscope to observe the cells clearly.
You are required to use a sharp pencil for drawings.
Select two cells from the epidermis which show the effect of sodium chloride solution from S1.
Make a large drawing of these two cells.
On your drawing use a ruled label line and label to identify the cell wall of one cell.
Answer
Draw two adjacent onion epidermal cells from S1 with the protoplast pulled away from the cell wall (plasmolysis). The pair of cells together must measure at least across. Use a sharp HB pencil with continuous, single clear lines (no sketchy lines) and no shading. The cell wall is drawn as a double line. Use a ruled label line (drawn with a ruler, ending in a small horizontal bar on the structure) to identify the cell wall of one of the cells, and write the words "cell wall" at the end of the line.
Large pencil drawing of two plasmolyzed onion epidermal cells (≥ 70 mm), continuous unshaded lines, cell wall as a double line, with a ruled label line and the label 'cell wall'.
Background Concept
Onion epidermal cells have a rigid cellulose cell wall outside the plasma membrane. The central vacuole contains cell sap with dissolved solutes, giving the cell a (negative) water potential. When the cells are placed in a sodium chloride solution whose water potential is more negative than the cell sap, water leaves the vacuole by osmosis, the protoplast shrinks, and the plasma membrane pulls away from the cell wall — this is plasmolysis.
The inner epidermis of an onion bulb scale leaf is the standard specimen for this experiment because it is a single layer of large, regular, rectangular cells, with no chloroplasts (it grows underground), so the only structures visible are the cell wall, the protoplast (membrane + cytoplasm) and a small nucleus.
In a biological drawing of plant cells:
- the cell wall is shown as a double line (the wall has visible thickness and is shared between adjacent cells);
- the protoplast / membrane is drawn as a single line inside the cell wall;
- drawing is in pencil, with continuous firm lines, no shading, and labels on ruled label lines ending in a small bar (not an arrow).
Understanding the Question
The candidate has just made a wet mount of onion epidermis from S1 (a concentrated NaCl solution) and is looking at the slide under the microscope. The cells are therefore likely to be plasmolysed. Part (a)(i) asks for a large drawing of two such cells, with a label line identifying the cell wall of one of them.
The mark scheme awards three marks for:
- At least 2 cells, total size ≥ 70 mm, with sharp continuous lines.
- The two cells drawn with no shading (and the cell wall as a double line).
- A ruled label line + the words "cell wall" identifying that structure.
Approach
- With the slide from S1 on the microscope stage, choose a region where several clearly plasmolyzed cells are visible side by side.
- Plan the size of the drawing first — the two cells together must span at least 70 mm on the page.
- Use a sharp HB pencil. Draw the outline of the two cells as continuous double lines (where two cells meet, draw a single shared double line).
- Inside each cell, draw the plasmolyzed protoplast as a single curved line that has pulled away from the cell wall (especially at the corners).
- Use a ruler to draw a label line from the cell wall to the page margin, ending in a small horizontal bar on the cell wall, and write "cell wall".
Step-by-Step Reasoning
- Size ≥ 70 mm: the examiner needs to see fine detail; a small drawing cannot be rewarded for cell structure, so the two cells must be drawn large.
- Sharp, continuous lines: a biological drawing represents what is actually seen, not a sketch. Single, firm, unbroken pencil lines are required. Wavy or sketchy outlines lose this mark.
- No shading: only line drawings are credited. Filling the vacuole with pencil (shading) is rejected because the microscope shows clear cytoplasm, not solid fill.
- Cell wall as a double line: even at low magnification a single line is too thin to convey the cellulose wall; the double line is the convention.
- Ruled label line + label: the label line is drawn with a ruler, must not have an arrowhead (a small horizontal bar at the structure end is the convention), and the structure name is written in lower case at the other end. The label and the line together identify the structure.
Key Takeaways
- Concentrated NaCl around onion epidermal cells causes plasmolysis — the protoplast shrinks away from the cell wall.
- A biological drawing of plant cells always shows the cell wall as a double line and the protoplast as a single line inside it.
- Required conventions: ≥ 70 mm overall size, sharp continuous pencil lines, no shading, ruled label line, named structure.
Common Mistakes
- Drawing shaded or stippled cells — rejected.
- Using a single line for the cell wall, or drawing only one cell — loses a mark.
- Drawing an arrowhead instead of a label line with a small bar at the structure end.
- Wavy or broken outlines, or using a felt-tip pen.
- Adding structures that cannot be seen (e.g. chloroplasts in onion bulb epidermis — onion bulb scales grow underground and have no chloroplasts).
Things to Be Careful About
- Onion bulb scale-leaf epidermis is non-photosynthetic, so do not draw chloroplasts.
- The label must be the actual name of the structure (e.g. "cell wall"), not a letter or a vague description.
- The label line should touch (or end with a small bar touching) the structure it labels.
- The drawing should be large enough to read clearly; examiners reject drawings that are too small even if technically correct.
You will now add solution I to the solution from S1 without removing the coverslip.
- Remove the slide from the microscope and place on a paper towel.
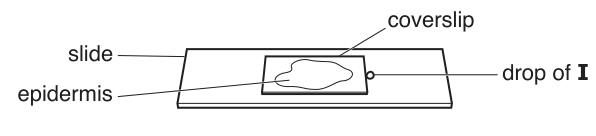
- Put a few drops of solution I onto the slide in contact with one edge of the coverslip nearest to the edge of the epidermis as shown in Fig. 1.3.
Wait a few seconds while solution I moves under the coverslip.
Use a paper towel to remove any excess liquid from the top of the coverslip.
- View the slide using the microscope.
Select one cell which has been affected by solution I.
Make a large drawing of the cell that you have selected.
Annotate your drawing to describe one feature that is different between this cell and the cells drawn in (a)(i).
Answer
Draw one cell only, with the cell wall as a double line. Inside, draw the plasma membrane (single line) and the nucleus (a small rounded body) clearly. Use a ruled label line to label one of: cell wall, membrane, nucleus or cytoplasm. Then add an annotation describing the feature that is different from the cells in (a)(i) — that the cell contents are now stained (yellow / brown) by iodine solution I.
Single pencil drawing of one cell, cell wall as a double line, with membrane and nucleus visible, plus a label line and an annotation stating that the cell contents are stained (yellow/brown) by iodine.
Background Concept
Iodine in potassium iodide (IKI) is a common biological stain. It binds to starch and stains it blue-black, and it generally colours cytoplasm and the nucleus yellow-brown, making organelles easier to see. Irrigation is the technique of running a new solution under a coverslip by placing a drop at one edge of the coverslip and drawing the old liquid out at the other edge with filter paper — this lets you change the bathing solution without removing the coverslip and losing the field of view.
In a biological drawing:
- only draw what you can see;
- the cell wall is a double line;
- the membrane and cytoplasm are shown as single lines;
- the nucleus is drawn as a small rounded body inside the cytoplasm.
Understanding the Question
The candidate has now added iodine (solution I) to the same slide by irrigation (Fig. 1.3). The cells should now be stained, which makes the protoplast, membrane and nucleus easier to see. The task is to draw one cell and annotate it with one feature that is different from the cells in (a)(i).
The mark scheme awards three marks for:
- one cell drawn + cell wall as a double line;
- membrane and nucleus drawn;
- a label line to a feature, with the annotation that the cell is stained.
Approach
- Place a drop of solution I on the slide at one edge of the coverslip and draw the liquid through with tissue at the opposite edge (irrigation, as in Fig. 1.3).
- Re-examine the slide; the cytoplasm should now look yellow-brown and the nucleus should be more obvious.
- Draw a single cell that shows these features clearly, with the cell wall as a double line, the protoplast/membrane as a single line, and a visible nucleus inside.
- Add a ruled label line to one feature, and write an annotation that explicitly mentions staining (e.g. "cytoplasm stained yellow-brown by iodine").
Step-by-Step Reasoning
- One cell only: two cells would lose the first mark — the question explicitly says "one cell".
- Cell wall as a double line: the same convention as in (a)(i) — the cell wall is always drawn as a double line.
- Membrane and nucleus drawn: after staining, the membrane (single line, inside the cell wall) and the nucleus (a small rounded body inside the cytoplasm) should both be visible; if you cannot see them clearly, the irrigation has not worked.
- Annotation = staining: the only thing that has actually changed between the cells in (a)(i) and the cell in (a)(ii) is that iodine has been added, so the cell is now stained. The annotation should name this change, e.g. "cytoplasm / nucleus / cell contents stained (yellow-brown) by iodine".
Key Takeaways
- Irrigation lets you change the solution on a slide without disturbing the field of view.
- Iodine stains cytoplasm yellow-brown and starch blue-black, making the nucleus more visible.
- Annotations on a biological drawing should describe observable features of the specimen as it is, not what was in a previous drawing.
Common Mistakes
- Drawing two cells (loses the first mark).
- Forgetting to indicate the staining — the question asks for the difference from (a)(i) and the difference is the stain.
- Drawing the cell wall as a single line.
- Using shading to represent the stain rather than a label line + written annotation.
Things to Be Careful About
- The annotation should be written on the page near the drawing (with a label line, if it refers to a structure) so the examiner can see the difference you are describing.
- "Stained" is the key word; vague phrases like "different colour" or "now coloured" are weaker than naming the stain (iodine) and the colour (yellow-brown).
- The membrane should still be drawn as a single line, inside the cell wall and the plasmolyzed protoplast; do not redraw the cell as if it had recovered just because iodine was added.
You are now required to:
- investigate the effect of replacing the solution from S1 with water
- calculate the percentage of the cells that are plasmolysed in the onion tissue.
- Label one clean and dry microscope slide as W and put the slide on a paper towel.
- Repeat steps 3 and 4 (page 3).
- Put the piece of the cut epidermis into the container labelled W (which contains distilled water) and leave for two minutes.
- After two minutes, put a few drops of distilled water from W onto slide W and then put the epidermis on the slide as shown in Fig. 1.2 on page 3.
- Cover the epidermis with a coverslip and use a paper towel to remove any excess liquid that is outside the coverslip.
- View the slide using the microscope.
Look at an area of cells using the and objective lenses.
Select the objective lens which allows you to count a suitable number of cells in a field of view so that you can calculate the percentage of cells showing plasmolysis.
State the magnification of the objective lens you will use.
magnification = ______
Answer
magnification × = (or )
×10
Background Concept
A compound light microscope typically has three objective lenses on a revolving nosepiece: a scanning objective (), a low-power objective () and a high-power objective (). The total magnification is the objective magnification multiplied by the eyepiece magnification (usually ).
For counting, lower magnification = larger field of view = more cells visible at once, but each cell looks smaller. Higher magnification shows more detail of each cell but a much smaller field of view.
Understanding the Question
The candidate is about to count cells showing plasmolysis. They have already viewed the slide on and and must choose which is suitable for counting. The mark scheme accepts either or .
Approach
- gives a wide field of view — useful for counting many cells quickly, but each cell is small and the protoplast details are harder to see.
- gives a smaller field of view with each cell larger and easier to assess for plasmolysis, but you can only count a few cells.
For the experiment, is the most common choice because you can count ≥ 10 cells in one field of view and therefore calculate a percentage with reasonable accuracy.
Step-by-Step Reasoning
- The question explicitly says "Select the objective lens which allows you to count a suitable number of cells in a field of view so that you can calculate the percentage of cells showing plasmolysis."
- For a percentage to be meaningful, you need a sample size large enough (e.g. ≥ 10 cells), so is normally selected.
- is acceptable if you deliberately count a smaller total (e.g. 5–10 cells), but is the easier, more robust choice.
Key Takeaways
- Lower magnification gives a larger field of view and is better for counting many cells.
- Higher magnification gives more detail of each cell but a smaller field of view.
- For percentage calculations, a sample size of ≥ 10 is preferable.
Common Mistakes
- Stating (the scanning objective) — not in the mark scheme's accepted answers.
- Stating "high power" or "low power" without a number — loses the mark.
Things to Be Careful About
- The question asks for the objective lens magnification, not the total magnification. The objective is the lens at the bottom of the body tube; the eyepiece is at the top.
- Make sure the number is written clearly so the examiner can read it (e.g. "× 10" or "").
You will need to decide the total number of cells to count as your sample.
State the total number of cells you decided to count.
total number of cells = ______
Answer
total number of cells = 10 (for , must be 10 or more; for , 10 or fewer)
10
Background Concept
A sample size is the number of individual observations used to estimate a property of the whole population. The larger the sample, the closer the sample mean (or percentage) tends to be to the true population value, and the smaller the effect of random variation. However, larger samples take longer to count and may not be practical in one microscope field of view.
Understanding the Question
The candidate has selected an objective lens in (b)(i) and now needs to decide how many cells to count in one field of view so that the percentage of plasmolysed cells is a sensible estimate. The mark scheme ties the sample size to the chosen magnification:
- for , 10 or more cells;
- for , 10 or fewer cells.
Approach
- If using (a wide field of view), count at least 10 cells — the percentage is then a reasonable sample estimate.
- If using (a small field of view), you can only count ≤ 10 cells in one field; the percentage will be less reliable but is still acceptable.
A common, safe choice is 10 cells at .
Step-by-Step Reasoning
- The mark scheme accepts 10 or more for and 10 or fewer for .
- 10 is the minimum sample size that gives a meaningful percentage (e.g. you can have 0/10, 1/10, … 10/10 plasmolysed — fine resolution).
- Larger samples (e.g. 20) are also acceptable but take more time.
Key Takeaways
- The sample size must be appropriate for the magnification chosen.
- A larger sample reduces random error in the percentage.
- Counting whole fields of view (not just selected cells) avoids bias.
Common Mistakes
- Stating a number that is too small for the chosen magnification (e.g. 5 cells at is too few to give a reliable percentage).
- Stating a number that is too large for the chosen magnification (e.g. 30 cells at — you cannot see that many in one field of view).
Things to Be Careful About
- The sample is the number of cells in one field of view, not the number of fields of view.
- The sample should be representative — count every cell visible in the field, not just the plasmolyzed ones.
The onion cells may show degrees of plasmolysis, from no plasmolysis to complete plasmolysis as shown in Fig. 1.4.
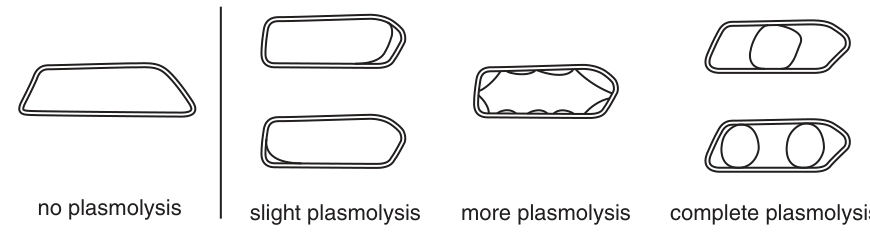
- Select one field of view which includes cells showing any degree of plasmolysis and cells showing no plasmolysis.
- Observe and record on page 7 each of the cells in your sample, recording:
- '' for each cell that shows any degree of plasmolysis (see Fig. 1.4)
- '' for each cell that shows no plasmolysis.
Consider how you will obtain results which are as accurate as possible.
Using your results calculate the percentage of cells that are plasmolysed.
You may lose marks if you do not show your working.
Working
For example, if 6 out of 10 cells are plasmolysed:
Answer
60% (representative value — substitute the candidate's own counts)
60% (representative; the candidate's actual answer will depend on their own counts)
Background Concept
A percentage expresses a count as a fraction of 100. The general formula is:
Applied to plasmolysis, the "part" is the number of cells showing any degree of plasmolysis and the "whole" is the total number of cells counted in the field of view.
Understanding the Question
The candidate has just decided on a sample size in (b)(ii) and has observed each cell, ticking those that are plasmolysed and crossing those that are not. They must now calculate the percentage of cells that are plasmolysed. The mark scheme gives 1 mark for showing the working: number of plasmolysed cells divided by total counted, multiplied by 100.
Approach
- Write the formula.
- Substitute the candidate's own counts (number plasmolysed / total counted).
- Multiply by 100 to give a percentage.
Step-by-Step Reasoning
- The mark scheme explicitly requires the formula to be shown — the examiner awards the mark for the structure of the working, not just the final number.
- Example: 6 plasmolysed out of 10 counted → (6 / 10) × 100 = 60%.
- The candidate should use their own numbers, not the example above.
Key Takeaways
- Percentage = (part / whole) × 100.
- In a percentage plasmolysis calculation, "part" = cells showing plasmolysis, "whole" = total cells counted.
- Show your working — the mark is for the structure of the calculation, not just the answer.
Common Mistakes
- Dividing total by part (the wrong way round).
- Forgetting to multiply by 100, so the answer is left as a decimal (e.g. 0.6 instead of 60%).
- Not showing the working — even if the final number is correct, the mark is lost.
Things to Be Careful About
- The candidate must use their own counts, not the example values above.
- The answer should be expressed as a percentage, with the % sign.
Prepare the space below and record the number of cells showing any degree of plasmolysis and the number of cells showing no plasmolysis (raw results) and record processed results for the percentage of cells that are plasmolysed in the onion tissue.
Answer
| Cell | Plasmolysed? R₁ (✓/×) | Plasmolysed? R₂ (✓/×) |
|---|---|---|
| 1 | ✓ | ✓ |
| 2 | × | × |
| 3 | ✓ | × |
| 4 | × | ✓ |
| 5 | ✓ | ✓ |
| 6 | ✓ | ✓ |
| 7 | × | × |
| 8 | ✓ | × |
| 9 | × | ✓ |
| 10 | × | × |
| Total plasmolysed | 6 | 6 |
| Total cells | 10 | 10 |
| % plasmolysed | 60 | 60 |
| Mean % plasmolysed | 60 |
(representative example — the candidate uses their own counts)
A table with a 'Cell' heading, a 'Plasmolysed?' heading using ✓/× symbols, raw data for each cell, at least two replicates, and processed results (totals, percentages, and a mean).
Background Concept
A results table should:
- have a clear heading that names the dependent variable;
- have column headings that include both the quantity and the unit (or the categorical symbol, e.g. ✓/×) where relevant;
- record the raw data exactly as observed;
- include a row or column for processed data (means, percentages, rates) below the raw data;
- include replicates (repeated measurements) so that any anomalous results can be detected and a mean calculated.
For categorical scoring (✓/×) the heading includes the symbols, e.g. "Plasmolysed? (✓/×)". For numerical processed data, a unit or % sign should be in the heading.
Understanding the Question
The candidate has already chosen an objective lens (b)(i) and a sample size (b)(ii), and calculated a percentage (b)(iii). They now have to present their results in a table that records both:
- the raw data (which cells are plasmolysed, which are not) for each replicate, and
- the processed data (the mean percentage of cells plasmolysed).
The mark scheme awards 5 marks for:
- table drawn + heading for cells;
- heading for plasmolysis;
- records ✓ or × (for each cell);
- replicates;
- processed results recorded in table.
Approach
- Draw a table with a column headed Cell (the cells being scored) and a column (or two, for replicates) headed Plasmolysed? (✓/×).
- In each row, write a cell number (1, 2, 3, …) and a tick or cross for each replicate.
- Below the raw data, add rows for Total plasmolysed, Total cells, % plasmolysed and a final Mean % plasmolysed.
Step-by-Step Reasoning
- Heading for cells: "Cell" or "Cell number" identifies the rows.
- Heading for plasmolysis: "Plasmolysed? (✓/×)" identifies the column where the data are scored.
- Records ✓ or ×: the entries in the column are the symbols, not numbers.
- Replicates: at least two columns (R₁, R₂) so the count can be repeated and a mean calculated.
- Processed results: totals, percentages, and a mean % are written in the table (not just on a calculator).
The representative example above shows 10 cells × 2 replicates, with 6/10 plasmolysed in each replicate, giving a mean of 60%. The candidate must use their own counts.
Key Takeaways
- A good results table has clear headings, raw data, replicates, and processed (mean/percentage) data.
- For categorical scoring, the column heading should include the symbols used (e.g. ✓/×).
- The mean is calculated across the replicates, not across individual cells.
Common Mistakes
- Omitting the column heading for plasmolysis (just writing the symbols without a heading).
- Recording numbers instead of ✓/×.
- Forgetting to include replicates (only one count column).
- Omitting the processed data (totals, percentage, mean).
Things to Be Careful About
- The candidate's table must be based on their own counts, not the example above.
- The processed results should sit below the raw data in the same table, not on a separate sheet.
- Units (% sign) must be in the heading or next to the value, not implicit.
Identify one significant source of error in measuring the dependent variable.
Answer
A significant source of error is the difficulty of judging the degree of plasmolysis for each cell (e.g. deciding whether a cell showing only slight plasmolysis should be scored as plasmolysed or not).
Difficulty of judging the degree of plasmolysis for each cell.
Background Concept
The dependent variable in this experiment is whether or not each cell shows plasmolysis. It is a categorical (yes/no) variable, but the underlying biological phenomenon is a continuous one — the protoplast can be just starting to pull away, partly pulled away, or fully pulled away (see Fig. 1.4). The borderline between "plasmolysed" and "not plasmolysed" is therefore subjective.
A source of error is any factor that introduces uncertainty into the measurement. Significant sources of error are those large enough to materially change the result.
Understanding the Question
Part (b)(v) asks the candidate to identify one significant source of error in measuring the dependent variable. The mark scheme accepts "difficulty of judging the degree of plasmolysis for each cell".
Approach
Think about what the candidate actually does when scoring: they look at each cell, see whether the protoplast has pulled away from the wall, and tick or cross it. The borderline cases (slight plasmolysis vs no plasmolysis) are the source of error.
Step-by-Step Reasoning
- The candidate must look at Fig. 1.4 and recognise that plasmolysis is not all-or-nothing — there is a continuous range from none to complete.
- A cell with only slight plasmolysis could legitimately be scored as plasmolysed (it has some plasmolysis) or as not plasmolysed (it has not been pulled away much). Different candidates will score these cells differently, so the percentage will be inconsistent between observers.
- This is a significant source of error because it affects every borderline cell in the sample, and the effect is large compared to the random variation between clearly plasmolysed and clearly not-plasmolysed cells.
Key Takeaways
- Plasmolysis is a continuous variable; scoring it as yes/no introduces subjectivity.
- Significant sources of error are those that materially change the measured value.
- Borderline cases (slight plasmolysis) are the main problem in this experiment.
Common Mistakes
- Vague answers like "human error" or "not accurate" — the mark scheme requires a specific source.
- Naming a source that is not actually about the dependent variable (e.g. "the slide is dirty" — this affects visibility, but not specifically the scoring of plasmolysis).
- Naming the wrong source of error (e.g. "the solution might be at the wrong concentration" — this is a variable issue, not an error in measuring plasmolysis).
Things to Be Careful About
- The error must be about measuring the dependent variable, not about the procedure in general.
- The error should be one that is hard to avoid in this experiment — borderline cells are genuinely difficult to score.
Explain, in terms of the movement of water and water potential, the effect of water replacing the sodium chloride solution on the cells of the epidermis.
Answer
- Water moves into the cells.
- This is by osmosis (a net movement of water molecules across a partially permeable membrane, down a water potential gradient).
- This is because the water potential outside the cell (in distilled water) is higher than the water potential inside the cell (the cell sap in the vacuole still contains dissolved solutes from the previous NaCl exposure and from its normal contents), so water moves from the higher water potential outside to the lower water potential inside.
Water moves into the cells by osmosis because the water potential outside the cell (in distilled water) is higher than the water potential inside the cell.
Background Concept
Osmosis is the net movement of water molecules across a partially permeable membrane, from a region of higher water potential to a region of lower water potential. Water potential () is measured in kPa; pure water has the highest water potential (), and any solution has a more negative water potential than pure water. The more dissolved solutes a solution contains, the more negative its water potential.
A plant cell behaves as an osmometer: the plasma membrane is the partially permeable membrane, and the cell sap inside the vacuole contains dissolved solutes (sugars, salts, organic acids), so it has a more negative water potential than pure water.
Understanding the Question
The candidate has just replaced the sodium chloride solution (S1) with distilled water (W) and observed the cells. The plasmolysed protoplasts recover (deplasmolysis). Part (b)(vi) asks for an explanation, in terms of water movement and water potential, of the effect on the cells.
The mark scheme awards 3 marks for:
- water moves into the cells;
- by osmosis;
- the water potential outside the cell is higher than inside.
Approach
- State the direction of water movement.
- Name the process (osmosis).
- Compare the water potential of the distilled water outside the cell with the water potential of the cell sap inside, and explain that this is why water moves in this direction.
Step-by-Step Reasoning
- The cells were previously in concentrated NaCl solution, which has a very negative water potential. Water left the cells, and the protoplast shrank (plasmolysis).
- When the solution is replaced with distilled water, the external water potential is now much higher (close to ) than the water potential of the cell sap inside the vacuole (still negative because of the dissolved solutes in the cell sap).
- Water therefore moves from the higher water potential outside the cell, through the partially permeable plasma membrane, to the lower water potential inside the cell.
- As water enters, the protoplast swells back against the cell wall — this is deplasmolysis.
- The cell becomes turgid, with the protoplast pressing against the cell wall.
Key Takeaways
- Osmosis is the net movement of water down a water potential gradient across a partially permeable membrane.
- Distilled water has a higher (less negative) water potential than any solution, including cell sap.
- Replacing a hypertonic solution with water causes plasmolysed plant cells to recover (deplasmolysis).
Common Mistakes
- Saying "water moves from a low concentration to a high concentration" — this is the solute concentration gradient, not the water potential gradient. Use the correct term.
- Saying "water moves down the concentration gradient" — water moves down the water potential gradient, not the solute concentration gradient.
- Forgetting to state the direction of movement (into the cell).
- Saying "the cell absorbs water" — be specific: water enters the cell by osmosis, because the external water potential is higher than the internal water potential.
Things to Be Careful About
- The explanation must be in terms of water potential, not just "concentration".
- The direction of movement must be stated (into the cell).
- The word "osmosis" must be used; "diffusion" is not specific enough.
Suggest how you would modify this investigation to find the sodium chloride concentration of an unknown solution.
Answer
- Prepare a series of at least 5 known sodium chloride concentrations (e.g. , , , … , ) by serial (or simple) dilution of a stock solution.
- Place onion epidermis in each known concentration and in the unknown solution; leave for the same time; observe under the microscope.
- Compare the degree of plasmolysis in the unknown with the degree of plasmolysis in each of the known concentrations; the known concentration that produces the same degree of plasmolysis as the unknown is an estimate of the unknown's concentration.
Prepare at least 5 known NaCl concentrations by serial or simple dilution, then compare the degree of plasmolysis in the unknown with that in the knowns to estimate the unknown's concentration.
Background Concept
The plasmolysis experiment is normally used to demonstrate that a solution is hypertonic to the cell. With a range of known concentrations, it can also be used quantitatively: the more concentrated the external solution (and therefore the more negative its water potential), the more plasmolysis is observed, up to a maximum at very high concentrations.
A serial dilution is prepared by taking a fixed volume of the stock solution, adding it to a fixed volume of solvent, mixing, then taking the same volume of that diluted solution and adding it to the same volume of solvent again, and so on. This produces concentrations that decrease by a constant factor (e.g. by half each time). A simple (proportional) dilution is prepared by calculating how much stock and solvent to mix for each target concentration directly (e.g. ).
Understanding the Question
The candidate must suggest how to modify the existing investigation so that it can be used to find the concentration of an unknown NaCl solution. The mark scheme awards 3 marks for:
- at least 5 known NaCl concentrations;
- concentrations prepared by simple or serial dilution;
- comparison of the unknown with the knowns (e.g. the same degree of plasmolysis).
Approach
- Decide on a sensible range of NaCl concentrations (e.g. 0 to in 5+ steps).
- Describe how to prepare them (serial or simple dilution of a stock solution).
- Describe the comparison: place onion epidermis in each known concentration and in the unknown, and look for the known that produces the same degree of plasmolysis as the unknown.
Step-by-Step Reasoning
- At least 5 concentrations: the mark scheme requires 5; a finer range (e.g. 6, 8, 10) gives a more accurate estimate of the unknown.
- Serial or simple dilution: a serial dilution is the most efficient way to prepare many concentrations from a single stock; a simple dilution can be used if the concentrations are not too closely spaced.
- Comparison: the principle is that cells in a solution of a given water potential will show a characteristic degree of plasmolysis. The unknown is matched to the known that gives the same picture under the microscope, giving an estimate of its concentration.
- Controls to standardise: same onion tissue (or same batch), same time in the solution, same microscope, same observer.
- The estimate can be improved by repeating the comparison or by interpolating between two known concentrations that bracket the unknown.
Key Takeaways
- A plasmolysis experiment can be made quantitative by using a range of known concentrations.
- Serial dilution is a quick way to prepare many concentrations from a single stock.
- An unknown's concentration can be estimated by matching its effect (degree of plasmolysis) to that of the standards.
Common Mistakes
- Using only 1 or 2 known concentrations — too few to give a meaningful comparison.
- Not describing how the concentrations are prepared (the mark scheme requires dilution).
- Forgetting to mention the comparison with the unknown — the whole point of the modification is to estimate the unknown's concentration.
- Using different onion tissue, different times, or different temperatures for the standards and the unknown — the variables must be standardised for the comparison to be valid.
Things to Be Careful About
- The range of concentrations should bracket the unknown (some should give clear plasmolysis, some should give none). If the unknown is far outside the range, the comparison will be ambiguous.
- The same tissue, same time, same temperature, and same observer should be used for all standards and the unknown.
- "Estimate" is a better word than "measure" — the method is not very precise, and the answer is interpolated from a small number of standards.
The rest of this paper
1 more questions- Q2—19M