Biology 9700/35 — October/November 2015
Cambridge AS Level · Advanced Practical Skills · worked solutions for every part, with the mark scheme
Topics Analysis, Conclusions and Evaluation · Manipulation, Measurement and Observation · Presentation of Data and Observations · Use of the Light Microscope
A number of plant tissues are coloured because the cells contain chemicals called anthocyanins. These anthocyanins change colour according to the pH and the colour changes are reversible.
You are provided with red cabbage which contains anthocyanins and can be used to make a pH indicator solution.
You are required to:
- prepare a pH indicator solution from red cabbage
- investigate the effect of pH (the independent variable) on the colour of the indicator solution
- identify the pH of the solutions, S1 and S2.
You are provided with:
Table 1.1
| labelled | contents | hazard | volume / |
|---|---|---|---|
| pH 3 | solution of pH 3 | irritant | 30 |
| pH 4 | solution of pH 4 | irritant | 30 |
| pH 6 | solution of pH 6 | irritant | 30 |
| S1 | solution of unknown pH | irritant | 30 |
| S2 | solution of unknown pH | irritant | 30 |
| W | distilled water | none | 30 |
| labelled | contents | hazard | quantity |
|---|---|---|---|
| P | red cabbage | — | pieces of leaves |
It is recommended that you wear safety glasses/goggles.
When carrying out a practical procedure, the hazards of the use of all the apparatus and solutions need to be considered. Then the level of risk needs to be assessed as low or medium or high.
State the hazard with the greatest level of risk when using the solutions in Table 1.1.
State the level of risk of using the solutions: low or medium or high.
hazard ______
level of risk ______
Proceed as follows:
- Cut the red cabbage leaves into small pieces and place into the water in beaker A.
- Heat the water in beaker A and boil for 5 minutes.
- Turn off the Bunsen burner and leave the water in beaker A to cool for 5 minutes to produce a coloured liquid.
This is your pH indicator solution.
While you are waiting continue with Question 1.
- After 5 minutes, pour approximately of this pH indicator solution into a container. Most of the cabbage leaves should remain in beaker A.
You are now going to investigate the effect of pH on the colour of the pH indicator solution.
You will need to decide how to standardise the volume of pH indicator solution required to observe the colour change.
So that you can observe the colour change clearly, you need to decide the volume of pH indicator solution to add.
- Put of the pH 6 solution into a test-tube.
- Put of pH indicator solution into the same test-tube and mix the contents.
- Add further volumes, up to , in order to decide which volume to use to observe the colour change clearly.
- Record in (b)(ii) the final colour of the pH indicator solution at pH 6.
State the volume of pH indicator solution you will use to observe the colour change clearly and describe how you will standardise the volume of the pH indicator solutions to carry out step 9.
volume = ______
description ______
- Using the information in step 5 and (b)(i), find the colour of the pH indicator solution with pH 3, pH 4, W, S1 and S2. Record all your observations in (b)(ii).
Prepare the space below and record all your observations.
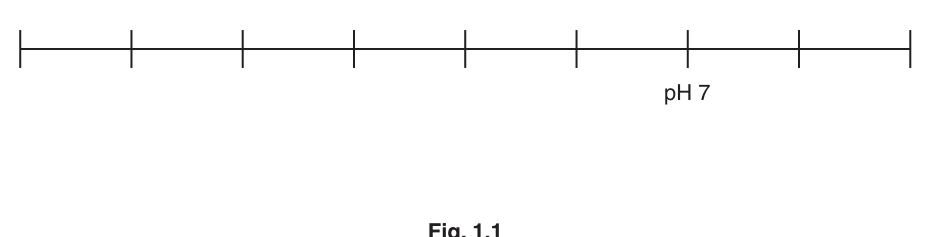
Fig. 1.1 shows the position of pH 7 on a scale.
Using your results in (b)(ii) complete Fig. 1.1 to show:
- the positions of pH 3, pH 4 and pH 6 on the scale
- the positions of W, S1 and S2 on the scale.
Like red cabbage, beetroot cells also contain anthocyanins.
A student investigated the effect of temperature on the cell surface membranes of beetroot.
- Beetroot was cut into cubes.
- One cube of beetroot was put into each of five test-tubes containing water which had been heated to or or or or .
- All other variables were standardised.
- The cubes were removed after 15 minutes.
- The absorbance of light by the coloured liquid left in the test-tubes was measured using a colorimeter.
The absorbance of light by pure water is arbitrary units.
The results of the student's investigation are shown in Table 1.2.
Table 1.2
| temperature / | absorbance of light by the coloured liquid / arbitrary units |
|---|---|
| 25 | 0.080 |
| 30 | 0.155 |
| 35 | 0.225 |
| 45 | 0.395 |
| 50 | 0.580 |
You are required to use a sharp pencil for graphs.
Plot a graph of the data shown in Table 1.2.

Use your graph to estimate the absorbance of light at .
Show on your graph how you estimated the absorbance of light.
absorbance = ______
Explain the effect of temperature on the permeability of cell surface membranes in beetroot.
The student decided to investigate the effect of alcohol on the cell surface membranes of beetroot cubes at .
Describe how the temperature will be standardised in this investigation.
Describe how the independent variable will be investigated.
The rest of this paper
1 more questions- Q2Use of the Light Microscope · Analysis, Conclusions and Evaluation19M