Biology 9700/31 — October/November 2015
Cambridge AS Level · Advanced Practical Skills · worked solutions for every part, with the mark scheme
Topics Presentation of Data and Observations · Analysis, Conclusions and Evaluation · Manipulation, Measurement and Observation · Use of the Light Microscope
When plant tissue is soaked in methylene blue solution, the stain enters the tissue and colours it blue. This stained tissue can be used to investigate the effect of different solutions on the cells.
You are required to investigate the effect of different concentrations of sodium chloride solution (independent variable) on pieces of plant tissue which have been soaked in methylene blue solution.
You are provided with:
| labelled | contents | hazard | volume / |
|---|---|---|---|
| S | 10% sodium chloride solution | none | 50 |
| W | distilled water | none | 200 |
| labelled | contents | hazard | details | quantity |
|---|---|---|---|---|
| P | plant tissue stained with methylene blue | methylene blue will stain your skin | each piece has same cross-sectional area and is stained with methylene blue, then washed | 5 pieces |
If any methylene blue comes into contact with your skin wash it off immediately with water.
It is recommended that you wear safety goggles/glasses.
You are required to make a serial dilution of the 10% sodium chloride solution, S, which reduces the concentration of the sodium chloride solution by a factor of ten between each successive dilution.
You will need to prepare of each concentration.
Complete Fig. 1.1 to show how you will dilute the solution.
You should use the two beakers shown in Fig. 1.1 and draw as many extra beakers as you need to prepare sufficient concentrations for the investigation.
For each beaker:
- state, under the beaker, the volume and concentration of the sodium chloride solution available for use in the investigation
- use one arrow, with a label above the beaker, to show the volume and concentration of sodium chloride solution added to prepare the concentration
- use another arrow, with a label above the beaker, to show the volume of W added to prepare the concentration.
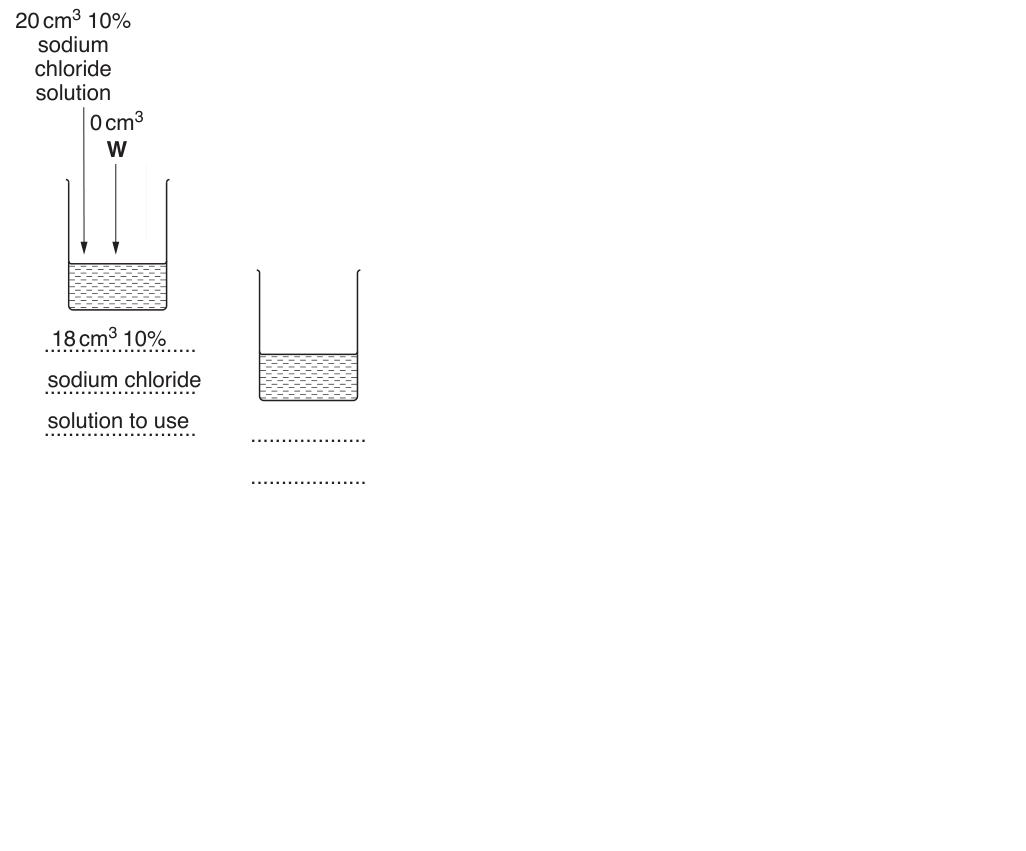
Proceed as follows:
Always use blunt forceps when handling the plant tissue to avoid contact with the methylene blue solution.
- Prepare the concentrations of sodium chloride solution as stated in (a)(i) in the containers provided.
- Remove the pieces of plant tissue from the container, labelled P, and place them onto a white tile.
- Cut the ends off each piece of plant tissue.
- Cut the plant tissue into equal lengths. These should be between and in length.
- Any pieces of plant tissue which you do not need should be put into the beaker labelled ‘For waste’.
- Empty the coloured water from the container labelled P.
- Put all the pieces of plant tissue into the empty container labelled P and cover with tap water.
- Change the tap water 5 times, either using a syringe or by pouring off the water. Do not touch the plant tissue.
- Label test-tubes with the concentrations of sodium chloride solution you prepared in step 1.
- Label a test-tube W.
The volume of solution surrounding the plant tissue in the test-tube is a variable that must be standardised.
One piece of plant tissue will be put into each test-tube with sodium chloride solution.
State the volume of solution that you will use in each test-tube. Explain why you have selected this volume.
volume = ______
reason for selecting this volume = ______
- Put the volume of W stated in (a)(ii) into the test-tube labelled W.
- For each of the concentrations of sodium chloride solution you prepared in step 1, put the volume stated in (a)(ii) into the test-tubes labelled in step 9.
- Put one piece of plant tissue into each test-tube and leave for 10 minutes.
While you are waiting continue with Question 1.
After 10 minutes you will need to remove the plant tissue from each test-tube so that the colour of each solution can be recorded.
- After 10 minutes, pour the solution and the piece of plant tissue from one of the test-tubes into the beaker labelled R.
- Put the piece of plant tissue into the container labelled ‘For waste’. Put the solution back into the test-tube.
- Rinse beaker R with tap water.
- Repeat step 14 to step 16 with each of the remaining test-tubes.
- Put the test-tubes into the test-tube rack in the order of the intensity (quantity) of blue colour.
- Observe the colour in the test-tubes and use the scale below to match each test-tube to an intensity of colour.
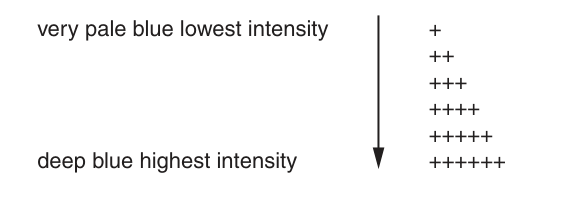
- Record your observations in (a)(iii).
Prepare the space below and record your observations.
When carrying out a practical procedure, the hazards of the use of all the apparatus and solutions need to be considered. Then the level of risk needs to be assessed as low or medium or high.
State the hazard with the greatest level of risk when carrying out steps 2 to 8 on page 4. State the level of risk of the procedure: low or medium or high.
hazard = ______
level of risk = ______
The test-tube containing water and stained potato is a control experiment for this investigation.
Explain why it is necessary to collect this result.
With reference to the experiment you have just carried out, explain why the use of a syringe that can measure to an accuracy of would not increase the accuracy of your results.
A scientist investigated the effect of concentration of sodium chloride solution on the increase in length of the roots of a fruit tree.
Nutrient solutions were prepared containing two different concentrations of sodium chloride solution, and .
10 young fruit trees were placed so that their roots were in sodium chloride solution and another 10 young fruit trees were placed so that their roots were in sodium chloride solution.
The root length of each of the trees was measured and the mean length of roots recorded at intervals over a period of 10 days.
The results are shown in Table 1.1.
Table 1.1
| time in sodium chloride solution / days | mean length of roots / mm | |
|---|---|---|
| 1 mM sodium chloride solution | 25 mM sodium chloride solution | |
| 1 | 37.25 | 37.00 |
| 3 | 41.25 | 38.00 |
| 5 | 45.25 | 39.50 |
| 8 | 52.00 | 40.00 |
| 10 | 55.00 | 40.25 |
You are required to use a sharp pencil for graphs.
Plot a graph of the data shown in Table 1.1.

Using the data in Table 1.1, the rate at which root length increased between day 3 and day 5 for trees in is calculated as .
Use the data in Table 1.1 to calculate the rate at which root length increased between day 3 and day 5 for plants in sodium chloride solution.
You may lose marks if you do not show your working.
answer = ______
The increase in length of the roots occurs due to an increase in cell numbers following mitosis. These cells then become longer as they take up water by osmosis.
Explain the difference in the rates between day 3 and day 5 for the two concentrations of sodium chloride solution.
This scientist investigated the effect of concentration of sodium chloride solution on the increase in length of the roots of a fruit tree.
Consider how you would modify this investigation to find the effect of temperature on the increase in length of the roots of a fruit tree in sodium chloride solution.
Describe how the independent variable (temperature) will be investigated.
Describe how one other variable will be standardised.
The rest of this paper
1 more questions- Q2Use of the Light Microscope · Presentation of Data and Observations · Analysis, Conclusions and Evaluation17M