Biology 9700/35 — May/June 2015
Cambridge AS Level · Advanced Practical Skills · worked solutions for every part, with the mark scheme
Topics Presentation of Data and Observations · Analysis, Conclusions and Evaluation · Manipulation, Measurement and Observation · Use of the Light Microscope
The enzyme E catalyses the reaction of urea with water to form ammonium carbonate and carbon dioxide.
Aqueous ammonium carbonate produces ammonium ions. This forms an alkaline solution which causes red litmus paper to change to blue.
This colour change will be used to indicate the end-point of the reaction.
The end-point of the reaction is when all of the surface of the red litmus paper is blue.
You are required to:
- prepare different concentrations of the urea solution, U
- investigate the effect of different concentrations of U (independent variable) on the reaction of U with water, W.
You are provided with:
| labelled | contents | hazard | volume / |
|---|---|---|---|
| U | 5% urea solution | harmful irritant | 50 |
| W | distilled water | none | 100 |
| E | enzyme solution | harmful irritant | 10 |
| labelled | contents | hazard | quantity |
|---|---|---|---|
| R | red litmus paper | none | 2 strips |
When carrying out a practical procedure, the hazards of the use of all the apparatus and all of the reagents need to be considered, then the level of risk needs to be assessed as low or medium or high.
State the hazard with the greatest level of risk when using the apparatus and reagents in step 1 on page 4.
State the level of risk of the procedure: low or medium or high.
hazard ______
level of risk ______
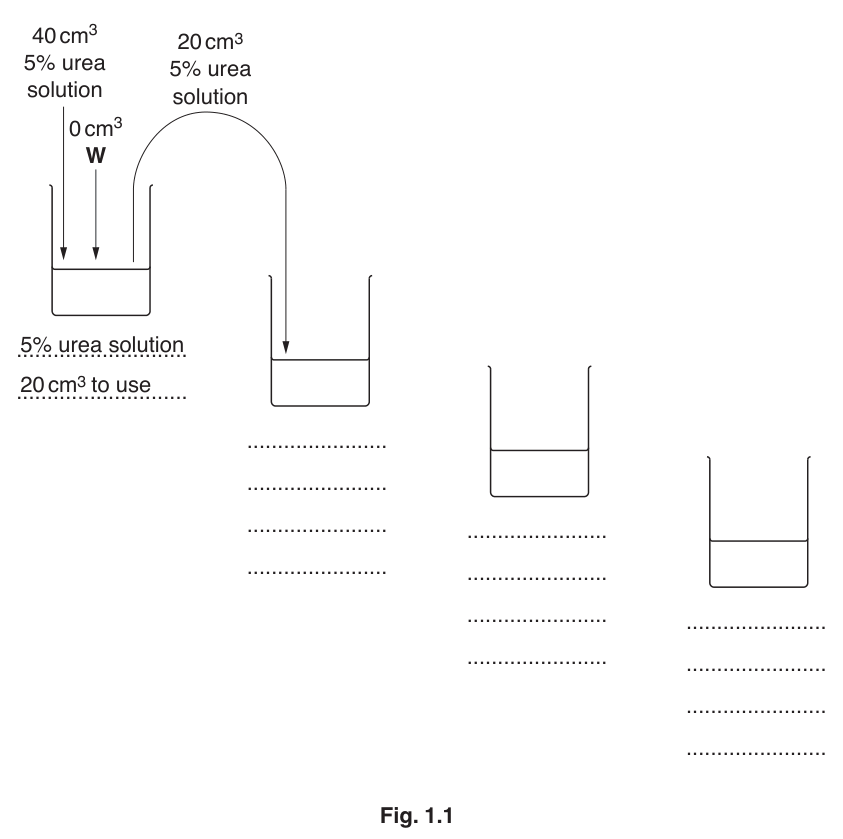
You are required to make a serial dilution of the 5% urea solution, U, which reduces the concentration of the urea solution by half between each successive dilution.
You will need to prepare of each concentration.
You should use the beakers shown in Fig. 1.1 to show how you will prepare the serial dilutions.
For each beaker, complete Fig. 1.1 to show how you will dilute the solution by:
- stating, under the beaker, the concentration and volume of the urea solution available for use in the investigation
- using one arrow, with a label above the beaker, to show the concentration and volume of urea solution added to prepare the concentration
- using another arrow, with a label above the beaker, to show the volume of W added to prepare the concentration.
Proceed as follows:
- Prepare the concentrations of urea solution, as stated in (b)(i).
- Cut the red litmus paper into lengths of approximately . Put one piece of litmus paper into the bottom of each of the four test-tubes.
- Put of E into each test-tube.
- Put of the lowest concentration of urea solution into one of these test-tubes and mix well. Immediately start timing.
- During the investigation, shake the test-tube occasionally to mix the contents.
- Record in (b)(ii) the time taken for all of the surface of the red litmus paper to change to blue (the end-point).
If the piece of litmus paper does not reach the end-point after 180 seconds (3 minutes), stop the experiment and record ‘more than 180’. - Repeat steps 4 to 6 with the next lowest concentration of urea solution.
- Repeat step 7 with the other concentrations of urea solution.
You are now required to replicate the investigation.
- Repeat steps 2 to 8.
Prepare the space below and record your results.
Significant sources of error may cause some of the raw data to be inaccurate, producing anomalous results.
-
The end-point of this investigation was the change in colour of the red litmus paper. State how this might have caused the results to be inaccurate.
-
Identify one other significant source of error for this investigation.
Describe one improvement to this investigation which would increase confidence in your results.
State one piece of apparatus used in this investigation that may have a systematic error.
When a student carried out this investigation, the red litmus paper changed to blue in a very short time. This made measuring the time inaccurate.
Describe how the student could change the procedure to increase the time taken to reach the end-point.
The ‘urea breath test’ is used to detect human stomach infections caused by bacteria. If the bacteria are present in the stomach, an enzyme produced by the bacteria breaks down the urea to carbon dioxide. This carbon dioxide is absorbed from the stomach into the blood and travels to the lungs where it is released in the breath.
To test for the presence of the bacteria, the patient drinks a solution of urea containing , which is an isotope of carbon. The breath of the patient is then sampled at intervals for 110 minutes and analysed for the presence of (carbon dioxide containing ).
The results are shown in Table 1.1.
Table 1.1
| time of sampling / minutes | in the breath / arbitrary units |
|---|---|
| 30 | 21.8 |
| 40 | 19.0 |
| 60 | 14.5 |
| 75 | 12.5 |
| 110 | 10.7 |
Plot a graph of the data in Table 1.1.
Using your knowledge of enzymes, explain the trend shown in the data.
The rest of this paper
1 more questions- Q2Use of the Light Microscope · Analysis, Conclusions and Evaluation · Presentation of Data and Observations19M