Biology 9700/34 — May/June 2015
Cambridge AS Level · Advanced Practical Skills · worked solutions for every part, with the mark scheme
Topics Manipulation, Measurement and Observation · Presentation of Data and Observations · Analysis, Conclusions and Evaluation · Use of the Light Microscope
Plant cells contain an enzyme, catalase, which catalyses the hydrolysis (breakdown) of hydrogen peroxide into oxygen and water. An extract of plant tissue contains catalase.
You are required to investigate the effect of solution X on the activity of the catalase in a plant extract P by:
- preparing different concentrations of solution X
- investigating the effect of different concentrations of solution X by counting the number of bubbles of oxygen released in two minutes
- finding the rate of activity of the catalase by measuring the time taken to collect of the oxygen.
You are provided with:
| labelled | contents | hazard | volume / |
|---|---|---|---|
| X | 0.3% solution of X | harmful | 20 |
| W | distilled water | none | 100 |
| P | plant extract solution | none | 90 |
| H | hydrogen peroxide solution | harmful irritant | 90 |
| T | tap water | none | — |
When carrying out a practical procedure, the hazards of the use of all the apparatus and all of the reagents need to be considered, then the level of risk needs to be assessed as low or medium or high.
State the hazard with the greatest level of risk when using the apparatus and reagents in step 1 on page 4.
State the level of risk of the procedure: low or medium or high.
hazard ______
level of risk ______
Answer
Hazard: (hydrogen peroxide) — labelled as a harmful irritant
Level of risk: medium (or high)
Hazard: H (hydrogen peroxide – harmful irritant); Level of risk: medium (or high)
Background Concept
Before any practical procedure is carried out, the hazards of every chemical and piece of apparatus involved must be identified, and the level of risk that the procedure poses to the user must be assessed. A hazard is the intrinsic property of a substance that makes it dangerous — for example, flammable, toxic, corrosive or irritant. The level of risk combines the severity of the hazard with the likelihood of exposure during the procedure (volume used, concentration, duration of contact, control measures).
The table supplied with this question gives the hazard information for each labelled reagent:
- (0.3% solution of an unknown substance): harmful
- (distilled water): none
- (plant extract): none
- (hydrogen peroxide): harmful irritant
- (tap water): none
Understanding the Question
You are asked to identify which of the reagents used poses the greatest hazard, and then to state the level of risk (low, medium or high) of the overall procedure.
Approach
Compare the hazard labels in the table and pick the reagent with the most serious combination of properties. Then assign a level of risk based on the severity of that hazard and how the substance is used in the procedure (concentration, volume, exposure route).
Step-by-Step Reasoning
- Among the reagents listed, (hydrogen peroxide) is the only substance labelled with two hazard words — harmful and irritant. This combination makes it the most hazardous reagent in the procedure.
- is labelled as harmful, but not as an irritant, so it is less hazardous than .
- , and are listed as having no hazard.
- For the level of risk: although is dangerous, it is handled in small volumes (– of a relatively dilute solution), the procedure is short, and standard laboratory precautions (lab coat, eye protection, washing off splashes immediately) keep the likelihood of significant exposure low. The risk is therefore medium (or high if the assessor judges exposure likely).
- Low risk is not acceptable, because the presence of an irritant rule this out.
Key Takeaways
- A substance labelled with two hazard words (e.g. harmful AND irritant) is generally the most hazardous reagent in a procedure.
- The level of risk depends on both the severity of the hazard and the likelihood of exposure (concentration, volume, duration, control measures).
Common Mistakes
- Naming because it has a higher stated concentration. Concentration in use is not the same as intrinsic hazard.
- Stating "low" risk simply because the procedure is short. The presence of an irritant rules this out.
- Omitting the word "irritant" and just saying "harmful" — both should be quoted for full credit.
Things to Be Careful About
- The mark scheme accepts either "medium" or "high" for the level of risk; "low" is not accepted.
- The question asks for the greatest hazard, so only one substance should be named.
You are required to make a serial dilution of the 0.3% solution of X which reduces the concentration of X by a factor of 10 between each successive dilution.
You will need to prepare of each concentration of solution X.
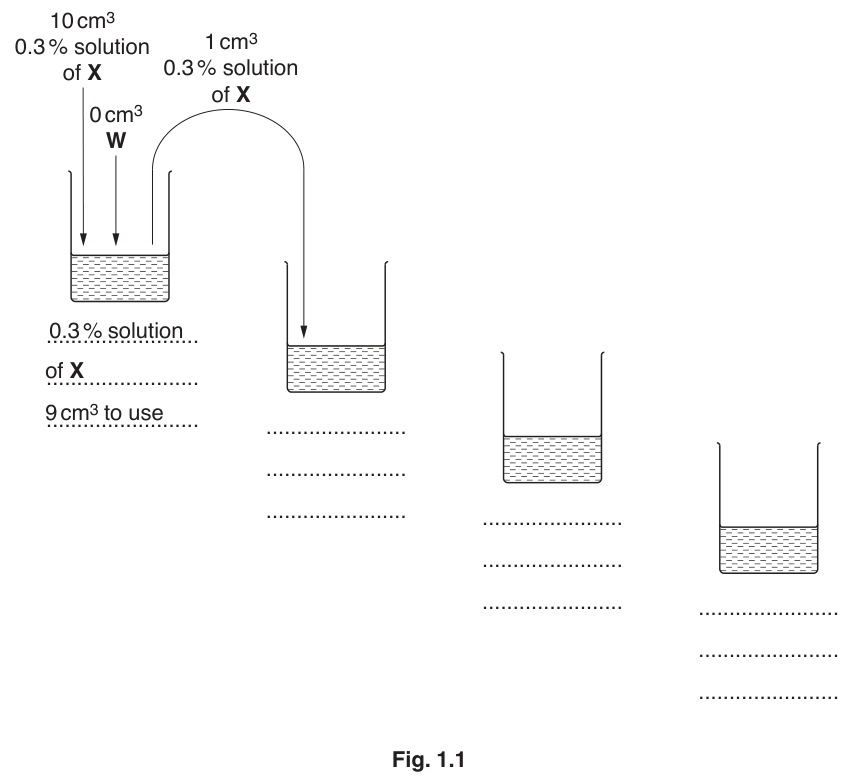
You should use the beakers shown in Fig. 1.1 to show how you will prepare the serial dilutions.
You will need to use of each different concentration of X in the investigation.
For each beaker, complete Fig. 1.1 to show how you will dilute the solution by:
- stating, under the beaker, the concentration and volume of the solution available for use in the investigation
- using one arrow, with a label above the beaker, to show the concentration and volume of the solution X added to prepare the concentration
- using another arrow, with a label above the beaker, to show the volume of W added to prepare the concentration.
Answer
The completed Fig. 1.1 shows four beakers, each containing of solution, made by adding of the previous concentration to of :
- Beaker 1: solution of , to use
- Beaker 2: solution of , to use
- Beaker 3: solution of , to use
- Beaker 4: solution of , to use
Concentrations 0.03%, 0.003%, 0.0003% labelled under beakers 2, 3 and 4; 1 cm³ transferred from each previous beaker; 9 cm³ of W added to each of the three new beakers.
Background Concept
A serial dilution is a step-wise dilution in which each new solution is prepared from the previous one. The concentration is reduced by a constant factor at every step. A common factor is 10 (a tenfold serial dilution), in which a small volume of the previous solution is added to a larger volume of diluent to make the next concentration.
The general dilution equation is
where and are the concentration and volume of the stock, and and are the concentration and total volume of the diluted solution. To dilute by 10 the ratio of stock to total must be — for example, of stock + of diluent = of a one-tenth-strength solution.
In this experiment the diluent is (distilled water), the total volume per beaker must be , and of each concentration is needed for the investigation. The remaining is used to start the next dilution.
Understanding the Question
You are given a partially completed Fig. 1.1 with four beakers. Beaker 1 is already complete: of + , with available to use. A curved arrow shows of being transferred to Beaker 2. You must complete the figure by:
- writing the concentration and volume available to use under Beakers 2, 3 and 4;
- adding arrows above Beakers 2, 3 and 4 showing the volume of transferred from the previous beaker and the volume of added.
Approach
Apply the tenfold dilution rule at each step: of previous + of = of a one-tenth solution. Work from Beaker 1 outwards, halving the digits in the concentration each time.
Step-by-Step Reasoning
- Beaker 1 (given): of + → solution, to use.
- Beaker 2: from Beaker 1 + → solution, to use.
- Beaker 3: from Beaker 2 + → solution, to use.
- Beaker 4: from Beaker 3 + → solution, to use.
The general rule at every step (except the first) is of the previous concentration + of = of a solution one-tenth as strong.
Key Takeaways
- A tenfold serial dilution always uses part stock + parts diluent to give parts of a solution one-tenth as concentrated.
- The same volume of diluent ( of ) is added at every step after the first.
- The volume available to use is always — the remaining is left behind to start the next dilution.
- Concentrations must be written with a leading zero (e.g. , not ).
Common Mistakes
- Forgetting the leading zero in very small concentrations.
- Adding to all four beakers, or to all four beakers — only the second, third and fourth beakers receive both and .
- Drawing the transfer arrow from the wrong beaker (it must come from the previous, more concentrated, beaker).
- Labelling only the percentage without including the sign, or omitting the volume available to use.
Things to Be Careful About
- Concentrations must be in the correct sequence: . Each is exactly one-tenth of the previous.
- The total volume in every beaker is ; the available to use is what remains after the is removed for the next dilution.
- The same syringe must be used for throughout (the question states "syringe labelled X should be used for solution X only") so that the transfer is accurate.
You are required to investigate the effect of different concentrations of X on the activity of catalase by finding the number of bubbles of oxygen released in two minutes.
Proceed as follows:
- Prepare the concentrations of X as shown in (b)(i). Note: syringe labelled X should be used for solution X only.
- Put of P into each of the concentrations of X, including 0.3% X. Shake gently to mix.
- Put of P and of W into a separate beaker.
- Leave for at least three minutes.
Read step 5 to step 13 before proceeding.
- Put of H into each of five test-tubes.
- Put of the mixture of P and W into one of the test-tubes.
- Put the bung (with the delivery tube attached) into this test-tube.
- Put the end of the delivery tube into the large beaker containing water labelled T.
- Start timing and count the number of bubbles of oxygen released in 2 minutes.
- Record the result in (b)(ii).
Note: if no bubbles are released then make sure the bung is securely fitted into the test-tube. You may ask for petroleum jelly if necessary.
- Put of the mixture of P with the lowest concentration of X into another test-tube containing H.
- Repeat steps 7 to 10.
- Repeat steps 11 and 12 with each of the other concentrations of X, including 0.3% X.
Consider how you will obtain results which are as accurate as possible.
Prepare the space below and record your results.
Answer
| Percentage concentration of (%) | Number of bubbles released in 2 minutes |
|---|---|
| 0 (W control) | 85 |
| 0.0003 | 76 |
| 0.003 | 58 |
| 0.03 | 38 |
| 0.3 | 22 |
| 0.3 (repeat) | 25 |
These values are representative — the student's own counts will vary, but the trend should be: bubble count decreases as the concentration of increases, because inhibits catalase activity.
Key features of the table:
- Heading for the independent variable: percentage concentration of (%)
- Heading for the dependent variable: number of bubbles released in 2 minutes
- 5 conditions tested: 0% (W control) and the four concentrations of
- Lowest concentration of () gives more bubbles than the highest ()
- At least one repeat recorded (here, repeated)
Representative table: 0% (W) = 85; 0.0003% = 76; 0.003% = 58; 0.03% = 38; 0.3% = 22; 0.3% (repeat) = 25 bubbles. Trend: bubble count decreases as [X] increases.
Background Concept
A results table is the standard way to record experimental data. A well-drawn table should have:
- A clear heading for every column, including the quantity and its unit.
- The independent variable (the one you deliberately change) in the first column.
- The dependent variable (the one you measure) in the next column.
- Replicate readings wherever possible, to give a measure of repeatability.
- Values written to a consistent number of decimal places, and a sensible range of the independent variable including a control.
The experiment tests how different concentrations of solution affect the activity of catalase. Catalase hydrolyses hydrogen peroxide to oxygen and water; the rate of reaction is estimated by counting the bubbles of released in 2 minutes. If is an inhibitor, more concentrated should give fewer bubbles.
Understanding the Question
The procedure runs five test-tubes: one with (the 0% control) and one each for the four concentrations of made in (b)(i). You must draw a results table and record the number of bubbles counted in 2 minutes for each tube. At least one concentration must be repeated.
Approach
Draw a two-column table. The first column is the independent variable (concentration of , including the W control). The second column is the dependent variable (number of bubbles in 2 minutes). Add a row for one repeat. Record your actual counts; the marks are for the table structure and trend, not for any particular number.
Step-by-Step Reasoning
- The independent variable has five values: (W), , , and .
- The dependent variable is the number of bubbles counted in 2 minutes — a count has no units, but the time interval must be stated in the heading.
- A repeat must be performed for at least one concentration (the procedure tells you to "Consider how you will obtain results which are as accurate as possible"). Repeating the highest concentration () is a good choice because it is the most likely to be erratic.
- Expected trend: because inhibits catalase (see (b)(iv)), increasing the concentration of should decrease the number of bubbles. The (W) control should give the most bubbles, and the tube should give the fewest.
- Representative counts that match this trend are given in the answer table above. The student's own numbers will differ but the trend should be the same.
Key Takeaways
- A results table must have a heading with units for every column, and must include a control (here, 0% ).
- Repeats are essential for assessing repeatability and identifying anomalous readings.
- The trend in the data is the biological signal — here, bubble count falls as [X] rises, indicating inhibition.
Common Mistakes
- Forgetting the units in the column heading (e.g. writing "concentration" without "%" or "bubbles" without "in 2 minutes").
- Omitting the W (0%) control row.
- Recording the same value for every concentration (a sign that the bubbles were not actually counted, or that a step was missed).
- Showing a reverse trend (more bubbles at higher [X]) — this contradicts the biology in (b)(iv) and is unlikely to be correct.
- Forgetting to include a repeat.
Things to Be Careful About
- Use whole numbers for bubble counts (you cannot count a fraction of a bubble).
- Keep the same number of decimal places down a column.
- Record the actual reading, not what you "expected" to see — examiners can spot invented data when it does not match the trend.
You are required to find the rate of activity of the catalase by measuring the time taken to collect of oxygen produced by the hydrolysis of H.
You are going to collect the oxygen released by displacement of water as shown in Fig. 1.2.
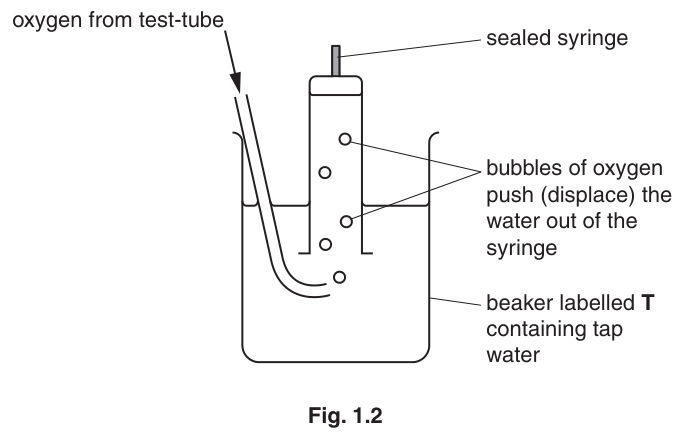
The sealed syringe is full of water and is upside down over the end of the delivery tube.
You need to time how long it takes for the bubbles of oxygen to push (displace) of the water out of the syringe.
- Put of H into a clean test-tube.
- Put of the mixture of P and W into this test-tube.
- Put the bung (with the delivery tube attached) into this test-tube.
- Fill the sealed syringe with water from the beaker and turn it upside down keeping the open end of the syringe under the water as shown in Fig. 1.2.
- Immediately put the end of the delivery tube into the beaker of water so that the bubbles of oxygen pass into the syringe.
- Start timing.
Record the time for of oxygen to be collected.
time = ______
Using your recorded time, calculate the rate of activity of the catalase in .
You may lose marks if you do not show your working and do not use the appropriate units.
rate of activity = ______
Working
Record the time taken for of oxygen to be collected, to the nearest whole second.
For example (representative value):
The rate of activity is the volume of oxygen collected per unit time:
Answer
Time = 20 s (representative)
Rate of activity = (to 1 significant figure, matching the precision of the time measurement)
Time ≈ 20 s; rate ≈ 0.1 cm³ s⁻¹ (representative example — actual value depends on the student's measured time).
Background Concept
The rate of an enzyme-catalysed reaction can be measured in several ways. Here the volume of oxygen released is measured, so the rate has units of volume per unit time — for example, or . The simplest way to find a rate is to measure how long it takes to collect a fixed volume of gas, and then divide that volume by the time:
In this experiment the volume is fixed at (read off the syringe of Fig. 1.2 as the water is displaced downwards), and the time is the one the student measures with a stop-clock.
Understanding the Question
You are asked to (a) record the time for of oxygen to be collected, and (b) use that time to calculate the rate of activity of catalase in . The question warns that you may lose marks if you do not show your working or use appropriate units.
Approach
Time the displacement carefully with a stop-clock. Read the time to the nearest whole second. Then substitute into with , and quote the answer with units and a sensible number of significant figures.
Step-by-Step Reasoning
- Start the stop-clock as soon as the end of the delivery tube is placed under the syringe (step 18 of the procedure).
- Watch the meniscus of water in the syringe and stop the clock the moment of water has been displaced.
- Record the time in whole seconds (e.g. 20 s).
- Calculate the rate using the formula above. With :
- Quote the answer to the same number of significant figures as the time (1 sig fig if is given to the nearest 10 s, 2 sig figs if is given to the nearest second).
- Always include the unit — a bare number with no unit scores 0.
The student's actual time will depend on the activity of their catalase extract; the calculation method is what earns the marks, not the particular value.
Key Takeaways
- Rate of gas production = volume of gas ÷ time, with units of volume per unit time.
- Always show your working and quote the answer with its unit.
- Match the number of significant figures in the rate to the precision of the time measurement.
Common Mistakes
- Writing the time as a decimal (e.g. 20.5 s) — the procedure uses a stop-clock reading in whole seconds.
- Inverting the calculation (writing instead of ).
- Omitting the unit , or writing it as "" without the exponent form (the negative-exponent form is the SI convention).
- Quoting too many significant figures (e.g. from ) — round to match the precision of the time.
Things to Be Careful About
- The question marks showing working as part of the mark scheme — write the equation, substitute the values, and then the final answer.
- The volume in the formula is (the fixed volume in the procedure), not the total volume of hydrogen peroxide added.
Using your knowledge of enzymes, suggest how solution X may be changing the activity of the catalase.
Answer
- Solution inhibits the activity of catalase.
- binds to the active site of catalase, preventing the substrate (hydrogen peroxide) from binding to the enzyme, so fewer enzyme–substrate complexes are formed and the rate of reaction falls.
X inhibits catalase activity; X prevents substrate binding to the active site (or fewer enzyme–substrate complexes are formed).
Background Concept
Enzyme inhibition is any process that reduces the rate of an enzyme-catalysed reaction. There are two broad classes:
- Competitive inhibition — the inhibitor is similar in shape to the substrate and binds to the active site, blocking substrate entry. Competitive inhibition can be overcome by increasing the substrate concentration.
- Non-competitive inhibition — the inhibitor binds to a site other than the active site (an allosteric site), changing the shape of the active site so the substrate can no longer bind effectively. Non-competitive inhibition cannot be overcome by adding more substrate.
In both cases the result is the same: fewer enzyme–substrate (E–S) complexes form per unit time, and the rate of reaction falls.
The data from (b)(ii) show that as the concentration of increases, the number of oxygen bubbles released in 2 minutes decreases. This is the classic signature of an inhibitor.
Understanding the Question
You are asked to use your knowledge of enzymes to suggest how might be changing the activity of catalase. The mark scheme rewards two ideas: that inhibits activity, and that it does so by interfering with substrate binding.
Approach
Link the observed trend (fewer bubbles at higher [X]) to a mechanism. The most direct mechanism is that molecules of occupy the active site of catalase, so hydrogen peroxide cannot bind and fewer E–S complexes form.
Step-by-Step Reasoning
- The trend in (b)(ii) — bubble count falls as [X] rises — shows that is reducing the activity of catalase. This is the mark-scheme point "inhibits activity".
- The most common way a small molecule reduces enzyme activity is to bind to the active site in place of the substrate. The substrate (hydrogen peroxide) is then blocked from binding.
- With fewer successful binding events, fewer enzyme–substrate complexes form per unit time, so less oxygen is produced and fewer bubbles are released.
- Either wording — "prevents substrate binding to the active site" or "fewer enzyme–substrate complexes are formed" — earns the second mark.
Key Takeaways
- A fall in reaction rate as the concentration of an added substance rises is the signature of an inhibitor.
- Inhibitors typically act by blocking substrate binding at the active site (competitive) or by changing the shape of the active site (non-competitive).
- The result of either mechanism is a reduction in the number of enzyme–substrate complexes formed per unit time.
Common Mistakes
- Stating that "stops the reaction" or "destroys the enzyme" — at the concentrations used, reduces the rate, it does not abolish the reaction completely.
- Saying "uses up the hydrogen peroxide" — is a different substance and does not react with the substrate in this way.
- Confusing competitive and non-competitive inhibition without committing to one — either mechanism is acceptable here, but the answer must commit to blocking substrate binding to earn the second mark.
Things to Be Careful About
- The question uses the command word "suggest", so any biologically plausible mechanism is acceptable — but it must be specific to enzymes (e.g. active site, E–S complexes).
- Do not describe the effect of on the substrate (hydrogen peroxide) — describe its effect on the enzyme (catalase).
Identify one significant source of error when using each of the two methods to measure the dependent variable.
one significant error in counting the number of bubbles
______
one significant error in measuring the displacement of water
______
Answer
One significant error in counting the number of bubbles:
The bubbles of oxygen are of different sizes, or are released too fast to count accurately, or group together so individual bubbles cannot be distinguished.
One significant error in measuring the displacement of water:
Some oxygen escapes from the delivery tube before it reaches the syringe, or not all bubbles enter the syringe (they rise to the surface of the water in the beaker), or there is a parallax error when reading the meniscus of water in the syringe.
Any one of the above errors is credited for each method.
Bubble counting: bubbles are of different sizes / released too fast / group together. Water displacement: gas escapes from delivery tube / not all bubbles enter the syringe / parallax error when reading the syringe.
Background Concept
Every measuring technique has limitations. A good practical scientist can name the specific limitations of each method, not just say "human error" or "not accurate". For an experiment measuring gas production, the limitations are usually about:
- the physical nature of the gas bubbles (size, rate of release, tendency to coalesce);
- the transfer of gas from the reaction vessel to the measuring device (leaks from joints, bubbles missing the collection vessel);
- the reading of the measuring device (parallax, end-point judgement).
Understanding the Question
You must identify one significant source of error for each of the two methods used to measure the dependent variable: (1) counting bubbles in 2 minutes, and (2) measuring the volume of oxygen by water displacement in a syringe.
Approach
For each method, think about the chain of events between the reaction happening in the test-tube and the reading being taken. Where could information be lost or distorted? That is your source of error.
Step-by-Step Reasoning
Counting bubbles (method 1)
- The bubbles are produced by an enzyme-catalysed reaction, so they vary in size as the rate changes during the 2 minutes.
- At high reaction rates the bubbles come out so fast that they merge (group together) into a stream, making it hard to count individual bubbles.
- The eye cannot reliably count more than about 5–6 events per second; any rate above this under-counts the true number.
- Credit: different sizes, too fast, or bubbles group together.
Water displacement (method 2)
- The delivery tube is the only route for oxygen to reach the syringe. If the bung is not perfectly tight, gas leaks out around the joint instead of going up the tube.
- Even with a tight bung, some bubbles miss the syringe and float up through the beaker of water to the surface.
- When the syringe fills, the meniscus of water must be read against a scale; if the eye is not level with the meniscus there is a parallax error.
- The water in the beaker may be slightly above room temperature; oxygen is slightly soluble in water, so a small fraction dissolves rather than displacing water.
- Credit: gas escapes from the delivery tube, not all bubbles enter the syringe, or parallax error.
Key Takeaways
- Sources of error must be specific to the apparatus and method, not generic ("human error").
- For gas-collection experiments, the most common errors are: bubble size / coalescence, leakage at joints, bubbles missing the collection vessel, and parallax when reading a scale.
Common Mistakes
- Vague answers such as "human error", "not accurate enough", "the bubbles were hard to count" — these do not name the specific limitation.
- Stating the same error for both methods.
- Describing how to improve the method instead of identifying the error.
- Naming an error that is not really significant (e.g. "the syringe wasn't perfectly clean").
Things to Be Careful About
- "Parallax error" is a specific mark-scheme point for the syringe reading, not for bubble counting — make sure each error is matched to the right method.
- One mark is awarded per method, so a single clear statement is enough for each.
This first procedure investigated the effect of the concentration of X on the activity of catalase in the plant extract.
To modify this procedure for investigating another variable, the independent variable (concentration of X) would need to be standardised.
Describe how the independent variable (concentration of X) will be standardised.
______
Consider how you would modify this procedure to investigate the effect of temperature on the activity of the catalase in the plant extract.
Describe how the independent variable, temperature, will be investigated.
Answer
Standardising the independent variable (concentration of ):
Use the same concentration of (e.g. the solution, or any one fixed concentration) in every test-tube so that the only variable that changes is the temperature.
Investigating the new independent variable (temperature):
- Investigate 5 or more different temperatures (a typical range would be, for example, , , , and , or any other set of at least 5 evenly spaced values within a sensible biological range for catalase).
- Hold each temperature constant using a thermostatically-controlled water-bath; place the test-tube containing the reaction mixture in the water-bath so that its contents equilibrate to the set temperature before adding the hydrogen peroxide.
Standardise X by using the same concentration throughout. Investigate temperature using 5 or more temperatures held constant in a thermostatically-controlled water-bath.
Background Concept
A valid fair test requires that only one variable — the independent variable — is changed at a time. Every other variable that could affect the result must be standardised (kept the same in every test). In a temperature investigation, the concentration of becomes a control variable, and temperature becomes the new independent variable.
For the temperature itself to be a valid independent variable, it must be:
- Varied across a sensible range that is likely to reveal the effect (too narrow a range misses the optimum; too wide a range is wasteful and may denature the enzyme permanently at high temperatures).
- Measured accurately at each value.
- Held constant during the reaction at each value — a thermostatically-controlled water-bath is the standard piece of apparatus for this.
The dependent variable (rate of catalase activity) is still measured by bubble counting or water displacement, exactly as in (b)(ii)–(iii).
Understanding the Question
You are asked two things:
- How to standardise the original independent variable (concentration of ) so that it is no longer the variable being changed.
- How to investigate a new independent variable, temperature, by changing it in a controlled way and measuring its effect on catalase activity.
The mark scheme gives 1 mark for the first part and 2 marks for the second (5 or more temperatures; thermostatically-controlled water-bath).
Approach
- For standardising : pick one concentration and use it in every test.
- For the temperature investigation: decide on a sensible range of at least 5 temperatures, and use a thermostatically-controlled water-bath to hold each temperature precisely.
Step-by-Step Reasoning
- Standardising : the simplest way is to use the same concentration (e.g. the solution) in every test-tube. This is exactly what is meant by "control of variables" in CIE marking — keep the variable the same in every test.
- Range of temperatures: at least 5 evenly spaced values. A typical range for catalase is to in steps, giving 5 temperatures. Anything from 5 to 7 values is fine.
- Temperature control: a thermostatically-controlled water-bath is required because a beaker of water on a tripod loses heat rapidly and the temperature drifts. The water-bath holds the temperature to within , which is essential for a valid comparison between temperatures.
- The reaction mixture (catalase extract + + hydrogen peroxide) is placed in the water-bath and left to equilibrate to the set temperature before timing is started; otherwise the reading will not be at the intended temperature.
Key Takeaways
- Standardising a variable means keeping it the same in every test — for , this means using one fixed concentration.
- Investigating a new variable requires (a) a sensible range of at least 5 values, and (b) precise control apparatus (thermostatically-controlled water-bath for temperature).
- Always equilibrate the reaction mixture to the target temperature before starting the reaction, otherwise the temperature during the reaction is not the temperature you set.
Common Mistakes
- "Vary the concentration of at each temperature" — this would change two variables at once and make the results impossible to interpret.
- Using only 2 or 3 temperatures — the mark scheme requires at least 5 to reveal a trend (especially to see the optimum and the denaturation drop-off).
- Saying "use a Bunsen burner to heat the water" — a Bunsen burner cannot hold a temperature constant, and an open flame is a hazard near hydrogen peroxide.
- Forgetting to mention equilibration — adding the reactants and then putting the tube in the water-bath means the reaction begins at room temperature, not at the target temperature.
Things to Be Careful About
- The mark scheme credits "thermostatically-controlled water-bath" as a single specific piece of apparatus — a beaker of water on a hot plate, or a Bunsen burner, is not accepted.
- A sensible range of temperatures is implied: values must lie within a range where catalase is active (roughly to ). Values outside this range are not useful.
- The dependent variable (rate of catalase activity) is still measured by bubble counting or water displacement; do not propose a different measurement method.
The rest of this paper
1 more questions- Q2Presentation of Data and Observations · Analysis, Conclusions and Evaluation · Use of the Light Microscope · Manipulation, Measurement and Observation22M