Biology 9700/36 — October/November 2014
Cambridge AS Level · Advanced Practical Skills · worked solutions for every part, with the mark scheme
Topics Manipulation, Measurement and Observation · Presentation of Data and Observations · Analysis, Conclusions and Evaluation · Use of the Light Microscope
An enzyme, E, catalyses the hydrolysis (breakdown) of triglycerides into fatty acids and glycerol.
The substrate for E will be the triglycerides present in milk, labelled M.
The end-point of this hydrolysis can be determined by using an indicator, B, which changes colour to yellow when the fatty acids are produced.
You are required to:
- prepare different concentrations of the enzyme solution, E
- investigate the effect of different concentrations of E (independent variable) on the hydrolysis of triglycerides in milk.
You are provided with:
| labelled | contents | hazard | volume / |
|---|---|---|---|
| E | 5% enzyme solution | irritant | 40 |
| W | distilled water | none | 60 |
| B | indicator solution | stains | 20 |
| M | milk | none | 40 |
| A | solution of alkali | irritant | 40 |
You are required to dilute the 5% enzyme solution, E, to provide a range of known concentrations using simple dilution.
Decide on the further concentrations of enzyme solution you will use in your investigation in addition to the 5% solution, E.
You will need to use of each enzyme solution.
Prepare the space below to show:
- the concentration of each enzyme solution
- the volumes of E
- the volumes of W.
Read step 1 to step 13 before proceeding.
Proceed as follows:
- Prepare all the concentrations of enzyme solutions you have listed in (a)(i) in the containers provided.
You are required to investigate the effect of different concentrations of enzyme solutions on the hydrolysis of triglycerides in milk. The appearance of fatty acids can be detected using the indicator solution B.
Every 30 seconds, for a total of 180 seconds, a sample of milk will be removed from the test-tube and placed on a tile. You will need to have prepared this tile before you add the enzyme solutions.
- Wipe the tile clean with a damp paper towel and then dry the tile. Label the tile as shown in Fig. 1.1. The numbers indicate the sampling times in seconds. Put two drops of indicator solution, B, on the tile above each sampling time, as shown in Fig. 1.1.
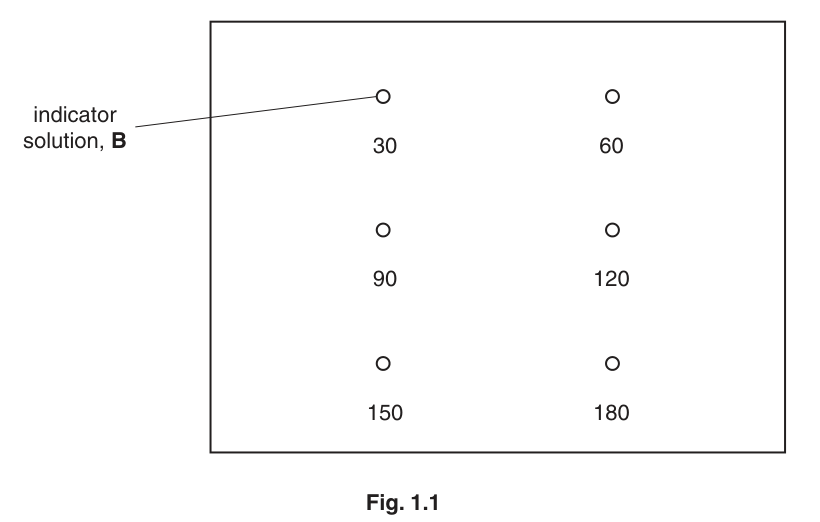
- Prepare a water-bath between and . You will need to add hot water/cold water to maintain the temperature of the water-bath between and for steps 7 to 12.
- Put of M into a test-tube.
- Put of A into the same test-tube.
- Repeat steps 4 and 5 for each of the concentrations of enzyme solution you are going to investigate, including the 5% concentration, E.
- Put all the test-tubes into the water-bath. Allow 2 minutes for the contents of the test-tubes to reach the same temperature as the water-bath.
The reaction will start as soon as you add the enzyme solutions so read steps 8 to 13 before proceeding.
- Put of the 5% concentration, E, into one of the test-tubes, leaving the test-tube in the water-bath. Stir the contents of the test-tube and start timing.
- After 30 seconds use the pipette to transfer two drops of the contents of the test-tube to the drop of B, labelled 30.
- Repeat step 9, at 30 second intervals, until a drop changes to yellow (end-point).
- Record the time taken to reach the end-point.
- If the drop at 180 seconds does not reach the end-point, record 'more than 180' as your result.
Once you have recorded a time for the end-point remove this test-tube from the water-bath and proceed to step 12.
- Wipe the tile clean with a damp paper towel and then dry the tile. Label the tile again as shown in Fig. 1.1.
- Repeat steps 8 to 12 with the remaining concentrations of enzyme solutions.
Prepare the space below to record your results.
Identify one significant source of error in measuring the dependent variable in this investigation.
Describe one improvement to this investigation which would increase the confidence in your results.
A student investigated an enzyme which hydrolyses starch to glucose over a period of 20 minutes. The student measured the mass of glucose present at four minute intervals.
The volumes and concentrations of starch and enzyme were kept the same (standardised).
State two other variables that need to be standardised in this investigation.
Describe how you would standardise each of these variables.
The results are shown in Table 1.1.
Table 1.1
| time / min | mass of glucose / mg |
|---|---|
| 4 | 1.90 |
| 8 | 3.15 |
| 12 | 3.90 |
| 16 | 4.00 |
| 20 | 4.05 |
Using the results in Table 1.1, calculate the rate of production of glucose between:
- 4 and 12 minutes
rate = ______
- 12 and 20 minutes.
rate = ______
Plot a graph of the data in Table 1.1.

Explain the reasons for the change in mass of glucose between:
- 0 and 12 minutes
- 12 and 20 minutes.
The rest of this paper
1 more questions- Q2Use of the Light Microscope · Manipulation, Measurement and Observation · Presentation of Data and Observations19M