Biology 9700/35 — October/November 2014
Cambridge AS Level · Advanced Practical Skills · worked solutions for every part, with the mark scheme
Topics Presentation of Data and Observations · Analysis, Conclusions and Evaluation · Manipulation, Measurement and Observation · Use of the Light Microscope
Enzymes in yeast cells catalyse the hydrolysis (breakdown) of glucose and release carbon dioxide and ethanol.
You are required to investigate the effect of different concentrations of yeast cell suspension, Y (independent variable), on the hydrolysis of glucose using methylene blue solution, M, by:
- preparing different concentrations of the yeast cell suspension, Y
- adding glucose solution, G, to activate the yeast cell suspension, Y, so that M changes colour from blue to blue/green as a result of the activity of the enzymes in the yeast cells.
You are provided with:
| labelled | contents | hazard | volume / |
|---|---|---|---|
| Y | 10% yeast cell suspension | none | 100 |
| G | glucose solution | none | 80 |
| W | distilled water | none | 150 |
| M | methylene blue solution | stains | 20 |
If any methylene blue solution comes into contact with your skin wash it off immediately with water.
Complete Fig. 1.1 to show how you will dilute Y to prepare a serial dilution.
You should use the two beakers shown in Fig. 1.1 and add as many extra beakers as you need to prepare a serial dilution.
You will need to prepare of each suspension.
For each beaker, complete Fig. 1.1 to show how you will dilute Y by:
- showing under each beaker the concentration and volume of the suspension in this beaker
- using one arrow, with a label above the beaker, to show the concentration and volume of yeast cell suspension added
- using another arrow, with a label above the beaker, to show the volume of water added.
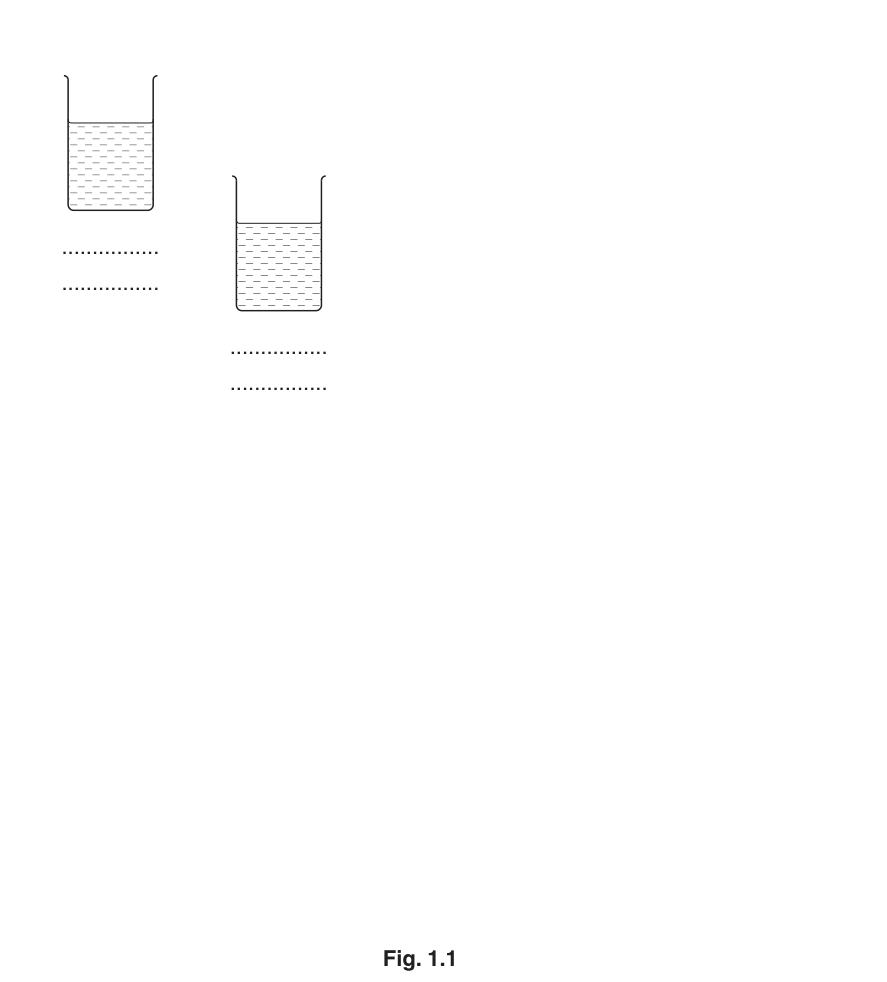
Fig. 1.1
- Prepare all the concentrations of yeast cell suspension, as shown in Fig. 1.1 on page 3, in the containers provided.
You are required to put methylene blue solution with the yeast cell suspension and G.
When G is added to the yeast cell suspension the enzymes in the yeast cell suspension will start to catalyse the breakdown of glucose. Methylene blue solution changes colour as these enzymes become active as shown in Fig. 1.2.
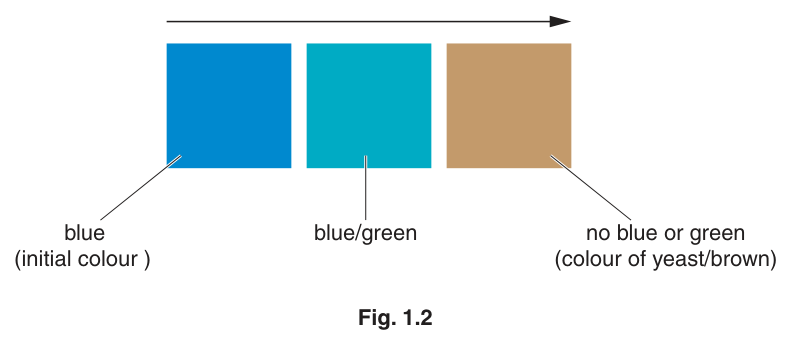
Fig. 1.2
5 minutes after adding G you are required to stop timing and record your observations of the concentrations of yeast cell suspension prepared in (a)(i).
Read step 2 to step 9 before proceeding.
Proceed as follows:
- In step 6 you will require a water-bath. Use the beaker or container provided to prepare a water-bath with warm water between and . You will need to add hot/cold water to maintain the temperature of the water-bath between and for steps 6 to 8.
- Put of the 10% Y into your first test-tube.
- Put of each of the other concentrations of yeast cell suspensions that you prepared in step 1 into separate test-tubes.
- Put of M into each of the test-tubes.
Note that the contents of the test-tubes might be different shades of blue.
- Put all the test-tubes into the water-bath between and and leave for two minutes.
You will start timing as soon as you add G (in step 7).
- Leaving the test-tubes in the water-bath put of G, into each of the test-tubes and gently shake to mix the contents. Start timing.
Do not shake the test-tubes again during the investigation.
- After 5 minutes, stop timing and put the test-tubes in the test-tube rack in the order of the concentrations of yeast cell suspension.
- Record your observations of each concentration of yeast cell suspension.
Prepare the space below to record your observations.
You used syringes to measure the volumes of the yeast cell suspension.
State the volume of the smallest division on the syringe ______
State the actual error in using the syringe.
actual error = ______
Identify one significant source of error in measuring the dependent variable in this investigation.
Describe one improvement to this investigation which would increase the confidence in your results.
You are required to use a sharp pencil for graphs.
Lactose, a disaccharide sugar, is the main carbohydrate of milk.
Some people cannot breakdown lactose and scientists have investigated ways to remove lactose from milk.
One type of yeast was found to contain the enzyme, E, that breaks down (hydrolyses) lactose.
E can be held within (immobilised) alginate beads and put into milk.
As the milk comes into contact with the alginate beads, E hydrolyses the lactose.
Scientists have investigated the effect of keeping the alginate beads in contact with the milk for different lengths of time and the percentage hydrolysis of lactose was found.
The volumes and concentration of lactose and E were kept the same (standardised).
State two other variables that need to be standardised in this investigation.
Describe how you would standardise each of these variables.
The results are shown in Table 1.1.
Table 1.1
| time alginate beads in contact with milk / minutes | percentage hydrolysis of lactose |
|---|---|
| 0 | 0 |
| 24 | 34 |
| 52 | 63 |
| 84 | 81 |
| 120 | 85 |
Plot a graph of the data in Table 1.1.

Using your graph state the percentage hydrolysis of lactose at 45 minutes.
______ %
Explain the reason for the difference in the results at 30 minutes and 70 minutes.
Suggest a reason for the change in the trend after 90 minutes.
The rest of this paper
1 more questions- Q2Use of the Light Microscope · Analysis, Conclusions and Evaluation · Presentation of Data and Observations19M