Biology 9700/34 — October/November 2014
Cambridge AS Level · Advanced Practical Skills · worked solutions for every part, with the mark scheme
Topics Presentation of Data and Observations · Analysis, Conclusions and Evaluation · Manipulation, Measurement and Observation · Use of the Light Microscope
Blood plasma contains the protein albumin. The concentration of albumin in a person’s blood may be measured to identify health problems.
You are required to estimate, as accurately as possible, the concentration of albumin in a sample of blood plasma, U, by:
- carrying out a trial using the concentrations of albumin solutions P1 and P2
- using the results of the trial prepare further concentrations of albumin solution
- obtaining more readings, so that you can estimate more accurately the concentration of albumin solution in U.
The albumin concentration can be measured by using potassium hydroxide solution and copper sulfate solution.
Fig. 1.1 shows the result of adding potassium hydroxide solution and copper sulfate solution to a sample containing albumin.
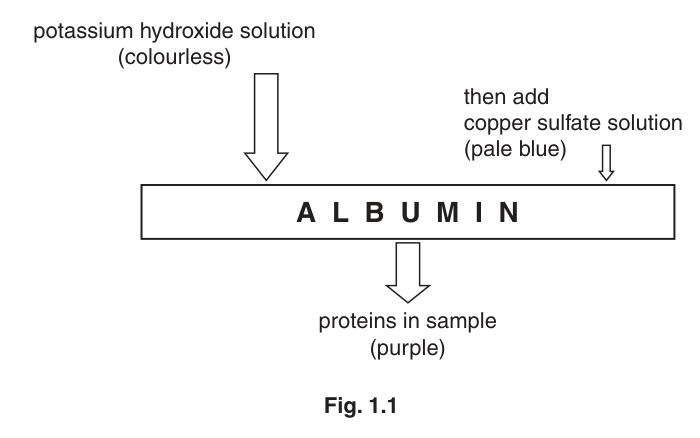
You are provided with:
| labelled | contents | hazard | volume / |
|---|---|---|---|
| K | potassium hydroxide solution | harmful irritant corrosive | 20 |
| C | copper sulfate solution | harmful | 20 |
| P1 | 0.8% albumin solution | none | 40 |
| P2 | 1.6% albumin solution | none | 40 |
| U | blood albumin sample | none | 20 |
| W | distilled water | none | 120 |
You are advised to wear safety glasses or goggles, especially when using the potassium hydroxide, K. If potassium hydroxide, K, comes into contact with your skin, wash it off with plenty of cold water.
Read step 1 to step 6 before proceeding.
Proceed as follows:
You are required to estimate the concentration of U using P1, P2 and W.
- Put of the sample to be tested (for example, P1) into a test-tube.
- Put of K into the same test-tube. Shake gently to mix.
- Put of C into the same test-tube. Shake gently to mix.
- Repeat steps 1 to 3 to test P2, U and W.
- Record your colour observations.
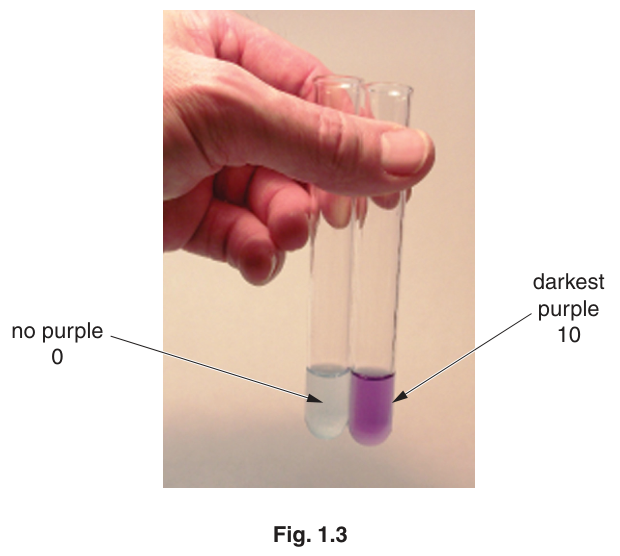
- In a test-tube rack put the test-tubes in an order which will enable you to record each colour as a number using the scale shown in Fig. 1.2. Use Fig. 1.3 to help you with the colours.
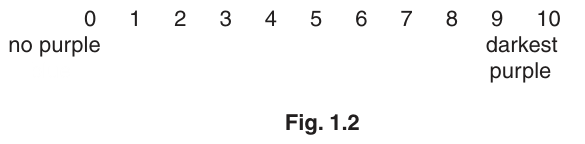
Fig. 1.3 shows an example of no purple (0) and an example of darkest purple (10).
Prepare the space below to record your colour observations and the number using the scale shown in Fig. 1.2.
Answer
| sample | colour | scale / 0–10 |
|---|---|---|
| P1 (0.8%) | light purple | 4 |
| P2 (1.6%) | purple | 7 |
| U | very light purple | 2 |
| W | pale blue (no purple) | 0 |
(Draw the table with the three columns separated by lines, and underline the headings with a ruler. Representative values are shown — the actual scale numbers depend on the candidate's own observations, but W must be 0 and the scale number for P1 must be lower than for P2.)
Table: W = 0; P1 (0.8%) lower than P2 (1.6%); U between 0 and P1.
Background Concept
The Biuret test detects peptide bonds. Copper(II) ions from copper sulfate complex with the nitrogen atoms of peptide bonds in an alkaline (KOH) environment, producing a purple colour whose intensity is proportional to the number of peptide bonds — and therefore to the protein concentration. Albumin is a globular blood-plasma protein; the more albumin present, the deeper the purple colour.
Understanding the Question
You have carried out the test on four solutions: the two standards P1 (0.8%) and P2 (1.6%), the unknown U, and a water control W. You must record what you saw as a colour description and as a number from the 0–10 scale in Fig. 1.2 (0 = no purple / blue, 10 = darkest purple).
Approach
Construct a single ruled table with three columns: sample identity, observed colour, and a numerical scale value. Use the control W to confirm the lower end of the scale (W = 0, only the blue of the alkaline CuSO₄ is visible), and use P1 and P2 to anchor the upper end. The unknown U should sit between 0 and P1 (or wherever your trial observations place it).
Step-by-Step Reasoning
- Format the table with three columns separated by lines and headings underlined with a ruler — this is a CIE convention that earns a mark.
- Headings should be 'sample', 'colour' and 'scale (0–10)' (or similar); a heading called 'scale' is the specific requirement of the mark scheme.
- W = 0 because water contains no protein, so the Biuret complex cannot form — the tube stays the blue colour of the alkaline copper solution.
- P1 < P2 on the scale because P2 is twice the concentration of P1 and therefore produces a more intense purple colour.
- U lies between 0 and P1 (the question hints at this in (ii)) and so receives a small positive scale number.
Key Takeaways
- The Biuret reaction is quantitative: deeper purple = more protein.
- A negative control (W) is essential to confirm that any purple colour observed is due to protein and not to the reagents themselves.
- CIE practical tables must have underlined column headings and lines separating the columns.
Common Mistakes
- Forgetting to underline the headings or to separate the columns with lines (each loses a mark).
- Recording W with a non-zero scale value — W is a negative control and must be 0.
- Recording P1 with a higher scale value than P2 — P2 is twice as concentrated, so its colour must be more intense.
- Leaving the colour column empty or giving only a generic 'purple' for every sample.
Things to Be Careful About
- The scale is subjective, so different candidates will assign slightly different numbers, but the relative order must be the same.
- Judge the colour within a consistent time after adding the reagents (the colour develops within seconds and is stable).
- The actual scale numbers in the solution are illustrative; the candidate's own readings should preserve the order W < U < P1 < P2.
Complete the following by using one of the words ‘more’ or ‘less’.
You may use each word once or more than once.
U is ______ concentrated than 0.8% (P1).
U is ______ concentrated than 1.6% (P2).
Use your results to estimate the concentration of albumin in U.
Answer
- U is less concentrated than 0.8% (P1).
- U is less concentrated than 1.6% (P2).
Estimate: the concentration of albumin in U is less than 0.8%.
U is less concentrated than both P1 and P2; therefore the concentration of U is less than 0.8%.
Background Concept
The Biuret reaction is quantitative: a lower scale number corresponds to a less intense purple colour, which corresponds to a lower protein concentration. This lets you use the standards of known concentration (P1 and P2) to estimate the concentration of the unknown (U).
Understanding the Question
You must fill in the two blanks in the question with 'more' or 'less', then state an estimate of U's concentration. The words can each be used once or more than once, so the same word may appear in both blanks.
Approach
Read the scale values from your table in (i). If U's value is lower than P1's, U is less concentrated than P1. If U's value is lower than P2's, U is also less concentrated than P2. With both blanks filled in, state the implied bound on U's concentration.
Step-by-Step Reasoning
- U's scale number from (i) is less than P1's scale number.
- Therefore U is less concentrated than P1 (0.8%).
- U's scale number is also less than P2's, so U is less concentrated than P2 (1.6%) as well.
- Combining these, the concentration of U must be less than 0.8%.
Key Takeaways
- A more intense purple colour = more protein = more concentrated.
- Comparing an unknown to standards of known concentration allows you to bracket the unknown between two values.
Common Mistakes
- Writing 'more' in either blank — U gives a less intense colour than both P1 and P2.
- Omitting the final estimate of U's concentration.
- Stating the estimate as a single number rather than a bound (e.g. '0.4%') — the trial data only allow you to say U < 0.8%.
Things to Be Careful About
- The required wording is 'more/less concentrated', not 'higher/lower concentration'.
- The estimate must be consistent with both blanks.
State which solution P1 or P2 you will dilute to prepare further concentrations.
Explain the reason for your decision.
Answer
Dilute P1 (0.8% albumin solution).
Reason: U has a lower scale number than P1, so U is less concentrated than 0.8%. Diluting P1 will give a series of concentrations that bracket U (some above and some below U's value), allowing a more accurate estimate.
P1, because U has a lower scale number than P1.
Background Concept
A serial dilution is a stepwise dilution that produces a geometric series of concentrations (each step halves the concentration if equal volumes are mixed). To estimate an unknown accurately, you prepare a range of standards that bracket the unknown — i.e. some standards are more concentrated and some are less concentrated than the unknown.
Understanding the Question
You must choose to dilute either P1 (0.8%) or P2 (1.6%) to prepare a further range of concentrations, and explain why. The aim is to obtain a more accurate estimate of U's concentration in (vi).
Approach
Decide which of P1 or P2 is closer to U in concentration. The standard you should dilute is the one that is just above U in concentration, so that diluting it produces a series that straddles U's value.
Step-by-Step Reasoning
- From (ii), U is less concentrated than 0.8% (P1).
- Therefore P1 (0.8%) is just above U, while P2 (1.6%) is well above U.
- Diluting P1 will give a series of concentrations between 0.8% and 0% that bracket U.
- Diluting P2 would give a series between 1.6% and 0% that does not bracket U as tightly (no standards between 0.8% and 1.6%).
- The standard to dilute is therefore P1, and the reason is that U has a lower scale number than P1.
Key Takeaways
- Bracketing an unknown between two standards gives the most accurate interpolation.
- The standard chosen for serial dilution should be the one just above the unknown in concentration.
Common Mistakes
- Choosing P2 because it is the more concentrated stock — this ignores the position of U relative to the standards.
- Stating the reason as 'because P1 is closer to U' without mentioning the scale number — the mark scheme specifically requires the scale-number comparison.
Things to Be Careful About
- The decision depends on the trial results, not on a preconceived idea of what U should be.
- The reason must explicitly link U's scale number to P1's scale number.
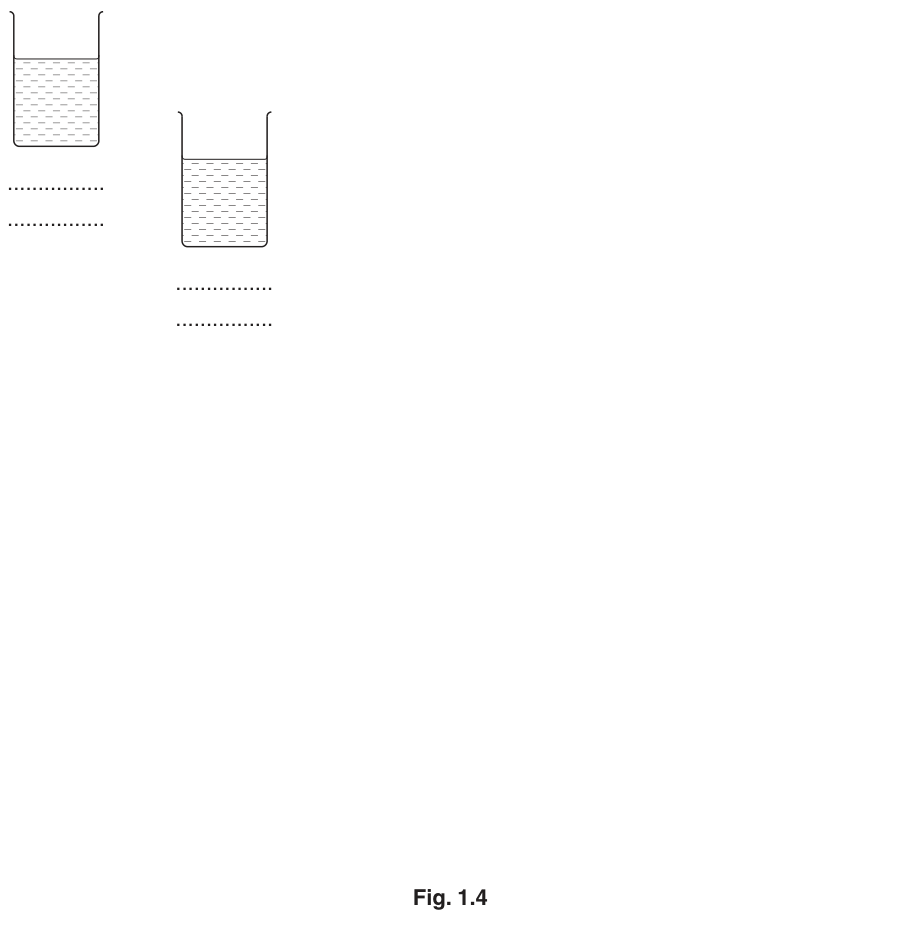
Complete Fig. 1.4 on page 6 to show how you will dilute the solution you decided on in (iii) to prepare a serial dilution.
You should use the two beakers shown in Fig. 1.4 and add as many extra beakers as you need to prepare a serial dilution.
You will need to prepare of each solution.
For each beaker, complete Fig. 1.4 to show how you will dilute the solution you decided on in (iii) by:
- showing under each beaker the concentration and volume of the solution prepared in this beaker
- using one arrow, with a label above the beaker, to show the concentration and volume of albumin solution added
- using another arrow, with a label above the beaker, to show the volume of water added.
Answer
Complete Fig. 1.4 to show a serial dilution starting from 0.8% P1:
Concentrations and volumes under each beaker:
| beaker | concentration | volume |
|---|---|---|
| 1 (P1) | 0.8% | |
| 2 | 0.4% | |
| 3 | 0.2% | |
| 4 | 0.1% | |
| 5 | 0.05% |
At each step, transfer of the previous beaker's solution into the next beaker, then add of distilled water.
Serial dilution from 0.8% P1: 0.4%, 0.2%, 0.1%, 0.05% (each step: 10 cm³ of previous + 10 cm³ of water).
Background Concept
A serial dilution is a stepwise dilution in which each beaker is used to prepare the next, more dilute one. If equal volumes of solution and diluent (water) are mixed at each step, the concentration is halved. The advantage is that a small number of bulk solutions and a single repeating procedure generate a wide range of accurately known standards.
Understanding the Question
You must complete Fig. 1.4 to show how to dilute the stock you chose in (iii) — P1 at 0.8% — by serial dilution. You need at least four further concentrations and must prepare of each solution for testing. The figure must show, for each beaker, the concentration and volume underneath, plus two labelled arrows: one for the volume of stock solution added, one for the volume of water added.
Approach
Decide on the dilution factor. Mixing equal volumes halves the concentration, so a 1:1 dilution at each step gives 0.8% → 0.4% → 0.2% → 0.1% → 0.05%. Decide on volumes: to leave enough solution in each beaker both to transfer to the next and to keep for testing, prepare in each beaker.
Step-by-Step Reasoning
- Beaker 1 already contains the 0.8% P1 stock (drawn in Fig. 1.4); label it '0.8%' and '' (or whatever volume is shown) underneath.
- Transfer 1: draw an arrow from beaker 1 into beaker 2 labelled ' of 0.8% P1' above. Draw a second arrow into beaker 2 labelled ' of water' above. Label beaker 2 underneath with '0.4%' and ''.
- Transfer 2: arrow from beaker 2 into beaker 3 labelled ' of 0.4%'; arrow into beaker 3 labelled ' of water'. Label beaker 3 '0.2%' and ''.
- Transfer 3: arrow from beaker 3 into beaker 4 labelled ' of 0.2%'; arrow into beaker 4 labelled ' of water'. Label beaker 4 '0.1%' and ''.
- Transfer 4: arrow from beaker 4 into beaker 5 labelled ' of 0.1%'; arrow into beaker 5 labelled ' of water'. Label beaker 5 '0.05%' and ''.
- Each step halves the concentration because equal volumes are mixed: , and so on.
Key Takeaways
- A serial dilution with equal volume transfers halves the concentration at each step.
- Each beaker must hold enough solution both to transfer to the next beaker and to be tested.
- A clear diagram with arrows and labels is the standard way to communicate a dilution scheme.
Common Mistakes
- Forgetting to label the volume on each arrow (the mark scheme requires both the volume of stock and the volume of water, with the unit ).
- Using unequal volumes (e.g. + ) — this still works but does not give a simple halving series and is harder to calculate.
- Not labelling the concentration underneath each beaker.
- Forgetting to add more beakers — the question requires at least four further concentrations beyond the stock.
Things to Be Careful About
- The arrows must point into the destination beaker and be clearly labelled above.
- The concentration and volume must be written underneath each beaker.
- The mark scheme requires at least four further concentrations (i.e. four beakers beyond the original P1).
- Prepare all the concentrations of albumin solution, as shown in Fig. 1.4, in the containers provided.
- Repeat steps 1 to 3 (page 4) with each of the solutions.
- Repeat steps 5 and 6 (page 4).
Prepare the space below to record your colour observations and the number using the scale shown in Fig. 1.2 (page 4).
Answer
| concentration of albumin / % | colour | scale / 0–10 |
|---|---|---|
| 0.8 | light purple | 4 |
| 0.4 | paler purple | 2 |
| 0.2 | very pale purple | 1 |
| 0.1 | blue-purple | 0.5 |
| 0.05 | pale blue | 0 |
| U | very light purple | 2 |
Trend: as the concentration of albumin decreases, the intensity of the purple colour decreases and the scale number falls.
Table with serial-dilution results showing scale number decreasing as concentration decreases; U's row included.
Background Concept
The Biuret reaction is quantitative across a wide range of concentrations: doubling the protein concentration approximately doubles the intensity of the purple colour, so a serial dilution gives a graded series of colour intensities. This graded series can be used as a calibration to estimate the concentration of an unknown.
Understanding the Question
After preparing the serial dilution in (iv), you repeat the Biuret test on each concentration and on U. You must record the colour and scale value for each in a table, and the marks require you to record at least three concentrations and to show the correct trend.
Approach
Construct a second ruled table with three columns: concentration of albumin (%), observed colour, and scale value. Carry out the test on each of the five dilutions and on U, record the results, and confirm the trend.
Step-by-Step Reasoning
- Headings must be underlined and columns separated by lines, as in (i).
- Results for the dilutions: 0.8% gives the same scale as P1 in (i); 0.4% gives a scale of about half that; 0.2% gives a smaller scale still; 0.1% is barely purple; 0.05% is essentially the blue of the control.
- Trend: scale number decreases as concentration decreases. The relationship is approximately linear over this range.
- U's row: record the same observation as in (i) — typically a small positive scale number consistent with a concentration between 0.2% and 0.4%.
- The marks require at least three concentration rows plus the correct trend; including all five dilutions plus U shows full understanding.
Key Takeaways
- A serial dilution produces a graded colour series that acts as a calibration curve.
- The relationship between protein concentration and Biuret colour intensity is approximately linear over the range tested.
Common Mistakes
- Not underlining the headings or separating the columns (loses the format mark).
- Recording a non-monotonic trend (e.g. a higher scale number at a lower concentration) — this suggests a pipetting error.
- Forgetting to include the concentration column heading, or omitting the unit %.
Things to Be Careful About
- Use a clean pipette for each transfer to avoid cross-contamination between dilutions.
- Mix each tube thoroughly after adding KOH and CuSO₄ before judging the colour.
- The candidate's actual scale numbers will differ from the illustrative values, but the trend must be monotonic decreasing.
Using these additional results from (v) state a more accurate estimate of the concentration of albumin in U.
Answer
The scale number for U matches the scale number for the 0.4% dilution (representative). Therefore the concentration of albumin in U is approximately 0.4%.
In general, find the two dilutions whose scale numbers bracket U's scale number and report a concentration between them (e.g. if U's scale lies between 0.2% and 0.4%, quote a value such as 0.3%).
Approximately 0.4% (representative — the actual value depends on the candidate's readings; the answer must be a value that lies between the two bracketing dilutions).
Background Concept
When you have a graded series of standards of known concentration, you can estimate the concentration of an unknown by finding the two standards whose readings bracket the unknown's reading. If the relationship is approximately linear, you can interpolate to give a value between the two standards.
Understanding the Question
Using the additional results from (v), give a more accurate estimate of the concentration of U than the bound 'less than 0.8%' you gave in (ii). The serial dilution now provides a series of standards that bracket U, allowing interpolation.
Approach
Find the two dilutions whose scale numbers are closest to U's scale number, one above and one below. Quote a concentration between these two values.
Step-by-Step Reasoning
- From (v), U has a scale number of 2 (representative).
- The 0.4% dilution also has a scale number of 2, so U's concentration is approximately 0.4%.
- If U's scale lies between two dilutions (e.g. between the 0.2% and 0.4% dilutions), quote a value between them (e.g. 0.3%) and explain which two dilutions bracket it.
- The estimate must be consistent with the data — it must lie between the two bracketing dilutions.
Key Takeaways
- A calibration series of known standards allows you to estimate an unknown by bracketing or interpolation.
- A more accurate estimate is possible when the unknown is bracketed by closely spaced standards.
Common Mistakes
- Quoting a value that is not bracketed by the standards (e.g. 0.5% when no standard is more concentrated than U between 0.4% and 0.8%).
- Quoting only one of the bracketing values (e.g. '0.4%' without saying it lies between 0.2% and 0.4% or matches 0.4%).
- Failing to update the estimate beyond 'less than 0.8%' from (ii).
Things to Be Careful About
- The estimate depends on the candidate's own scale readings; the answer should be a value that lies between the two bracketing dilutions for those readings.
- The estimate should be quoted to a sensible number of significant figures (typically one or two).
Replicating the investigation would increase the confidence in the accuracy of your estimate.
Describe one other modification which would increase the confidence in your estimate.
Answer
Use a colorimeter (or spectrophotometer) to measure the absorbance of each solution at a suitable wavelength (e.g. around 540 nm for the Biuret purple). This gives an objective numerical reading rather than relying on a subjective visual comparison with a colour scale, increasing the confidence in the accuracy of the estimate.
(Other acceptable modifications include using more replicates at each concentration and calculating a mean, or having a second observer independently score the colours to reduce observer bias.)
Use a colorimeter to measure absorbance objectively.
Background Concept
Visual comparison of colour intensity is subjective: different observers will assign slightly different scale numbers to the same tube, and the same observer may score a tube differently on different occasions. Any measurement that depends on human judgement is a source of random error.
Understanding the Question
The question already mentions replication. You must suggest one other modification that would increase confidence in the accuracy of the estimate. The mark scheme specifically credits 'colorimeter'.
Approach
Identify the main source of error in the procedure (subjective colour matching) and propose a way to replace it with an objective measurement (a colorimeter, which measures absorbance and is independent of the observer).
Step-by-Step Reasoning
- The current method relies on matching the colour of each tube to a printed scale (0–10). This is subjective.
- A colorimeter passes light of a known wavelength through the solution and measures the absorbance, which is proportional to the concentration of the coloured complex.
- Because the absorbance reading is a number produced by the instrument, it is objective and reproducible.
- The estimate of U's concentration can then be based on a calibration curve of absorbance vs concentration, giving greater confidence in the accuracy.
Key Takeaways
- Replacing a subjective judgement with an instrumental measurement increases accuracy and reproducibility.
- A colorimeter is the standard improvement for any colorimetric assay in A-level Biology.
Common Mistakes
- Suggesting 'use more accurate equipment' without naming a specific instrument.
- Suggesting 'repeat the experiment' — the question already mentions replication and asks for one other modification.
- Suggesting vague improvements such as 'be more careful' or 'work in better lighting' — these do not address the subjectivity of the colour match.
Things to Be Careful About
- The answer must be a specific, named modification (the mark scheme credits 'colorimeter' specifically).
You are required to use a sharp pencil for charts.
Scientists have investigated the albumin concentration in the blood plasma of 166 people.
The results are shown in Table 1.1.
Table 1.1
| albumin concentration in blood plasma / g per | frequency / number of people |
|---|---|
| 3.1 – 3.5 | 3 |
| 3.6 – 4.0 | 21 |
| 4.1 – 4.5 | 42 |
| 4.6 – 5.0 | 60 |
| 5.1 – 5.5 | 39 |
| 5.6 – 6.0 | 1 |
Plot a chart of the data in Table 1.1.

Answer
A histogram of the data in Table 1.1:
Key conventions used:
- x-axis: 'albumin concentration in blood plasma / g per ' with the six class intervals marked.
- y-axis: 'frequency / number of people' with a scale of people, labelled at 10, 20, 30, 40, 50 (the origin and 60 are not labelled).
- Six bars of equal width, drawn touching each other (because the variable is continuous), with heights 3, 21, 42, 60, 39, 1 in the order of the table.
- Bars drawn with sharp, ruled lines (use a sharp pencil and a ruler).
Histogram with six touching bars of equal width; x-axis labelled with class intervals and y-axis labelled 'frequency / number of people' scaled at 2 cm = 10 people.
Background Concept
A histogram is the correct chart for displaying the frequency distribution of a continuous variable grouped into class intervals. The bars must touch because the variable is continuous — there are no gaps between adjacent classes. A bar chart, by contrast, is used for discrete categories and has separated bars.
Understanding the Question
You are given a frequency table of albumin concentrations in 166 people, grouped into six class intervals. You must plot a histogram on the provided grid (Chart 1.1) following CIE conventions: sharp pencil, ruled lines, correct axes and scale, and bars in the order of the table.
Approach
Decide which variable goes on which axis. The independent variable (albumin concentration class) goes on the x-axis and the dependent variable (frequency) on the y-axis. Choose a scale that uses at least half the grid in the direction of variation. The data is a frequency distribution, so it must be a histogram with touching bars.
Step-by-Step Reasoning
- x-axis label: 'albumin concentration in blood plasma / g per '. Mark the boundaries of the six class intervals along the axis: 3.1, 3.5, 3.6, 4.0, 4.1, 4.5, 4.6, 5.0, 5.1, 5.5, 5.6, 6.0.
- y-axis label: 'frequency / number of people'. Choose a scale where people. The maximum frequency is 60, so the scale must accommodate 60. Mark the values 10, 20, 30, 40, 50 on the y-axis; do not label the origin or the maximum (60).
- Bars: draw six bars of equal width, each spanning one class interval, with heights equal to the frequencies: 3, 21, 42, 60, 39, 1. The bars must touch because the data is continuous.
- Lines: draw all lines with a sharp pencil and a ruler. The bars should have sharp, ruled vertical and horizontal lines.
- Order: the bars must be plotted in the same order as the table, from left (lowest concentration) to right (highest concentration).
Key Takeaways
- A histogram has touching bars and is used for continuous data grouped into class intervals.
- CIE histograms require a sharp pencil, ruled lines, correct axis labels with units, and a scale that uses at least half the grid.
- The maximum value on the y-axis and the origin do not need to be labelled.
Common Mistakes
- Drawing a bar chart with gaps between the bars — this is incorrect for continuous data and loses a mark.
- Using a non-linear or awkward scale (e.g. 1 cm = 7 people) — the mark scheme requires a simple scale of 2 cm = 10 people.
- Labelling the origin or the maximum (60) on the y-axis — the mark scheme specifically excludes these.
- Plotting the bars in the wrong order.
- Drawing the bars with a blunt pencil or freehand — loses a mark for 'ruled sharp lines'.
- Forgetting the unit on the x-axis label (g per ).
Things to Be Careful About
- The scale must be linear and use at least half the grid in the y-direction.
- The bars must be of equal width and touch each other.
- All six bars must be plotted, including the small ones (3 and 1).
Suggest one reason for the pattern of the results shown in the chart.
Answer
People have different health, sex, age, or metabolism, so their normal blood albumin concentration varies between individuals, producing the spread of results shown in the histogram.
People have different health, sex, age, or metabolism.
Background Concept
Biological variables such as blood albumin concentration vary between individuals in a population because of genetic and environmental differences. The spread of a frequency distribution reflects this inter-individual variation.
Understanding the Question
You must suggest one reason why the 166 people in the study show a range of albumin concentrations rather than a single value. The question asks for a single reason.
Approach
Think about the factors that could cause one person's blood albumin concentration to differ from another's. The mark scheme credits health, sex, age, or metabolism as acceptable reasons.
Step-by-Step Reasoning
- The histogram shows that albumin concentration is distributed across a range from about 3.1 to 6.0 g per , peaking at 4.6–5.0 g per .
- This spread implies genuine biological variation between the 166 individuals.
- Plausible sources of variation include differences in general health (e.g. liver function, kidney function, nutritional status), sex (males and females have slightly different reference ranges), age (albumin levels can change with age), and metabolic rate.
- Any one of these is an acceptable answer.
Key Takeaways
- Biological measurements in a population show variation between individuals.
- Variation can arise from genetic factors, environmental factors, or both.
Common Mistakes
- Giving a non-biological reason such as 'measurement error' — the question asks for a reason for the pattern of results, not for any inaccuracy in measurement.
- Giving more than one reason when only one is asked for.
Things to Be Careful About
- The reason must be biological and explain why different people have different albumin concentrations.
The concentration of albumin in a person’s blood may be measured to identify health problems. One of the reasons for a health problem is that blood albumin has a low solubility in water.
Suggest one health problem which may be caused by an albumin concentration of 5.6–6.0 g per .
Answer
An albumin concentration of 5.6–6.0 g per combined with low solubility of albumin in water may cause albumin to precipitate in the blood or in the kidney tubules (after filtration), leading to:
- slowed blood circulation (if albumin deposits in blood vessels), or
- osmotic imbalance (abnormally high plasma albumin concentration raises the blood's water potential gradient, pulling water out of tissues), or
- kidney problems (precipitation in the kidney tubules causing damage or stones).
Slowed blood circulation, or osmotic problems, or kidney problems.
Background Concept
Albumin is the most abundant protein in blood plasma. It is highly soluble in water under normal conditions and plays a key role in maintaining the blood's water potential (colloid osmotic pressure) and in transporting substances such as fatty acids, hormones and some drugs. If albumin's solubility is reduced, it may come out of solution, and an abnormally high concentration of albumin in the plasma can also disturb the osmotic balance of the blood.
Understanding the Question
The question stem states that a high blood albumin concentration (5.6–6.0 g per ) is associated with low solubility of albumin in water. You must suggest one health problem that could result.
Approach
Think about what happens when a soluble substance is present at a high concentration but has low solubility: it may precipitate. Consider where precipitation could cause a problem (blood vessels, kidney tubules) and what the osmotic consequences of a high plasma albumin concentration are.
Step-by-Step Reasoning
- A plasma albumin concentration of 5.6–6.0 g per is at the upper end of the distribution shown in the histogram, considerably higher than the modal 4.6–5.0 g per .
- If albumin has low solubility, a high concentration may cause it to come out of solution and form deposits.
- Such deposits in blood vessels would slow blood circulation; deposits in the kidney tubules (where plasma is filtered) would cause kidney damage or kidney stones.
- Independently, an abnormally high plasma albumin concentration raises the colloidal osmotic pressure of the blood, drawing water out of the tissues into the plasma and causing osmotic imbalance (oedema, dehydration of tissues).
- The mark scheme credits any of: slowed blood circulation, osmotic problems, or kidney problems.
Key Takeaways
- Albumin's high solubility in water is essential for it to remain in solution in the blood plasma.
- High plasma albumin concentration affects the blood's osmotic balance and, if the albumin precipitates, can damage blood vessels or kidney tubules.
Common Mistakes
- Suggesting a problem caused by low albumin (e.g. oedema from low oncotic pressure) — the question specifies a high concentration of 5.6–6.0 g per .
- Suggesting a generic 'health problem' such as 'feeling unwell' without linking it to the specific biology of albumin solubility.
- Confusing the direction of osmotic flow: high plasma albumin raises blood osmotic pressure and draws water into the blood from tissues.
Things to Be Careful About
- The answer must link the high concentration and low solubility to a specific physiological consequence.
- Any one of the three credited answers is sufficient; you do not need to list all three.
The rest of this paper
1 more questions- Q2Use of the Light Microscope · Presentation of Data and Observations · Manipulation, Measurement and Observation · Analysis, Conclusions and Evaluation20M