Biology 9700/23 — October/November 2014
Cambridge AS Level · AS Level Structured Questions · worked solutions for every part, with the mark scheme
Topics Biological Molecules · Cell Membranes and Transport · Cell Structure · The Mitotic Cell Cycle · Nucleic Acids and Protein Synthesis · (outdated) Ecology · +6 more
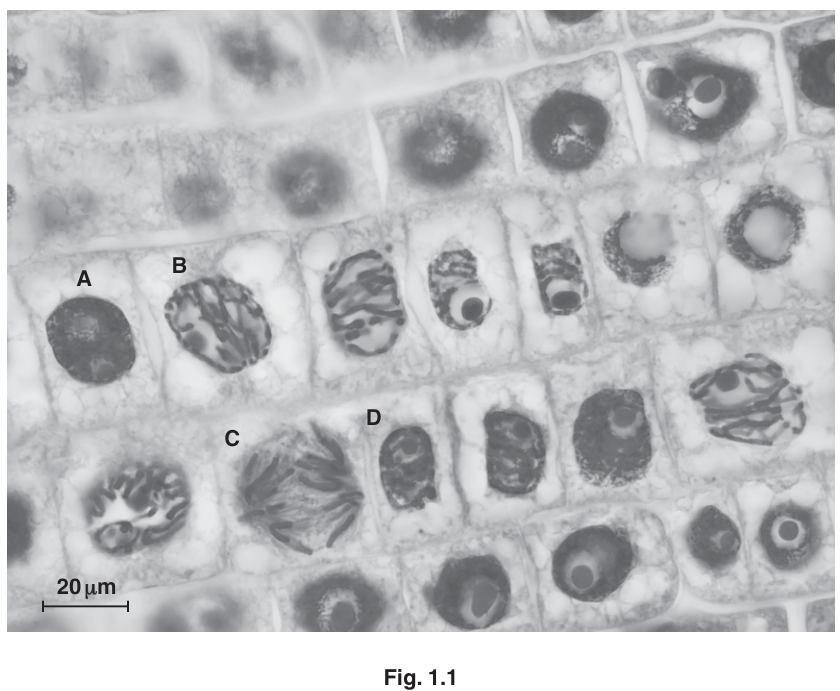
Fig. 1.1 is a photomicrograph of plant root cells near the growing tip. Some of the cells are undergoing mitosis.
State one feature, visible in Fig. 1.1, which indicates that the section is taken from plant tissue and not animal tissue.
Answer
cell wall(s) (the straight, rigid boundary between adjacent cells).
cell wall(s)
Background Concept
Plant and animal cells are both eukaryotic, but they have several distinguishing features visible under a light microscope. Plant cells possess a rigid cell wall made of cellulose outside the cell surface membrane, and a large permanent central vacuole surrounded by the tonoplast. Animal cells lack both. Plant cells also tend to be more regular in shape, often rectangular, because the cellulose cell wall enforces a defined geometry, whereas animal cells in a tissue section are typically more rounded or irregular.
Understanding the Question
You are given a photomicrograph of cells from a plant root tip and asked to identify ONE feature, visible in the figure, that proves the tissue is plant rather than animal. The answer must be something you can actually see in the image — not a general claim about a plant cell you cannot observe.
Approach
Scan the image for the hallmark features of plant cells: distinct cell walls between adjacent cells, large pale central vacuoles, and the rectangular/regular outline imposed by cellulose walls. Pick the single most obvious and diagnostic feature.
Step-by-Step Reasoning
In Fig. 1.1 the most obvious feature is the clearly defined straight boundaries between adjacent cells forming a regular grid. These are the cellulose cell walls, and they are entirely absent in animal tissue. Some cells also show a large pale region in the centre (the central vacuole), and the cells themselves are roughly rectangular rather than rounded. Any of these earns a mark, but the cell wall is the most diagnostic single feature.
Key Takeaways
Plant cells in a micrograph are identified by cellulose cell walls, large central vacuoles and a regular, often rectangular shape.
Common Mistakes
- Saying "chloroplasts" — roots are not photosynthetic, so chloroplasts are not present and not visible. The mark scheme does not accept this.
- Saying "no centrioles" — centrioles are sub-microscopic and cannot be seen with a light microscope, so this is not a feature visible in the figure.
- Saying "thicker cell walls" alone — the mark scheme ignores "thicker" as in "thicker cell walls"; the credit is for "cell wall".
Things to Be Careful About
Pick ONE feature, not a list. The command word "state" usually wants a single brief answer. Make sure the feature is genuinely visible in the figure.
State the letter, A to D, of the cell in Fig. 1.1 which is in:
prophase ______
Answer
B
B
Background Concept
During mitosis the chromosomes go through a sequence of morphological changes. In prophase the diffuse chromatin condenses into visible chromosome threads, each consisting of two sister chromatids joined at a centromere. The nuclear envelope is still largely intact at this stage. By metaphase the chromosomes are aligned on the equator; in anaphase the sister chromatids separate and move to opposite poles; in telophase the nuclear envelope reforms around the two sets of chromosomes.
Understanding the Question
You are given four labelled cells (A, B, C, D) at different stages of the cell cycle and asked to identify which one is in prophase. The answer is a single letter.
Approach
Match the cell's appearance to the diagnostic features of prophase: condensing chromosome threads visible inside an area that still resembles a nuclear boundary, with no clear equatorial alignment or separation into two groups.
Step-by-Step Reasoning
Cell A has a large, uniformly dark, round nucleus with no individual chromosomes visible — this is interphase (chromatin is dispersed, not condensed). Cell B shows condensing thread-like chromosomes within a region that still resembles a nucleus — this matches prophase. Cells C and D show further progression of mitosis. The mark scheme confirms B as prophase.
Key Takeaways
Prophase is recognised in a micrograph by condensing chromosome threads becoming visible inside a still-intact nuclear area, before any equatorial alignment or chromatid separation.
Common Mistakes
- Confusing prophase (B) with interphase (A). A common error is to pick A because it looks like a "rounded up" cell with a prominent dark area, but the absence of visible discrete chromosome threads means it is interphase, not prophase.
- Confusing prophase with later stages where chromosomes are more condensed and clearly separated.
Things to Be Careful About
The diagnostic feature is the presence of visible individual chromosome threads/strands within a still-defined nuclear area, not simply "something dark" in the cell.
anaphase. ______
Answer
C
C
Background Concept
In anaphase, the paired sister chromatids of each chromosome separate at the centromere and are pulled to opposite poles of the cell by the shortening spindle fibres. The cell at this stage shows chromosomes arranged in two distinct groups, migrating away from the cell's equator.
Understanding the Question
You are given four labelled cells and asked to identify which one is in anaphase. The answer is a single letter.
Approach
Look for the cell whose chromosomes are clearly split into two separating groups rather than arranged in a single equatorial line (metaphase) or condensed within an intact nuclear area (prophase).
Step-by-Step Reasoning
In cell C, the chromosomes appear as elongated, rod-like structures that are migrating apart, with two groups becoming evident on either side. This is the appearance of anaphase, when sister chromatids are being pulled to opposite poles. The mark scheme accepts C as anaphase.
Key Takeaways
Anaphase is recognised in a micrograph by chromosomes split into two separating groups rather than a single equatorial plate or a contained prophase nucleus.
Common Mistakes
- Choosing the cell whose chromosomes lie on a single line across the middle — that is metaphase, not anaphase.
- Confusing anaphase with telophase, where two daughter nuclei are starting to reform.
Things to Be Careful About
The key event is the splitting of sister chromatids and their migration apart. A single snapshot of anaphase shows two groups of chromosomes, not yet two separate daughter cells.
Describe two events occurring in cell B.
-
______
-
______
Answer
- The chromosomes (chromatin) condense / coil up / thicken, so that they become visible as discrete threads inside the nucleus.
- The nuclear envelope breaks down (disintegrates), allowing the spindle microtubules to access the chromosomes.
See working
Background Concept
Prophase is the first stage of mitosis. The major events are: (1) the diffuse chromatin condenses into discrete, visible chromosomes, each with two sister chromatids joined at the centromere; (2) the nucleolus disappears; (3) the nuclear envelope (membrane) breaks down; (4) the spindle forms from microtubules, with poles at opposite ends of the cell preparing to capture the chromosomes.
Understanding the Question
You are asked to describe two events occurring in cell B, which is in prophase. The mark scheme awards one mark per event, so two events are needed.
Approach
Pick the two most clearly visible or fundamental events of prophase and describe each with the correct biological term. The mark scheme accepts four events — chromosome/chromatin condensation, spindle formation, nucleolus disappearance, and nuclear envelope breakdown — and any two of these earn full marks.
Step-by-Step Reasoning
- Chromosomes condense. The diffuse chromatin in the nucleus coils up and thickens, so that discrete chromosome structures (each composed of two sister chromatids) become visible. This is what creates the thread-like appearance in the micrograph during prophase.
- The nuclear envelope breaks down. The double membrane surrounding the nucleus disintegrates, so that the spindle microtubules forming in the cytoplasm can reach and attach to the chromosomes at their centromeres.
(Alternative acceptable points: spindle fibres form from microtubules, with poles at opposite ends of the cell; the nucleolus disappears.)
Key Takeaways
Prophase prepares the cell for the alignment of chromosomes on the metaphase plate by (i) making the chromosomes visible as discrete structures, (ii) removing the nuclear barrier, and (iii) assembling the spindle that will move them.
Common Mistakes
- Saying "the chromosomes appear" without saying HOW — the mark scheme requires the idea of condensation / coiling up.
- Mentioning centrioles or centromeres. The mark scheme explicitly ignores these as they are not listed events of prophase.
- Confusing prophase events with those of interphase, where DNA replication occurs (S phase), not chromosome condensation.
Things to Be Careful About
Two events = two marks. Do not repeat the same idea in two different ways; the mark scheme gives credit only once per distinct event.
Describe the role of mitosis in a growing plant root tip.
Answer
- Mitosis produces (more) genetically identical daughter cells, increasing the cell number so that the root tip can grow.
- The daughter cells have the same number and type of chromosomes as the parent cell, and they can differentiate into the different tissues of the root, e.g. xylem, phloem, root hair cells and epidermis.
See working
Background Concept
Mitosis is the division of a cell that produces two genetically identical daughter nuclei, each with the same number of chromosomes as the parent cell. In a multicellular organism it serves three main purposes: growth (more cells), repair or replacement of damaged cells, and asexual reproduction (in some organisms). In plants specifically, the root tip contains an apical meristem — a region of rapid cell division that supplies all the new cells needed for the root to grow and to differentiate into the various tissues (epidermis, root hairs, cortex, xylem, phloem).
Understanding the Question
You are asked to describe the role of mitosis in a growing plant root tip. The mark scheme allows two marks, so two clear points are needed.
Approach
Think of what mitosis actually does — increase cell number, keep the chromosome complement the same (and the genetic material identical), and supply cells that can differentiate or replace damaged ones. Choose the two strongest points and express each with the correct biological term.
Step-by-Step Reasoning
- Mitosis produces more cells. As cells in the apical meristem divide, the cell number rises, allowing the root to grow in length and the tissue to expand. Each daughter cell is genetically identical to the parent and has the same number and type of chromosomes, so the diploid chromosome number is preserved.
- Mitosis provides new cells that can differentiate into the various tissues of the root, e.g. xylem, phloem, root hair cells, epidermis. It also replaces any cells damaged at the tip as the root pushes through the soil.
Key Takeaways
In a root tip, mitosis drives growth, maintains the chromosome complement, and supplies cells that differentiate into the range of root tissues (and replaces any that are damaged).
Common Mistakes
- Vague answers like "it makes new cells" without saying why (growth, replacement, differentiation).
- Mentioning "elongation" of cells — the mark scheme ignores this because elongation is a separate process driven by vacuolar expansion, not by mitosis itself.
- Saying "it makes a set of chromosomes" — the mark scheme ignores "set of chromosomes"; the credit is for "same number / type of chromosomes".
Things to Be Careful About
Be specific: if you mention differentiation, name one or two tissues (xylem, phloem, root hair, epidermis) as examples. Avoid "elongation" as a role of mitosis.
Mutations can sometimes occur in cells which are rapidly dividing.
Outline how a mutation can cause an altered polypeptide to be produced.
Answer
- A change in the base (nucleotide) sequence of the DNA — for example a substitution, deletion or insertion of bases — alters the codons (triplets) on the mRNA when the gene is transcribed.
- Because each codon codes for a specific amino acid, a different codon recruits a different tRNA, and a different amino acid is incorporated into the polypeptide. The amino acid sequence (primary structure) of the polypeptide is therefore altered.
See working
Background Concept
A gene mutation is a change in the base/nucleotide sequence of a DNA molecule. The main types are: substitution (one base replaced by another), deletion (one or more bases lost), insertion (one or more bases added), and inversion (a segment reversed). The genetic code is read in non-overlapping groups of three bases (codons); a deletion or insertion that is not a multiple of three causes a frameshift, in which every downstream codon is read in a different frame. The mRNA is transcribed from the template strand of DNA, and each codon on the mRNA corresponds (via tRNA and the ribosome) to one amino acid in the polypeptide.
Understanding the Question
You are asked to outline how a mutation can cause an altered polypeptide to be produced. The mark scheme awards up to two marks, one for each link in the chain from DNA to protein.
Approach
Trace the chain in the right order: change in DNA base sequence → change in mRNA codon(s) → different amino acid incorporated → altered polypeptide. State any two links clearly and use the precise biological terms.
Step-by-Step Reasoning
- A change in the base (nucleotide) sequence of the DNA — for example, a substitution, deletion or insertion of bases — alters the sequence of codons (triplets) carried on the mRNA when the gene is transcribed.
- Because each codon codes for a specific amino acid (or a stop signal), a different codon recruits a different tRNA, and a different amino acid is incorporated into the polypeptide. The amino acid sequence (primary structure) of the polypeptide is therefore different from the original. In the case of a frameshift caused by a deletion or insertion that is not a multiple of three, every amino acid downstream is also changed, which can drastically alter the polypeptide.
Key Takeaways
Mutation → DNA base change → mRNA codon change → different amino acid → altered polypeptide. This is the central dogma in action and the basis of how mutations produce phenotypic effects.
Common Mistakes
- Saying the mutation "changes the protein" without specifying HOW — the mark scheme requires the link through the codon and amino acid sequence.
- Saying "the gene is changed" without mentioning the base/nucleotide sequence.
- Stopping at "DNA change" without continuing to the polypeptide.
- Confusing transcription with translation — codons are on mRNA, but the underlying change is in the DNA.
Things to Be Careful About
Use the precise terms "base / nucleotide sequence", "codon / triplet" and "amino acid sequence / primary structure". The mark scheme rejects vague paraphrases.
Calculate the magnification of Fig. 1.1.
Show your working and give your answer to the nearest whole number.
magnification ______
Working
- Measure the scale bar on the printed figure with a ruler: e.g. .
- Convert to the same units as the actual size: .
- Apply the formula:
(Any measured length of – giving a magnification of – is accepted.)
Answer
magnification 750
×750
Background Concept
Magnification is the number of times an image has been enlarged compared to the real specimen. It is calculated as:
A scale bar printed on a micrograph represents a known actual length. By measuring the scale bar on the page (the image size) and dividing by its stated actual length, you obtain the magnification of the printed figure. Both quantities must be in the same units before dividing.
Understanding the Question
You are given Fig. 1.1 with a scale bar labelled and asked to calculate the magnification of the figure. You must measure the scale bar on the page, convert to the same units as the actual length, and divide. The mark scheme accepts a measured length of – (i.e. any answer in the range –).
Approach
- Measure the length of the scale bar on the printed figure using a ruler, in millimetres.
- Convert that measurement to micrometres ().
- Apply the formula: magnification = image size / actual size.
- Round to the nearest whole number, as the question requests.
Step-by-Step Reasoning
Using a representative measured length of :
- Image size .
- Actual size (from the scale bar label) .
- Magnification .
So the magnification is approximately . Any value in the range – (corresponding to a – measurement) is accepted by the mark scheme. If you measured the bar in but forgot to convert to (giving ), the mark scheme still awards one mark for the correct measurement and correct formula — but the unit conversion must be present for the second mark.
Key Takeaways
Magnification = image size / actual size. Always convert to the same units (commonly and , where ). Read the scale bar directly from the figure as the actual-size reference, then round to an appropriate number of significant figures.
Common Mistakes
- Forgetting to convert to . The mark scheme gives one mark for a correct measurement and correct formula even if the conversion is missed, but you lose the final mark.
- Dividing the actual size by the image size (the wrong way round).
- Using the wrong value from the scale bar, or omitting units in the working.
- Reporting the answer to too few or too many significant figures (the question explicitly asks for the nearest whole number).
Things to Be Careful About
A common error is using the wrong formula direction. The figure has been magnified FROM the actual specimen TO the printed image, so image size > actual size, and the magnification should be a number greater than 1. A magnification less than 1 would mean the image had been reduced, which is wrong here.
The rest of this paper
5 more questions- Q2(outdated) Ecology · Biological Molecules14M
- Q3Immunity · Infectious Diseases · Cell Membranes and Transport · Biological Molecules11M
- Q4Enzymes · Cell Membranes and Transport12M
- Q5Gas Exchange · Transport in Mammals7M
- Q6Transport in Plants5M