Biology 9700/34 — May/June 2014
Cambridge AS Level · Advanced Practical Skills · worked solutions for every part, with the mark scheme
Topics Analysis, Conclusions and Evaluation · Manipulation, Measurement and Observation · Presentation of Data and Observations · Use of the Light Microscope
Many plant cells contain a water soluble molecule called ascorbic acid, which has many functions to help the plant survive.
You are provided with an extract from plant cells, P, which contains ascorbic acid.
Visking tubing, V, is selectively permeable, similar to a cell surface membrane, so that some biological molecules will diffuse through the wall of the tubing.
You are required to investigate the diffusion of ascorbic acid from P into the water surrounding the Visking tubing over a period of 15 minutes.
Fig. 1.1 shows the apparatus before the water was added.
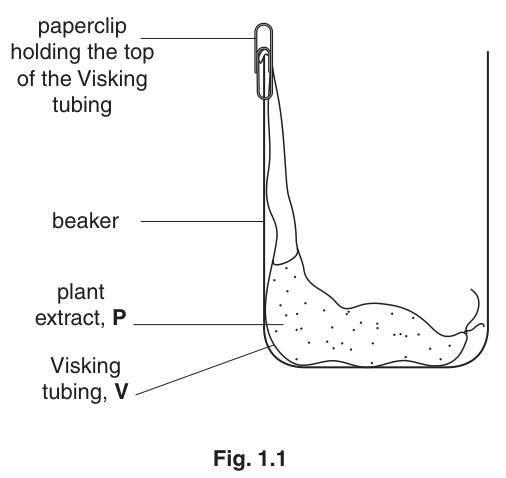
Water is added to the beaker in Fig. 1.1.
Describe the expected trend in the concentration of ascorbic acid in the water over a period of 15 minutes.
Answer
The concentration of ascorbic acid in the water will increase (over the 15 minutes).
Increase (in concentration of ascorbic acid in the water over 15 minutes).
Background Concept
Visking tubing has a partially permeable (selectively permeable) wall: it behaves like a cell surface membrane, allowing small molecules (such as water and dissolved solutes of small molecular size) to pass through, while larger molecules are retained. Ascorbic acid is a small, water-soluble molecule, so it is able to diffuse through the membrane of the Visking tubing.
Diffusion is the net movement of molecules from a region of higher concentration to a region of lower concentration, down a concentration gradient, until the molecules are evenly distributed. The rate of diffusion depends on the steepness of the gradient, the surface area available, the size of the molecule and the temperature.
Understanding the Question
Part (a)(i) asks you to predict what will happen to the concentration of ascorbic acid in the water outside the Visking tubing over a 15-minute period, once the apparatus in Fig. 1.1 is filled with water. Inside the tubing is plant extract P, which is rich in ascorbic acid; outside the tubing is initially pure water. The command word "describe the expected trend" only requires you to state the direction of change, not the mechanism.
Approach
Apply the principle of diffusion through a partially permeable membrane. At the start, ascorbic acid concentration is high inside the tubing and zero in the surrounding water. Therefore the net movement of ascorbic acid is from inside the tubing, through the membrane, into the water. Over time the ascorbic acid accumulates in the water, so its concentration in the water rises.
Step-by-Step Reasoning
- Inside the Visking tubing, P contains a high concentration of ascorbic acid.
- The water added to the beaker initially contains no ascorbic acid.
- Because the Visking tubing is selectively permeable, ascorbic acid molecules are able to pass through its wall, but the larger molecules in the extract are not.
- Ascorbic acid diffuses from high concentration (inside) to low concentration (outside), down its concentration gradient.
- With each minute that passes, more ascorbic acid passes into the water, so the concentration of ascorbic acid in the water rises.
- The net rate of diffusion slows as the gradient becomes less steep, but the concentration still increases over the 15-minute period — the trend is an increase.
Key Takeaways
- Diffusion through a partially permeable membrane moves solutes down a concentration gradient.
- The "trend" demanded by (a)(i) is simply the direction of change of concentration over time, not an explanation of the molecular mechanism.
Common Mistakes
- Saying "it will become constant" or "it will decrease": without knowing exactly when equilibrium is reached, the safest prediction is simply that the concentration increases over the time period investigated.
- Confusing the direction of movement: ascorbic acid moves from P (inside) to the water (outside), not the other way around.
Things to Be Careful About
- One mark only: state the trend, do not write a paragraph. "Increase" (or equivalent wording such as "rises", "goes up") is the entire requirement.
You are provided with:
| labelled | contents | hazard | volume / |
|---|---|---|---|
| A | sample of water removed after 15 minutes | irritant | 15 |
| P | plant extract containing ascorbic acid | irritant | 15 |
| W | distilled water | none | 100 |
| I | iodine in potassium iodide solution | irritant | 20 |
| S | starch | none | 20 |
| labelled | details |
|---|---|
| V | length of Visking tubing in a beaker containing water |
You must now read up to the end of step 23 before proceeding.
To compare the concentration of ascorbic acid in the samples you are required to find the volume of iodine solution, I, added to each sample until the end-point is reached.
The drops of I will be added one at a time using a small syringe.
To practise releasing drops from a small syringe:
- Fill the syringe with of I.
- Hold the syringe over an empty test-tube and push the plunger gently to release one drop at a time, as shown in Fig. 1.2.
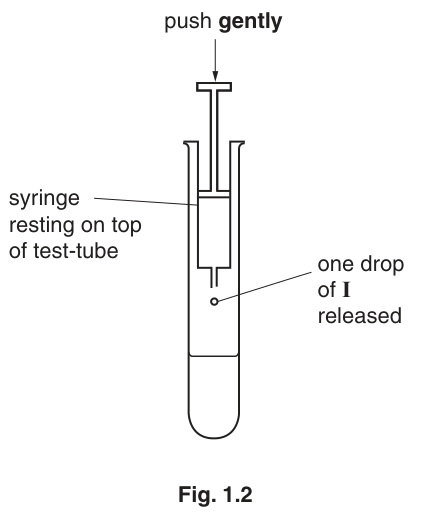
To compare the concentration of ascorbic acid in the samples you will need to add drops of I until a blue colour appears. When this blue colour lasts for more than 10 seconds, this is the end-point and the volume of I that has been added should be recorded.
The apparatus in Fig. 1.1 was set-up and water was added and left for 15 minutes.
Sample A was removed from the water in the beaker.
You are required to find the volume of I needed to reach the end-point for sample A.
Proceed as follows:
3. Put of S into a test-tube.
4. Put of the sample (e.g. A) into the same test-tube.
5. Shake the test-tube gently to mix the contents.
6. Fill the syringe, labelled I, with of I.
7. Wipe off any drops of I from the outside of the syringe with a paper towel.
8. Add one drop of I to the mixture in the test-tube as shown in Fig. 1.2.
9. Mix gently and if there is no colour change add another drop.
10. Continue adding drops, one at a time, until the blue colour appears.
Wait 10 seconds to see if the end-point has been reached. If the blue colour disappears then add another drop.
11. Repeat step 10 until the mixture stays blue for at least 10 seconds.
Record the volume of I needed to reach the end-point.
volume = ______
Answer
volume = 0.6 (representative result; the actual value will depend on the candidate's own measurement and is typically between 0.2 and 1.0 )
The technique is:
- 1 starch (S) + 3 sample A mixed in a test-tube.
- Add iodine solution (I) one drop at a time, mixing between drops, until a blue colour appears that persists for at least 10 seconds.
- Read the volume of I used off the syringe and record.
Representative value: 0.6 cm³ (student-dependent).
Background Concept
Iodine in potassium iodide solution reacts with starch to form a blue-black complex. If, however, an excess of a reducing agent such as ascorbic acid is present, the iodine is reduced back to iodide (colourless) and the blue colour cannot form. The volume of iodine that must be added before the blue colour persists is therefore proportional to the amount of ascorbic acid present — the more ascorbic acid, the more iodine is needed.
The "end-point" of this titration is the first appearance of a blue colour that does not fade within 10 seconds: this means that all the ascorbic acid has been oxidised and the next drop of iodine is free to react with the starch.
Understanding the Question
You have a sample of water (sample A) that has been in contact with the Visking tubing containing extract P for 15 minutes. The task is to find how much iodine is required to reach the end-point. Because the end-point is observed by eye, this is a student-dependent measurement, but the mark scheme credits any sensible reading with the correct unit.
Approach
- Add the starch and the sample together in fixed volumes (1 cm³ of starch and 3 cm³ of sample, as in steps 3–5).
- Titrate the mixture drop by drop with iodine from a small syringe.
- The end-point is a blue colour that persists for at least 10 seconds.
- Record the volume of iodine used.
Step-by-Step Reasoning
- Put 1 cm³ of starch (S) into a clean test-tube.
- Add 3 cm³ of sample A (the water from outside the Visking tubing after 15 minutes).
- Mix gently so the starch and water are evenly combined.
- Fill the syringe labelled I with 2 cm³ of iodine solution and wipe the outside dry.
- Hold the syringe over the test-tube and add one drop at a time, mixing after each drop.
- After each drop, wait 10 seconds. If the blue colour fades, add another drop.
- The end-point is the volume at which the blue colour first persists for 10 seconds.
- Read the volume of iodine used off the syringe and record it. (Because the actual reading depends on the individual drop size and the actual ascorbic acid concentration, any reasonable value such as 0.6 cm³ with the unit cm³ would be credited.)
Key Takeaways
- The volume of iodine is a proxy for the concentration of ascorbic acid in the sample.
- A 10-second persistence rule removes ambiguity from the subjective end-point.
- The technique must be repeatable: standardised volumes of starch and sample, gentle mixing, dropwise addition.
Common Mistakes
- Recording the value without units — a number alone is insufficient.
- Stopping as soon as a blue colour appears, even if it fades immediately — this is not the end-point.
- Forgetting to mix between drops: a localised blue colour can give a false end-point.
Things to Be Careful About
- The reading is a single value from a single syringe, so it is student-dependent. The mark is for providing any volume with the correct unit (cm³). A representative value consistent with the method (e.g. 0.6 cm³) earns full credit.
You are required to:
- set up Visking tubing containing P as in Fig. 1.3
- decide the level of water to put into the beaker
- remove samples of the water surrounding the Visking tubing at 5 minute intervals for 15 minutes
- compare the ascorbic acid concentrations in the samples.
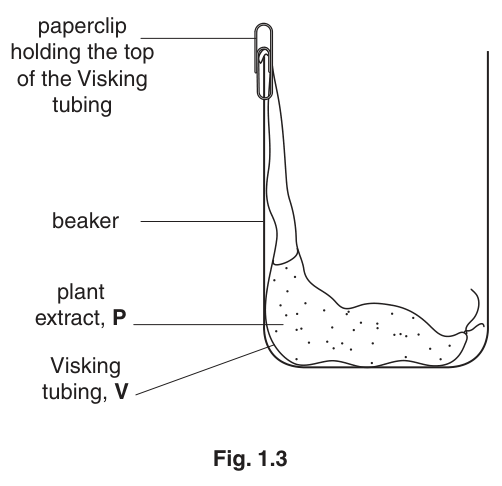
Samples of water surrounding the Visking tubing will be removed for testing, so you need to take this into account when you decide the level of water to put into the beaker.
Draw on Fig. 1.3 the level of the water:
- before you remove any samples (label 'before'),
- after the total volume of water needed for all the tests has been removed (label 'after').
Answer
Four samples of 3 each must be removed (one at 0 min and one at each of 5, 10 and 15 min) — a total of 12 .
Draw on Fig. 1.3:
- A line near the top of the beaker labelled "before" — high enough to allow 12 of water to be removed while still leaving the plant extract P and the Visking tubing covered.
- A second line lower down (12 below the first) labelled "after" — still above the plant extract inside the Visking tubing.
Two horizontal lines drawn on Fig. 1.3: 'before' near the top of the beaker and 'after' lower down, with 'after' still above the plant extract P inside the Visking tubing.
Background Concept
When sampling from a reservoir, the volume of the reservoir decreases with each sample. The investigator must start with enough liquid that (a) all required samples can be removed and (b) the specimen (here, the Visking tubing and its contents) remains fully immersed throughout the experiment. For the ascorbic acid to diffuse effectively, the Visking tubing containing P must always be in contact with the surrounding water.
Understanding the Question
The question asks you to mark two water levels on Fig. 1.3: the level before any samples are removed ("before") and the level after the last sample is removed ("after"). The candidate has to think ahead about how much water will be needed for the four tests (one at each of 0, 5, 10 and 15 minutes) and choose a starting level that allows all four samples to be taken without exposing the Visking tubing.
Approach
- Work out the total volume of water to be removed: 4 samples × 3 = 12 .
- Choose a starting water level that covers the Visking tubing comfortably and is at least 12 above the level that would expose the plant extract.
- Mark the "after" level exactly 12 (in the beaker's volume terms) below the "before" level, but still above the plant extract.
Step-by-Step Reasoning
- The plan requires four samples of 3 each (one immediately after adding water and one at each 5-minute interval up to 15 min) → 4 × 3 = 12 of water must be removed in total.
- The Visking tubing, including the plant extract P, is positioned in the lower part of the beaker (see Fig. 1.3). The water level must always cover P; if the level drops below it, the diffusion of ascorbic acid from P will be affected.
- The "before" line should be drawn high in the beaker (about 2–3 cm below the rim, where the paperclip holds the tubing) so that there is a generous volume of water available.
- The "after" line should be drawn 12 below the "before" line, calculated by eye against the beaker's width (a 250 beaker, for example, is ~6 cm in diameter, so 12 corresponds to roughly 0.4 cm of depth — but the exact depth is judged by eye on the diagram).
- The "after" line must still lie above the level of the plant extract inside the Visking tubing; otherwise the experiment cannot be carried out.
Key Takeaways
- Always think ahead about how much of a solution will be removed before starting an experiment.
- The specimen must remain immersed for the duration of the experiment.
- The two lines mark a calculated difference, not an arbitrary one.
Common Mistakes
- Drawing both lines at the same level — "after" must be lower than "before" because water has been removed.
- Drawing the "after" line below the plant extract, which would prevent the experiment from working.
- Forgetting to label the lines with the words "before" and "after".
Things to Be Careful About
- The mark scheme requires two correct features: (1) two lines clearly labelled "before" and "after" with the after level below the before level, and (2) the after level still covering the Visking tubing contents. The drawing is done on Fig. 1.3 directly.
In order to compare the ascorbic acid concentrations, state one variable which you will need to standardise when finding the volume of I added to each sample.
Describe how you will standardise this variable.
variable = ______
description = ______
Answer
variable = volume of sample (or volume of starch)
description = use the same volume of sample (e.g. 3 ) in every test; OR use the same volume of starch (1 ) in every test.
Variable: volume of sample (or volume of starch). Standardise by using the same volume in every test (e.g. 3 cm³ of sample and 1 cm³ of starch).
Background Concept
In a comparison, the only thing that should vary is the independent variable (here, the time at which the sample was taken, and therefore the ascorbic acid concentration). Everything else that could affect the end-point must be kept constant — the volume of sample, the volume of starch, the temperature, the size of the drops from the syringe and so on. If a controlled variable changes, the comparison is no longer fair.
Understanding the Question
You will be testing four different samples (taken at 0, 5, 10 and 15 min) by the same procedure. The mark scheme requires you to name one variable that must be the same in every test and to describe how to standardise it. One mark is for the variable, the description is part of the same mark.
Approach
- Think about what is added to each test-tube: 1 of starch and 3 of sample. The simplest controlled variables are therefore the volumes of these two reagents.
- Describe how to keep that variable the same in every test.
Step-by-Step Reasoning
- The comparison is between four samples, all titrated against iodine using the same procedure.
- The end-point depends on the ratio of starch to ascorbic acid to iodine, so the volumes of starch and sample must be identical in every test.
- The most obvious choice is the volume of sample: 3 of each sample in every test-tube (use the same measuring cylinder or pipette).
- Equally credit-worthy is the volume of starch: 1 of starch suspension in every test-tube.
- State the variable and how to keep it constant: e.g. "variable: volume of sample; description: use 3 of each sample".
Key Takeaways
- A controlled (standardised) variable is a factor that is kept the same so that it cannot be the cause of any difference observed.
- The single best answer in this experiment is the volume of sample (or starch) used in each test.
Common Mistakes
- Choosing a variable that is not actually a factor in the comparison (e.g. the size of the beaker, the concentration of the original plant extract).
- Stating the variable without saying how to standardise it.
- Saying "amount" instead of "volume" — the mark scheme wording is specific.
Things to Be Careful About
- One variable, one description, one mark. The candidate must name what is being kept the same AND say how.
Proceed as follows:
12. Put S, as in step 3, into the four test-tubes you will require in order to test the samples of water.
13. Tie a knot in the Visking tubing as close as possible to one end so that it seals the end.
14. To open the other end, wet the Visking tubing and rub the tubing gently between your fingers.
15. Put of P into the open end of the Visking tubing.
16. Rinse the outside of the Visking tubing by dipping it into the water in the container labelled V.
17. Put the Visking tubing into an empty beaker as shown in Fig. 1.3.
18. Make sure the open end of the Visking tubing is held in place by a paperclip.
You will start timing as soon as you add W (steps 19 and 20).
You should read steps 19 to 23 before proceeding.
19. Put W into the beaker to the level you decided in (iii).
20. Immediately start timing and remove the first sample of water (as in step 4) and put into a prepared test-tube (as in step 12).
21. Test the sample as in steps 5 to 11.
22. After 5 minutes, gently mix the water surrounding the Visking tubing and then remove the next sample, put it into a different (prepared) test-tube and repeat steps 5 to 11.
23. Repeat step 22 for two more samples.
Prepare the space below and record your results.
Answer
Representative results table (student-dependent values):
| time / min | volume of iodine / |
|---|---|
| 0 | 0.0 |
| 5 | 0.2 |
| 10 | 0.4 |
| 15 | 0.6 |
Required features (per mark scheme):
- Columns separated by a line and headings underlined.
- Headings: time / min(utes) and volume of iodine (or I) / (or mL).
- Results recorded at the four times 0, 5, 10 and 15 min.
- The 5-min value is lower than the 10-min and 15-min values (an increasing trend overall).
- All volume values to one decimal place.
Representative table (see markdown). Trend: volume of iodine increases with time (0 < 5 < 10 < 15 min).
Background Concept
A results table must be drawn before any measurements are made, so that the candidate is not tempted to discard "unexpected" results. A good table has a clear heading for every column (quantity with unit), with the unit in accepted form and consistent decimal places down each column. The independent variable (time) goes in the left-hand column and the dependent variable (volume of iodine) in the next column.
Understanding the Question
The candidate must prepare a results table in the space provided, then carry out the practical procedure (steps 12–23) and record the volume of iodine needed to reach the end-point for each of the four samples (0, 5, 10 and 15 min). The mark scheme rewards both the conventions of the table and the trend in the recorded values.
Approach
- Draw the table first: two columns separated by a line, both headings underlined, with time/min on the left and volume of iodine (or I) / on the right.
- Record the four readings, each to one decimal place, as the experiment proceeds.
- Ensure the trend matches the prediction in (a)(i): the concentration of ascorbic acid (and therefore the volume of iodine) should increase with time.
Step-by-Step Reasoning
- The independent variable is time, with four levels: 0, 5, 10 and 15 min. The dependent variable is the volume of iodine solution needed to reach the end-point.
- Draw the table with these two columns, separated by a vertical line, and underline each heading.
- Each heading must include a quantity and a unit: "time / min" (or "time / minutes") and "volume of iodine / " (or "volume of I / " or "/ mL").
- As each sample is tested, record the volume of iodine to one decimal place.
- The trend should match (a)(i): volume of iodine should be smallest at 0 min and largest at 15 min, with 5 min lower than 10 min and 10 min lower than 15 min.
- Representative values consistent with the trend: 0 min → 0.0 ; 5 min → 0.2 ; 10 min → 0.4 ; 15 min → 0.6 . The actual numerical values are student-dependent but must follow the increasing pattern.
Key Takeaways
- Tables have conventions: ruled columns, underlined headings, quantity + unit, consistent decimal places.
- The trend in the data is the substance of the answer; the table is the way it is communicated.
- The volume of iodine is a proxy for the ascorbic acid concentration, so an increasing volume means an increasing ascorbic acid concentration.
Common Mistakes
- Missing the column rule or underlining.
- Forgetting the unit on one of the headings (e.g. just "time" or just "volume").
- Recording inconsistent decimal places (e.g. mixing whole numbers and one-decimal-place values).
- Recording the 5-min value equal to or higher than the 10-min value, breaking the required trend.
Things to Be Careful About
- The mark scheme requires five separate points; the candidate should check each one before moving on.
Describe how the results support your expected trend as stated in (a)(i).
Answer
The volume of iodine required to reach the end-point increased with time, which means the ascorbic acid concentration in the water increased with time. This matches the expected trend stated in (a)(i) — the concentration of ascorbic acid in the water increases over the 15 minutes.
The results show the volume of iodine (and therefore the ascorbic acid concentration) increases with time, supporting the prediction in (a)(i).
Background Concept
Iodine solution is decolourised by ascorbic acid — the more ascorbic acid present, the more iodine must be added before the blue colour with starch persists. The volume of iodine required to reach the end-point is therefore a direct measure of the ascorbic acid concentration in the sample.
Understanding the Question
The question asks the candidate to look at their own results table and check whether the trend in the recorded data agrees with the prediction made in (a)(i) (that the concentration of ascorbic acid in the water increases over 15 minutes). The mark is for stating that the two agree, and explaining briefly why.
Approach
- Recall the prediction from (a)(i): the ascorbic acid concentration in the water increases over 15 minutes.
- Look at the table: does the volume of iodine increase from 0 min to 15 min?
- If yes, the results support the prediction.
- The reason: a larger volume of iodine is required because more ascorbic acid has diffused out of the Visking tubing.
Step-by-Step Reasoning
- The dependent variable in the experiment is the volume of iodine needed to reach the end-point.
- A larger volume of iodine means more ascorbic acid in the sample (because more iodine is consumed by the ascorbic acid before any is left over to react with the starch).
- Looking at the table, the volume of iodine increases from 0 min (smallest) to 15 min (largest).
- Therefore the ascorbic acid concentration in the water is increasing with time, which is exactly the trend predicted in (a)(i).
- The results and the prediction agree.
Key Takeaways
- The volume of iodine is a proxy for ascorbic acid concentration.
- A confirmation in this question is a one-sentence statement that the observed data and the predicted trend match.
Common Mistakes
- Restating (a)(i) without linking it to the recorded data.
- Saying "the results support the trend" without saying what the trend in the data is (volume of iodine increases).
Things to Be Careful About
- One mark: a single sentence that explicitly connects the observed data to the prediction in (a)(i).
If you had been provided with 1.0% ascorbic acid solution, suggest how you would modify this investigation to find the percentage concentration of ascorbic acid in the water after 15 minutes.
Answer
- Prepare a serial (or simple) dilution of the 1.0% ascorbic acid solution to give a range of known concentrations (e.g. 1.0%, 0.5%, 0.25%, 0.125% …).
- Test each standard solution in the same way as the water sample (1 starch + 3 of the standard, titrate with iodine to the end-point).
- Plot a calibration graph of volume of iodine against % ascorbic acid concentration.
- Read off the % concentration of ascorbic acid in the water sample after 15 minutes from the calibration graph.
Prepare a dilution series of the 1.0% standard, test each standard with iodine in the same way as the sample, plot a calibration graph of volume of iodine against % concentration, and read off the unknown.
Background Concept
The volume of iodine required to reach the end-point is proportional to the ascorbic acid concentration. If the relationship is established for solutions of known concentration, the unknown concentration in a test sample can be read off a calibration (standard) curve. A dilution series is the standard way of producing a set of known concentrations from a single stock solution.
Understanding the Question
The question asks the candidate to suggest how the same experiment could be modified to determine the actual percentage concentration of ascorbic acid in the water after 15 minutes, given access to a 1.0% ascorbic acid standard. The two marks are for (1) the idea of making a dilution series of the standard, and (2) the idea of using a graph (calibration curve) to read off the unknown concentration.
Approach
- Think about what is needed to convert the iodine volume (a relative measurement) into a percentage concentration (an absolute measurement): a set of standards of known concentration treated in exactly the same way.
- A 1.0% stock is too concentrated to read off the calibration curve precisely, so a dilution series is needed.
- The data from the dilution series give a calibration graph of iodine volume against % concentration; the unknown is read off this graph.
Step-by-Step Reasoning
- To convert the iodine volume into a percentage concentration, a calibration curve is required.
- The calibration curve is constructed by titrating several standards of known concentration against iodine solution in exactly the same way as the sample (1 starch + 3 standard, dropwise iodine to the end-point).
- The standards are made by diluting the 1.0% stock: a serial dilution (e.g. 1.0%, 0.5%, 0.25%, 0.125%) or a simple dilution (e.g. 1.0%, 0.75%, 0.5%, 0.25%) gives the range of concentrations needed.
- The volumes of iodine for these standards are plotted on a graph with % concentration on the x-axis and volume of iodine on the y-axis.
- The volume of iodine recorded for the 15-minute sample is then read off the calibration graph, and the corresponding % concentration is the answer.
Key Takeaways
- A calibration curve converts an indirect measurement (volume of iodine) into a quantity of interest (% concentration).
- Dilutions are made quantitatively, with a known dilution factor at each step.
- The same procedure (same volumes of starch, same dropwise addition, same end-point rule) must be used for the standards and the unknown.
Common Mistakes
- Suggesting that the % concentration is simply read off the existing graph from part (b) — that graph relates iodine volume to % starch reacted, not % ascorbic acid.
- Omitting the dilution step, which would mean the calibration curve covers only one concentration.
- Failing to state that the calibration curve is needed at all.
Things to Be Careful About
- Two distinct ideas are required: dilution of the standard and use of a graph (calibration curve) to read off the answer.
A systematic error occurs when apparatus with scales are used, since the scales may be slightly different.
For example, when measuring the same line, two rulers may give different lengths. However, as long as the same ruler is used for all the measurements, the trend is not affected because the error is consistent.
State one piece of apparatus used in this investigation that may have a systematic error. Suggest whether this affected your results and give a reason for your answer.
apparatus = ______
reason = ______
Answer
apparatus = syringe (used to deliver iodine) or stopwatch (used to time the 5-minute intervals)
reason = the same syringe / stopwatch was used for all measurements, so any scale inaccuracy was the same for every reading; therefore the trend was not affected (although the absolute values may not be the true values).
Syringe or stopwatch: same one used throughout, so the trend is unaffected by the systematic scale error.
Background Concept
A systematic error is one that shifts all measurements in the same direction by a consistent amount, typically because of a miscalibrated scale (e.g. a ruler or syringe that reads slightly high). Random errors scatter measurements around the true value. A key property of a systematic error is that, provided the same (mis-calibrated) instrument is used throughout, the trend in the data is unaffected — every reading is shifted by the same amount, so the shape of the curve is preserved. Only the absolute values are off.
Understanding the Question
The question asks the candidate to identify one piece of apparatus in the experiment that could be subject to a systematic error and to explain whether it affected the results. The mark is for (1) naming the apparatus and (2) linking the answer to whether the trend was affected, with a reason.
Approach
- Consider each piece of apparatus that has a scale: the syringe, the measuring cylinders (for starch, sample, water), the stopwatch.
- The most clearly relevant items are the syringe (volume of iodine delivered) and the stopwatch (the 5-minute interval).
- Because the same syringe is used for all four samples, any scale inaccuracy in it is a systematic error that affects all four readings equally — so the trend is unchanged.
- The same logic applies to the stopwatch.
Step-by-Step Reasoning
- A systematic error arises when an instrument with a scale (ruler, syringe, stopwatch) is slightly mis-calibrated, so every reading is shifted in the same direction by the same amount.
- The syringe used to deliver iodine in steps 6–11 is a scale-bearing apparatus. If the markings on the syringe are slightly off, every volume read from it is consistently wrong.
- However, the same syringe was used for all four titrations. Therefore every reading is off by the same amount, and the relative comparison between samples (the trend) is preserved.
- The absolute volumes may not match the "true" values, but the trend of increasing volume of iodine with time is unaffected.
- The same argument applies to the stopwatch used for the 5-minute intervals.
Key Takeaways
- Systematic error shifts all measurements in the same direction and is cancelled out when comparing readings taken with the same instrument.
- The trend in a set of data is unaffected by a consistent systematic error; only the absolute values are changed.
Common Mistakes
- Saying the apparatus was a test-tube or beaker — these have no scale and are not subject to scale-based systematic error.
- Saying the systematic error did affect the trend — it does not, provided the same instrument is used throughout.
- Naming the apparatus without a reason, or giving a reason without naming the apparatus.
Things to Be Careful About
- The mark is for naming the apparatus AND giving a reason. Either "same syringe used" or "same stopwatch used" is accepted; the key phrase is that the same instrument was used for all readings.
Iodine solution (iodine in potassium iodide solution) turns blue-black when starch is present in plant tissues.
However, as ascorbic acid is also found in plant tissues, some scientists investigated the effect of testing for starch with iodine solution when there was ascorbic acid present.
The concentration of ascorbic acid was and the concentration of starch solution was standardised.
The percentage of starch which reacted with the iodine solution was measured.
The results are shown in Table 1.1.
Table 1.1
| volume of iodine solution / | percentage of starch which reacted with iodine solution |
|---|---|
| 0.0 | 0.0 |
| 0.5 | 2.0 |
| 1.5 | 5.0 |
| 2.0 | 36.0 |
| 2.5 | 68.0 |
Plot a graph of the data shown in Table 1.1.
You will need to consider the answer to (b)(ii) before you plot your graph.

Answer
Plot on the provided graph grid:
- x-axis: volume of iodine / (scale: 0.5 = 2 cm on the graph, labelled at 0.5, 1.0, 1.5, 2.0, 2.5, 3.0).
- y-axis: percentage (%) of starch reacted with iodine solution (scale: 20% = 2 cm on the graph, labelled at 20, 40, 60, 80, 100).
- Points (small crosses or encircled dots):
- (0.0, 0.0)
- (0.5, 2.0)
- (1.5, 5.0)
- (2.0, 36.0)
- (2.5, 68.0)
- Line: a smooth curve ruled through the points, point to point (since the relationship is non-linear, a smooth curve rather than a straight line is appropriate).
The curve starts almost flat, then rises steeply — the percentage of starch reacted increases sharply once the volume of iodine exceeds about 1.5 .
Graph plotted on the provided grid: volume of iodine on x-axis, % starch reacted on y-axis, five points connected by a smooth curve; the curve rises sharply from about (1.5, 5) to (2.5, 68).
Background Concept
A graph is the most concise way of presenting a set of (x, y) data. The independent variable goes on the x-axis and the dependent variable on the y-axis. Each axis must be labelled with the quantity and unit, and the scale must be chosen so that the data points cover at least half the grid in both directions. Points are plotted as small crosses (×) or encircled dots (⊙), and the line is either point-to-point (where the relationship is not a straight line) or a line of best fit (where it is).
Understanding the Question
The candidate is given five pairs of (volume of iodine, % starch reacted) data and asked to plot a graph. The mark scheme rewards four separate points: axes correctly identified, sensible scales, accurate point plotting, and an appropriate line. The graph is to be drawn on the provided grid.
Approach
- Choose the axes: x = volume of iodine (independent), y = % starch reacted (dependent).
- Choose scales that use most of the grid: 0.5 per 2 cm on the x-axis (so labels at 0.5, 1.0, 1.5, 2.0, 2.5, 3.0) and 20% per 2 cm on the y-axis (so labels at 20, 40, 60, 80, 100).
- Plot each of the five points carefully as a small cross or encircled dot.
- Join the points with a smooth curve (the relationship is clearly non-linear, with the curve flattening near 0 and rising steeply after 1.5 ).
Step-by-Step Reasoning
- The data:
- (0.0, 0.0)
- (0.5, 2.0)
- (1.5, 5.0)
- (2.0, 36.0)
- (2.5, 68.0)
- x-axis: "volume of iodine / ". The largest x value is 2.5, so the scale should comfortably extend to 3.0. With 0.5 per 2 cm of grid, the points from 0 to 3.0 occupy 12 cm of the 18+ cm available — a "good use" of the grid.
- y-axis: "% (or percentage) of starch reacted". The largest y value is 68, so the scale should comfortably extend to 100. With 20% per 2 cm of grid, the points from 0 to 100 occupy 10 cm of the grid vertically — a "good use".
- Plot each pair of values carefully as a small cross or encircled dot. Double-check the four upper points especially, as the steep rise between (1.5, 5) and (2.5, 68) is the most striking feature of the graph.
- Connect the points with a smooth, continuous curve. Do not use a straight line of best fit — the relationship is clearly non-linear.
Key Takeaways
- Always identify the independent (x) and dependent (y) variables before plotting.
- The scale should use at least half the grid in both directions, and the labels should be at sensible round intervals.
- A curve is drawn point-to-point with a smooth, continuous line — no straight segments, no break in the line, and no extension beyond the first and last points unless extrapolation is required.
Common Mistakes
- Swapping the axes: the volume of iodine is the independent variable and goes on the x-axis.
- Forgetting the units in the axis label.
- Using awkward scales (e.g. one small square = 0.3 ) that make plotting difficult.
- Joining the points with straight line segments, which is not appropriate for a curve that clearly bends.
- Extending the curve beyond the first or last point (the curve must stop at the first and last points unless the question specifically asks for extrapolation).
Things to Be Careful About
- The mark scheme awards marks for: (1) both axes correctly labelled with units, (2) sensible scales, (3) correct plotting of all five points, (4) an appropriate line (sharp, smooth, point-to-point or a line of best fit if the data are linear — they are not in this case).
Estimate the volume of iodine solution needed for 100% of the starch to be reacted.
Show on your graph how you obtained the volume of iodine solution.
volume of iodine solution = ______
Working
- On the graph from (b)(i), draw a horizontal dashed line from y = 100% across to the extrapolated curve.
- From that point on the curve, drop a vertical dashed line down to the x-axis.
- Read off the value on the x-axis where the vertical line meets it.
Answer
volume of iodine solution ≈ 3.0 (acceptable range 2.9–3.1 depending on the curve drawn).
Approximately 3.0 cm³ of iodine solution is needed for 100% of the starch to react.
Background Concept
Once a graph has been drawn, it can be used to read off values that are not directly in the data — either between plotted points (interpolation) or beyond them (extrapolation). The candidate must show the construction (a horizontal line to the curve, then a vertical line down to the x-axis) so the examiner can see where the answer came from.
Understanding the Question
The graph shows how the percentage of starch reacted changes with the volume of iodine added. The question asks how much iodine is needed to react with 100% of the starch — that is, to read off the x-value when the y-value is 100%. Because 100% is beyond the highest data point (68% at 2.5 ), this is an extrapolation.
Approach
- Draw a horizontal line from 100% on the y-axis to the extrapolated curve.
- From the intersection, draw a vertical line down to the x-axis.
- Read off the x-value.
Step-by-Step Reasoning
- The data end at (2.5 , 68%). The curve has been rising more and more steeply — between 2.0 and 2.5 the % starch reacted jumped from 36 to 68, a change of 32% over 0.5 of iodine.
- To reach 100% from 68% requires another 32% of starch to be reacted. At the current rate, that would need roughly another 0.5 of iodine — giving an estimate of about 3.0 total.
- The graph itself, when extrapolated, supports this: the smooth curve, if continued with the same increasing gradient, reaches 100% at approximately 3.0 .
- The mark is awarded for the estimation read off the graph (≈3.0 ), with the construction shown on the graph.
Key Takeaways
- Extrapolation must be shown on the graph: a horizontal line to the curve and a vertical line down to the x-axis.
- The estimated value depends on how the curve is drawn; the mark scheme accepts any value consistent with the curve.
Common Mistakes
- Reading the value directly off the table (e.g. saying 2.5 ) — that only gives 68%, not 100%.
- Failing to show the construction lines on the graph — the examiner cannot credit an answer that has no visible derivation.
- Drawing the curve to plateau before reaching 100% — the trend is clearly still rising at 2.5 .
Things to Be Careful About
- The candidate must (1) draw the construction lines, (2) read off the value, and (3) give the answer with the correct unit (cm³).
Explain how the presence of ascorbic acid may affect the use of iodine solution as a test for the presence of starch in different plant tissues.
Answer
- If too much ascorbic acid is present in the plant tissue, the iodine is reduced back to iodide (colourless) and the blue-black colour may not appear, giving a false negative for starch.
- Conversely, more iodine must be added before the blue-black colour develops, so the test may appear to need a larger volume of iodine than expected.
- Therefore, to use the iodine test reliably, the ascorbic acid concentration in the plant tissue must be known so that enough iodine is added to overcome it.
Ascorbic acid can prevent the blue-black colour from appearing (false negative) or require more iodine before the colour shows; the ascorbic acid concentration must be known for the test to be accurate.
Background Concept
Iodine in potassium iodide solution forms a blue-black complex with starch (specifically with the amylose component). Ascorbic acid is a reducing agent: it reduces iodine (I₂) to iodide (I⁻), which is colourless and does not form the complex with starch. In the presence of ascorbic acid, therefore, iodine is "used up" before it can react with the starch, and the characteristic blue-black colour may not develop.
Understanding the Question
The question asks the candidate to explain how the presence of ascorbic acid may affect the use of iodine solution as a test for starch in plant tissues. The mark scheme allocates one mark for the effect on the test result and one mark for the practical implication (the need to know the ascorbic acid concentration).
Approach
- Consider what ascorbic acid does chemically to iodine (it reduces it).
- Translate that into the practical effect on the test (the blue-black colour may not appear, so the test may give a false negative, or more iodine may have to be added).
- Explain why this matters in practice (without knowing the ascorbic acid concentration, you cannot tell how much extra iodine to add to be sure of detecting the starch).
Step-by-Step Reasoning
- Ascorbic acid is a reducing agent. It reacts with iodine, reducing I₂ to I⁻ (which is colourless).
- While ascorbic acid is present, no iodine is left over to form the blue-black complex with starch — so the test may appear negative even though starch is present.
- Alternatively, the test only becomes positive after enough iodine has been added to react with all the ascorbic acid; this means more iodine than expected is required, and the test is not simply "iodine turns blue-black with starch".
- The reliability of the test therefore depends on the ascorbic acid concentration in the tissue: if the ascorbic acid concentration is high, the blue-black colour will only appear after a larger volume of iodine has been added; if it is very high, the colour may not appear at all.
- To use the test reliably, the ascorbic acid concentration in the tissue must be known, so that an appropriate excess of iodine can be added.
Key Takeaways
- Ascorbic acid interferes with the iodine–starch test by reducing iodine before it can react with starch.
- The interference depends on the ascorbic acid concentration: more ascorbic acid means more iodine is required, or the test fails entirely.
- Quantitative tests (e.g. the calibration approach in (a)(vii)) are needed if the test is to be used reliably in tissues that contain ascorbic acid.
Common Mistakes
- Saying ascorbic acid "changes the colour of iodine" — it reduces iodine, it does not simply react with it.
- Saying the test will always give a false positive — the opposite is true (a false negative, because iodine is removed before it can stain the starch).
- Failing to mention the practical implication: that the ascorbic acid concentration must be known.
Things to Be Careful About
- Two distinct ideas: (1) the chemical effect of ascorbic acid on the test result, and (2) the practical consequence — that the test is unreliable unless the ascorbic acid concentration is known.
A plant tissue contains ascorbic acid and starch.
Suggest how you would make sure that the iodine test showed the presence of all the starch (100%).
Answer
Add excess iodine solution — at least the volume estimated in (b)(ii) (≈ 3 ) for every test — so that all the ascorbic acid is oxidised and all the starch is still free to react with the remaining iodine.
Add excess iodine (at least the volume from (b)(ii), i.e. ≈ 3 cm³, or more) so that the iodine is in excess of the ascorbic acid and can react with all the starch.
Background Concept
For the iodine test to detect all the starch in a sample, the iodine must be present in excess over the ascorbic acid (which would otherwise consume the iodine) and still leave enough iodine to react with the starch. The volume of iodine required for 100% reaction of the starch was estimated in (b)(ii); any volume greater than this is an excess and is therefore sufficient.
Understanding the Question
The candidate is asked to suggest a single modification that would ensure the iodine test shows the presence of all the starch in a plant tissue that contains 0.0001 mol dm⁻³ ascorbic acid. One mark is awarded for the suggestion of using excess iodine, ideally with reference to the volume from (b)(ii).
Approach
- The interfering substance is the ascorbic acid; to overcome it, the iodine must be added in excess.
- The volume from (b)(ii) is the volume that reacts with 100% of the starch in the absence of ascorbic acid. To overcome the ascorbic acid AND react with all the starch, more iodine than this is needed.
- The simplest suggestion is to use 3 or more of iodine per test.
Step-by-Step Reasoning
- The ascorbic acid consumes some of the iodine before the iodine can react with the starch.
- The volume of iodine that reacts with all the starch (without ascorbic acid) was estimated in (b)(ii) as approximately 3 .
- If exactly this volume is used, the iodine will be partially consumed by the ascorbic acid and not all the starch will react — the test will underestimate the starch.
- To overcome the ascorbic acid, an excess of iodine must be added: at least 3 (the volume from (b)(ii)) and ideally more.
- A simple working suggestion is therefore: "add 3 or more of iodine to the sample, so that the iodine is in excess of the ascorbic acid and can react with all the starch".
Key Takeaways
- An excess of the titrant is the standard way of overcoming a competing reaction.
- The volume from (b)(ii) is the stoichiometric minimum; more is needed if there is a competing reactant.
Common Mistakes
- Suggesting a different test for starch altogether (the question asks how to make the iodine test work, not how to replace it).
- Suggesting that the ascorbic acid should be removed first — this is impractical.
- Failing to quantify "excess" (e.g. just saying "use more iodine" without saying how much more, or referring back to (b)(ii)).
Things to Be Careful About
- The mark scheme accepts "use 3 or more", "use excess iodine", or "use the volume from (b)(ii) or more". Any of these is sufficient.
The rest of this paper
1 more questions- Q2Use of the Light Microscope18M