Biology 9700/33 — May/June 2014
Cambridge AS Level · Advanced Practical Skills · worked solutions for every part, with the mark scheme
Topics Manipulation, Measurement and Observation · Analysis, Conclusions and Evaluation · Use of the Light Microscope · Presentation of Data and Observations
You are provided with a blue solution, labelled C, which is alkaline.
C is blue because it contains an indicator.
Carbon dioxide reacts with C when bubbled into it. When enough carbon dioxide reacts with C, the indicator will change from blue to yellow (even if the solution is cloudy). This is the end-point.
Hydrochloric acid, H, can also turn indicator C clear. If only a small volume of carbon dioxide is bubbled into C then the indicator will remain blue. Hydrochloric acid, H, can then be added slowly until the indicator turns from blue to yellow.
The volume of H is then recorded.
The greater the volume of H that needs to be added to reach the end-point, the less carbon dioxide has reacted with C.
You are provided with:
| labelled | contents | hazard | volume / |
|---|---|---|---|
| Y | yeast cell suspension | none | 50 |
| C | alkaline solution (blue) | irritant | 70 |
| H | hydrochloric acid | irritant | 30 |
You are now required to find the volume of H needed to reach the end-point, when no carbon dioxide has been bubbled into C.
When no carbon dioxide has been bubbled into C, the greatest volume of H will need to be added to get the end-point.
Proceed as follows:
- Put of C into a test-tube.
- Use a syringe, containing of H, to put drops of H into C as shown in Fig. 1.1.
Mix well as you add H, until the end-point is reached. You may need to fill the syringe again.
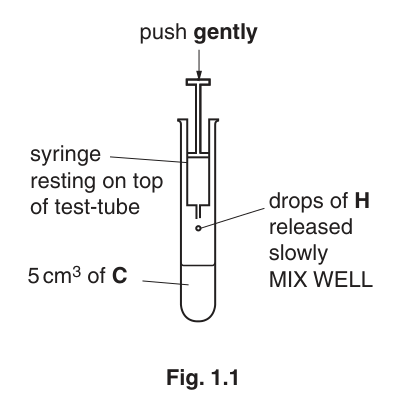
Record the volume of H needed to reach the end-point.
volume of H = ______
Yeast cells release carbon dioxide from some of their metabolic reactions.
A student investigated the release of carbon dioxide from a yeast cell suspension, using the apparatus shown in Fig. 1.2.
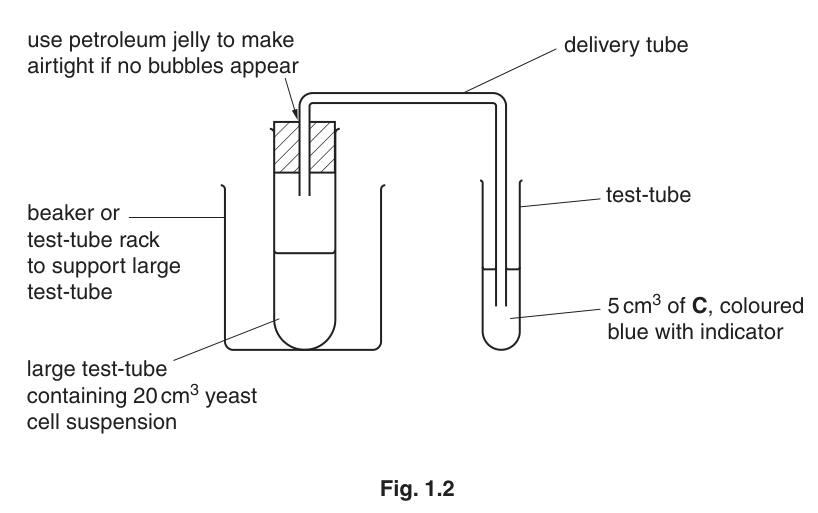
The student set up this apparatus and left it for 10 minutes.
The student observed that during the 10 minutes the bubbles of carbon dioxide were not released at a constant rate.
You are required to investigate the release of carbon dioxide bubbles during 10 minutes using apparatus set up as in Fig. 1.2.
You will move the delivery tube to different test-tubes containing C, at different times during 10 minutes.
Decide the length of time you will leave the delivery tube in each test-tube containing C. State the length of time.
time = ______
State one significant source of error that may occur when the delivery tube is moved from one test-tube to the next.
Describe how you will reduce this error.
source of error = ______
description = ______
Read steps 3 to 11 before proceeding:
- Put of C into a test-tube. Repeat for the number of test-tubes you need to use for your times in (a)(ii).
- Remove Y by placing the nozzle of a large syringe below any froth on the surface.
- Put of Y into the large test-tube.
- Put the bung containing the delivery tube into the large test-tube. It must be airtight.
- Hold the large test-tube as shown in Fig. 1.3.
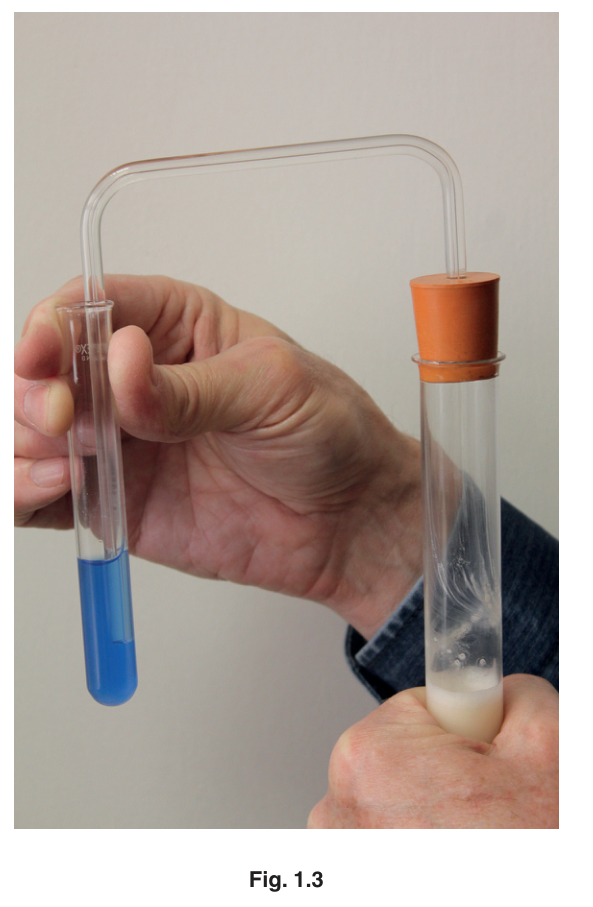
- Put the end of the delivery tube into the first test-tube containing C. Immediately start timing.
- After the time you decided in (a)(ii), move the delivery tube to the next test-tube containing C.
- Repeat step 9 for all the test-tubes which you set up in step 3.
- After removing the delivery tube from the last test-tube, repeat step 2 with any of the test-tubes where there is still a blue colour.
Record your results in (a)(iv).
For any test-tubes where C is yellow (even if the solution is cloudy) record '0'.
Prepare the space below and record your results.
Identify one significant source of error in measuring the dependent variable in this investigation.
A systematic error occurs when apparatus with scales are used, since the scales may be slightly different.
For example, when measuring the same line, two rulers may give different lengths. However, as long as the same ruler is used for all the measurements, the trend is not affected because the error is consistent.
State one piece of apparatus used in this investigation that may have a systematic error.
Suggest whether this affected your results and give a reason for your answer.
apparatus = ______
reason = ______
Increasing concentrations of carbon dioxide in the atmosphere have been recorded by scientists for over one hundred years and can be used to predict future increases.
Scientists have studied the effect of carbon dioxide on the leaf area of two different types of plants, R and T, after 60 days.
A large sample of each type of plant was grown in air containing one of the following concentrations of carbon dioxide:
- (the concentration measured in the atmosphere around the year 1900)
- (the concentration measured in the atmosphere now)
- (the concentration which is predicted in the atmosphere for the year 2100).
All other variables were standardised.
On day 60 the mean leaf area per plant was calculated.
The results are shown in Table 1.1.
Table 1.1
| concentration of / | mean leaf area / | |
|---|---|---|
| plant R | plant T | |
| 280 | 1.00 | 1.50 |
| 380 | 2.55 | 3.35 |
| 719 | 4.20 | 3.90 |
Complete Fig. 1.4 by plotting a chart of the data in Table 1.1.
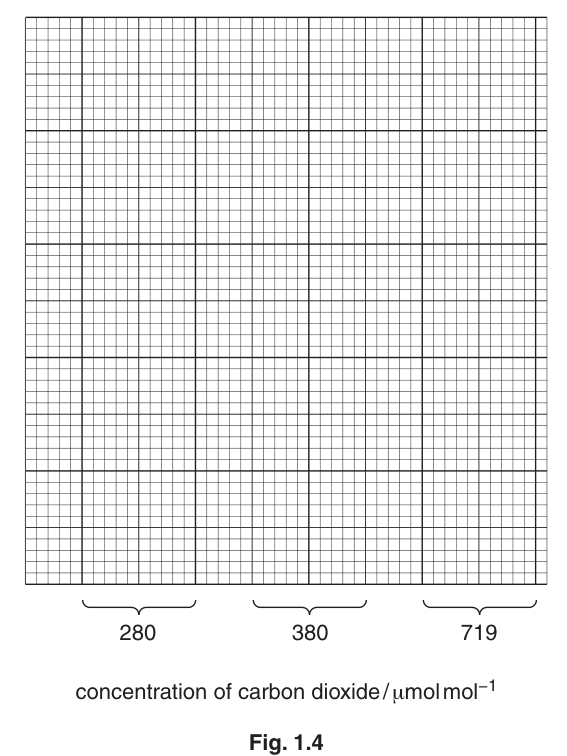
Describe the trends shown on the chart for R and T.
Suggest how the differences in the leaf area in plant R may affect transport in this plant.
Fig. 1.5 is a photomicrograph of a stained transverse section through part of a plant leaf. This plant species is native to part of Asia.
You are not expected to have studied this leaf.
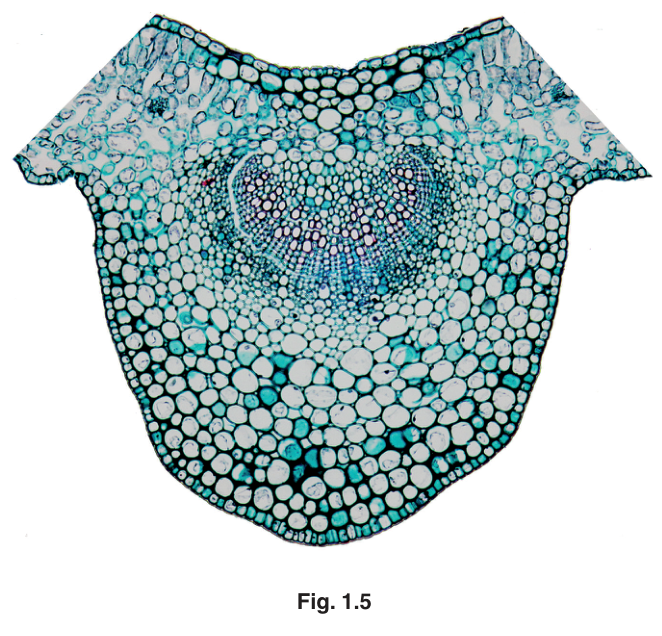
Draw a large plan diagram of the part of the leaf shown in Fig. 1.5.
On your diagram, use a ruled label line and label to show the vascular bundle.
The rest of this paper
1 more questions- Q2Use of the Light Microscope · Analysis, Conclusions and Evaluation · Manipulation, Measurement and Observation18M