Biology 9700/32 — May/June 2014
Cambridge AS Level · Advanced Practical Skills · worked solutions for every part, with the mark scheme
Topics Presentation of Data and Observations · Analysis, Conclusions and Evaluation · Manipulation, Measurement and Observation · Use of the Light Microscope
You are provided with a solution labelled, E, containing an enzyme which coagulates (clots) milk.
Calcium ions are required for this coagulation.
You are required to investigate the concentration of calcium ions (the independent variable), on the progress of this enzyme-catalysed coagulation.
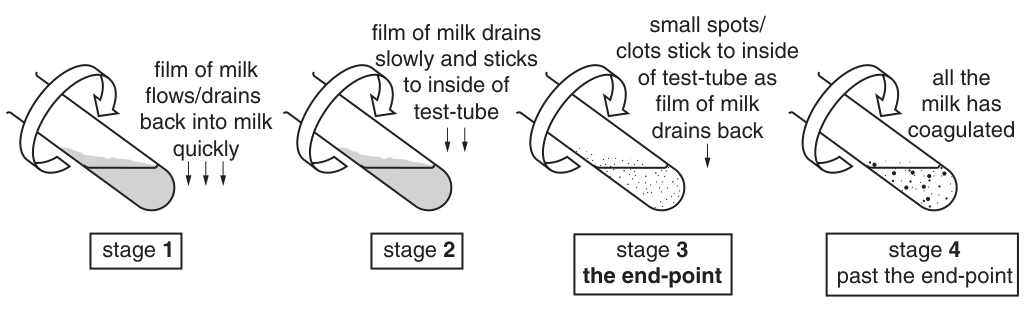
When a mixture of milk, enzyme and calcium chloride is gently rotated the coagulation goes through the stages shown in Fig. 1.1.
Stage 3 is the end-point of the enzyme-catalysed coagulation.
You are provided with:
| labelled | contents | hazard | volume / |
|---|---|---|---|
| C | 20% calcium chloride solution | harmful irritant | 50 |
| W | distilled water | none | 100 |
| M | milk | none | 100 |
| E | 1% enzyme solution | harmful irritant | 20 |
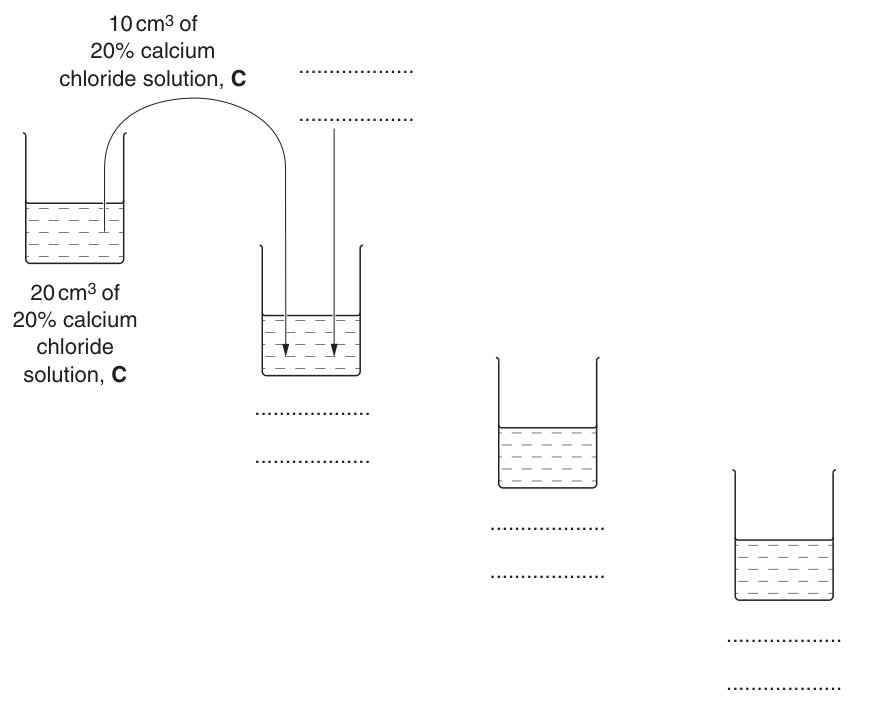
You are now required to carry out a serial dilution of calcium chloride solution, C, to reduce the concentration of C, by half between each successive dilution.
You will need of each calcium chloride solution.
Complete Fig. 1.2 to show how you will make three further concentrations of calcium chloride solution by serial dilution.
Proceed as follows:
- Prepare all the concentrations of calcium chloride solution as shown in Fig. 1.2 in the containers provided.
- You are provided with a water-bath. Adjust the temperature to between and . You will need to maintain this temperature during steps 3 to 10.
- Put of each of the four concentrations of calcium chloride solution into separate test-tubes.
- Put of M into each test-tube.
- Gently shake each of the test-tubes to mix M and calcium chloride solution.
- Put the test-tubes into the water-bath and leave for at least three minutes.
Read steps 7 to 11 before proceeding.
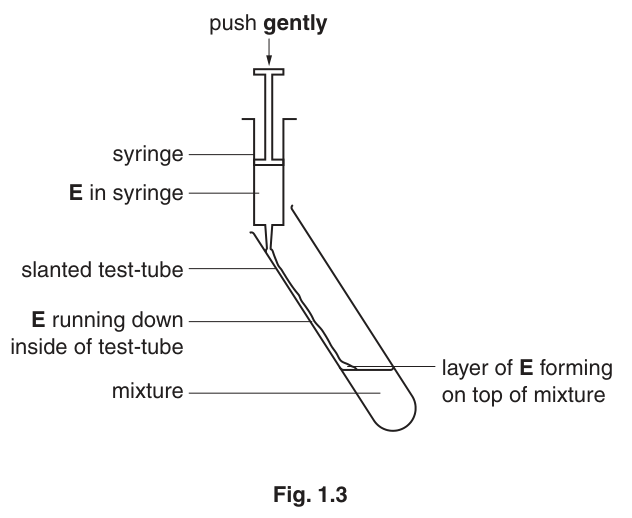
- Remove the test-tube containing the mixture with the highest concentration of the calcium chloride solution from the water-bath. The process of coagulation will start when E is added to each test-tube. Put of solution E, so that it runs down the side of the test-tube to form a layer on the surface of the mixture as shown in Fig. 1.3.
- Gently shake the test-tube to mix the solutions and start timing.
- Gently rotate the test-tube, as shown in Fig. 1.1 on page 2, to form a film of milk on the inside of the test-tube.
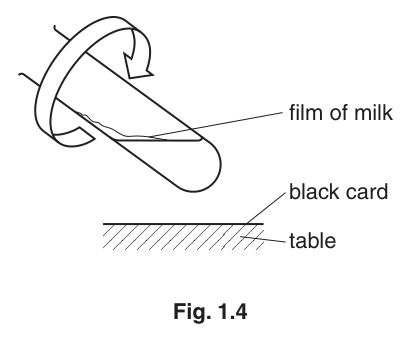
- Continue to rotate the test-tube whilst holding it over the black card on the table (see Fig. 1.4).
Record the time to reach the end-point as shown in stage 3 in Fig. 1.1. Ignore any small bubbles on the inside of the test-tube. If the end-point has not been reached by 4 minutes, stop the experiment and record 'more than 240'.
- Repeat steps 7 to 10 using the other concentrations of calcium chloride solution.
Prepare the space below and record your results.
Identify one significant source of error in measuring the dependent variable in this investigation.
A systematic error occurs when apparatus with scales are used, since the scales may be slightly different. For example, when measuring the same line, two rulers may give different lengths. However, as long as the same ruler is used for all the measurements, the trend is not affected because the error is consistent.
State one piece of apparatus used in this investigation that may have a systematic error. Suggest whether this affected your results and give a reason for your answer.
apparatus ______
reason ______
Describe a suitable control for this investigation.
In a similar investigation on the enzyme-catalysed coagulation of milk, a student studied the effect of heating solution E at for different times.
After heating, the time to reach the end-point was recorded as in your investigation. This was repeated for each of the different times.
State two variables that need to be kept the same (standardised) in this investigation. Describe how you would standardise each of these variables.
variable 1 ______
description ______
variable 2 ______
description ______
The results of this investigation are shown in Table 1.1.
Table 1.1
| time of heating solution E / s | time to reach the end-point / s |
|---|---|
| 60 | 30 |
| 150 | 75 |
| 185 | 96 |
| 240 | 140 |
| 300 | 220 |
Plot a graph of the data shown in Table 1.1.

Explain the trend shown in your graph.
The rest of this paper
1 more questions- Q2Use of the Light Microscope · Presentation of Data and Observations · Analysis, Conclusions and Evaluation20M