Biology 9700/31 — May/June 2014
Cambridge AS Level · Advanced Practical Skills · worked solutions for every part, with the mark scheme
Topics Presentation of Data and Observations · Manipulation, Measurement and Observation · Analysis, Conclusions and Evaluation · Use of the Light Microscope
The Benedict’s test can be used to detect the presence of reducing sugars such as glucose. A solution to be tested is mixed with Benedict’s solution, heated and the time taken to the first appearance of a colour change recorded.
A student suggested the hypothesis:
“the time taken for the Benedict's solution to show the first appearance of a colour change will decrease as the temperature increases.”
You are required to investigate the effect of different temperatures (the independent variable) when carrying out the Benedict’s test.
You are provided with:
| labelled | contents | hazard | volume / |
|---|---|---|---|
| G | 4% glucose solution | none | 60 |
| Benedict’s solution | Benedict’s solution | harmful irritant | 80 |
You must now read up to the end of step 4 before proceeding.
You will need to standardise the Benedict’s test to compare the time taken to the first appearance of a colour change at four different temperatures, , , and .
Use of G for each temperature tested.
Decide the volume of Benedict’s solution you will use for each test.
Complete the table to show the volume of Benedict’s solution you will use.
| solution | volume / |
|---|---|
| Benedict’s | |
| G | 4 |
Answer
| solution | volume / cm³ |
|---|---|
| Benedict's | 4 |
| G | 4 |
4 cm³
Background Concept
The Benedict's test detects reducing sugars. When Benedict's reagent (blue alkaline copper(II) citrate solution) is heated with a reducing sugar, the Cu²⁺ ions are reduced to Cu⁺ ions and a brick-red precipitate of copper(I) oxide forms. To make a fair comparison of how quickly the colour change appears, the volume of Benedict's reagent must be the same in every test and must be sufficient to react with all of the glucose in the sample.
Understanding the Question
You are asked to fix the volume of Benedict's solution used in every test. The volume is added to a fixed 4 cm³ of glucose solution G for each temperature tested. The volume you choose here will also be used in part (a)(vi).
Approach
The mark scheme accepts any value from 4 cm³ up to 10 cm³ inclusive — the Benedict's volume must be at least equal to the volume of glucose so that every glucose molecule can react. Pick the simplest valid value that keeps the test-tube heating efficiently.
Step-by-Step Reasoning
- 4 cm³ of Benedict's provides reagent in equal volume to the glucose sample, so all the reducing sugar present will react.
- Smaller volumes would risk the Benedict's being used up before all the glucose had reacted.
- Larger volumes (up to 10 cm³) would dilute the glucose and slow the appearance of the colour change.
- Choosing 4 cm³ keeps the total reaction volume small (8 cm³), so the tube reaches the water-bath temperature quickly and the time recorded reflects the rate of reaction rather than the heating time.
Key Takeaways
- Standardising reagent volumes is essential for a fair test.
- The reagent volume must be sufficient to react with all the analyte present.
- The volume chosen here must be used consistently throughout the investigation, including in (a)(vi).
Common Mistakes
- Choosing less than 4 cm³ — the Benedict's would be insufficient to react with all the glucose.
- Choosing a much larger volume (e.g. >10 cm³) — the glucose would be so diluted that the colour change would be very slow and possibly undetectable.
Things to Be Careful About
- Always quote the volume with its units (cm³).
- Use the same volume in (a)(vi) for the Benedict's solution.
Proceed as follows;
- Set up a water-bath and maintain it at the first temperature of .
- Test of G with Benedict’s solution using the volume you decided in (a)(i). Start timing when the test-tube is placed into the water-bath and record the time taken for the first appearance of a colour change at the top of the mixture in the test-tube. If no colour change occurs after 4 minutes, stop the experiment and record ‘more than 240’.
- Immediately pour the contents of the test-tube into the container labelled ‘for waste’. Fill the test-tube with water from the container labelled ‘for washing’. Empty the contents of the test-tube into the container labelled ‘for waste’.
- Repeat steps 1 to 3 with the other temperatures of the water-bath, , and .
Prepare the space below and record your results.
Answer
| temperature / °C | time / s |
|---|---|
| 70 | 145 |
| 80 | 75 |
| 90 | 40 |
| 100 | 22 |
(Times shown are representative — actual student readings will vary. The table must have both headings underlined, the columns separated by a line, and units in the headings.)
See working — table with columns 'temperature / °C' and 'time / s', values student-dependent (e.g. 145, 75, 40, 22)
Background Concept
The Benedict's reaction, like any chemical reaction, runs faster at higher temperatures because the reacting particles have more kinetic energy and collide more frequently and with greater energy. The shorter the time to the first appearance of the colour change, the faster the reaction.
Understanding the Question
You have tested 4 cm³ of G + 4 cm³ of Benedict's at four water-bath temperatures (70, 80, 90 and 100 °C), timing the first sign of colour change at the top of the tube. You must now present those four times in a properly formatted results table.
Approach
Use a table with the conventions required at A-level:
- Column headings must include the quantity AND its unit.
- Each column must be separated by a vertical line.
- Every heading word must be underlined.
- Each row contains one independent variable value and the corresponding time.
Step-by-Step Reasoning
- The independent variable is temperature in °C; the dependent variable is time in seconds.
- Headings: write
temperature / °C(ortemp / °C) andtime / s(ortime / sec); both must be underlined. - Draw vertical lines between the columns.
- Enter the four temperatures in the first column and the four measured times (whole seconds only) in the second.
- If a test produced no colour change in 4 min, record
>240.
Representative values showing the expected trend (decreasing time with increasing temperature): 145 s at 70 °C, 75 s at 80 °C, 40 s at 90 °C, 22 s at 100 °C.
Key Takeaways
- Tables must have clear, underlined headings with units.
- Times in a Benedict's experiment are expected to decrease as temperature increases.
- The whole-second rule means readings are recorded to the nearest second.
Common Mistakes
- Forgetting to underline the headings.
- Missing units in the headings (e.g. writing only
temperatureinstead oftemperature / °C). - Not separating the columns with a vertical line.
- Recording the time in minutes, not seconds.
Things to Be Careful About
- Record times only as whole seconds — partial seconds are not accepted.
- The time recorded is to the FIRST appearance of colour change, not the final colour.
- If the colour change has not appeared by 4 minutes, record
>240rather than estimating.
The student’s hypothesis was:
“the time taken for the Benedict's solution to show the first appearance of a colour change will decrease as the temperature increases.”
State whether your results support this hypothesis.
Use your results to explain your answer.
Answer
Yes, the results support the hypothesis.
At 70 °C the time was 145 s and at 100 °C it had decreased to 22 s, showing that the time taken for the first appearance of a colour change decreases as temperature increases. (Higher temperatures give the reacting particles more kinetic energy, so the rate of reaction is greater.)
Yes — times decreased as temperature increased (e.g. 145 s at 70 °C → 22 s at 100 °C).
Background Concept
A chemical reaction proceeds faster at higher temperatures because the reacting particles have greater average kinetic energy, collide more often and a higher proportion of collisions exceed the activation energy. In the Benedict's test, the time to the first appearance of the brick-red colour is therefore expected to decrease as temperature rises.
Understanding the Question
You must decide whether YOUR recorded results from (a)(ii) agree with the hypothesis that the time to first colour change decreases as temperature increases, and justify that decision with reference to your data.
Approach
Compare the trend in your four recorded times with the trend predicted by the hypothesis. State whether your results agree, then back up your statement by quoting at least two temperatures and the two corresponding times.
Step-by-Step Reasoning
- Read across your table from the lowest temperature to the highest. If the times go down (i.e. time decreases as temperature rises), the data support the hypothesis.
- Quote two pairs of values to give evidence: e.g. "at 70 °C the time was 145 s but at 100 °C it was only 22 s".
- The second mark is earned by either another data pair OR by the kinetic-energy explanation: "higher temperature gives the reacting particles more kinetic energy, so the rate of reaction is greater".
If your data had gone the other way (longer times at higher temperatures), you would have answered that the results did not support the hypothesis and explained that the trend was not as predicted.
Key Takeaways
- A conclusion must be supported by data (at least two specific values) — a bare yes/no is not credited.
- Kinetic-energy reasoning is an alternative way to earn the second mark.
- If the data do not fit the hypothesis, the conclusion must still reflect the data, not the hypothesis.
Common Mistakes
- Writing only "yes, my results support the hypothesis" without quoting any times.
- Quoting temperatures without the times, or vice versa.
- Saying "yes" when the data actually show the opposite trend.
Things to Be Careful About
- Use AT LEAST two temperatures AND two times to earn the data mark.
- The mark for kinetic energy is independent of the data mark, so either route is acceptable.
You are required to:
- select one temperature from , , or to carry out the Benedict’s test
- make different concentrations of glucose from the solution G
- estimate the glucose concentrations of solutions S1 and S2 at the selected temperature.
You are provided with:
| labelled | contents | hazard | percentage concentration | volume / |
|---|---|---|---|---|
| S1 | glucose solution | none | unknown | 15 |
| S2 | glucose solution | none | unknown | 15 |
| W | distilled water | none | – | 100 |
To compare the concentrations of glucose you will need to standardise the temperature using your results from (a)(ii).
State the temperature you will use.
State a reason for the temperature you have chosen.
temperature = ______
reason = ______
Answer
temperature = 90 °C
reason = at this temperature the colour change occurred within the 240 s time limit AND was slow enough to be timed accurately.
90 °C — the colour change occurred within the 240 s time limit and was slow enough to time accurately.
Background Concept
When comparing the glucose concentrations of different solutions, every variable other than the one being studied must be kept constant. Here, temperature must be standardised so that any difference in time is caused by the difference in glucose concentration and not by the difference in temperature.
Understanding the Question
From the four temperatures you tested, you must pick ONE to use in the second part of the investigation (where you compare the concentrations of G, S1 and S2). You must justify your choice.
Approach
Pick the temperature that gave a measurable result: not so fast that you cannot time the colour change accurately, and not so slow that it exceeds the 240 s limit. 90 °C is typically a workable choice; 80 °C is also defensible; 100 °C may be too fast and 70 °C may be too slow.
Step-by-Step Reasoning
- A temperature that gave a
>240reading cannot be used (no useful measurement). - A temperature that gave a very short time (e.g. <10 s) is hard to time accurately because the reaction begins before the tube is fully at the bath temperature.
- An intermediate temperature (e.g. 80 °C or 90 °C) gives a time that is long enough to be timed precisely with a stopwatch but short enough not to exceed the limit.
- State the chosen temperature with its unit (°C) AND a valid reason (within the time limit / slow enough to be timed accurately / gives a clear, measurable colour change).
Key Takeaways
- A standardised temperature must be workable: measurable AND within the time limit.
- The chosen temperature is used throughout (a)(vii).
- A reason must accompany the temperature — a number alone earns no credit.
Common Mistakes
- Choosing 100 °C (reaction too fast to time accurately) without acknowledging the problem.
- Choosing 70 °C without checking that the colour change actually occurred within 240 s.
- Stating the temperature without giving a reason.
Things to Be Careful About
- Always include the unit (°C).
- The reason must relate to either the timing accuracy or the 240 s limit.
You are now required to carry out a serial dilution of glucose solution, G, to reduce the concentration of G by half between each successive dilution.
You will need of each glucose concentration.
Fig. 1.1 shows how to make the first concentration of 2% glucose solution.
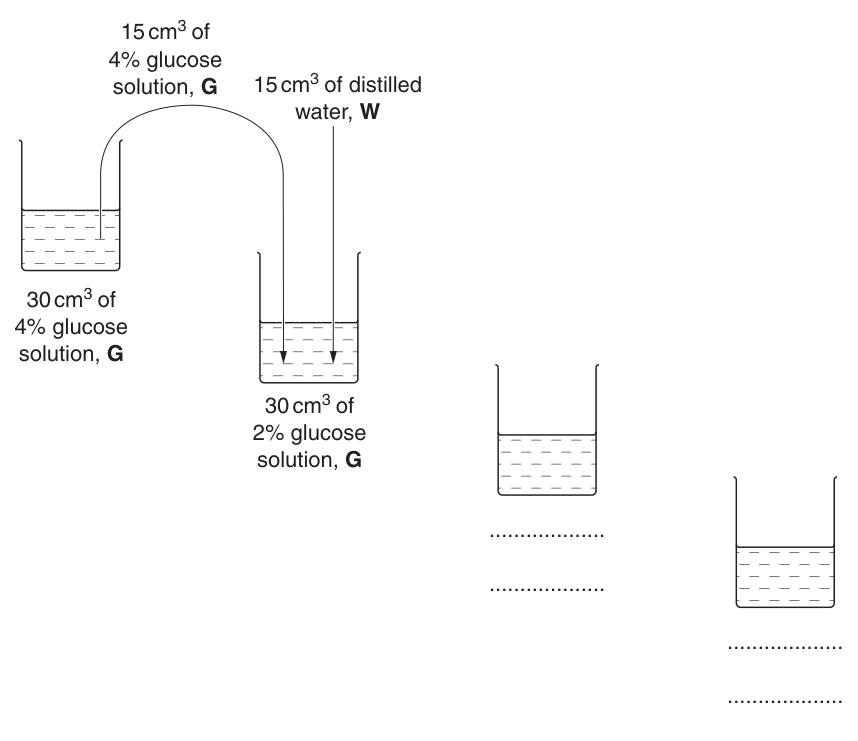
Complete Fig. 1.1 to show how you will make two further concentrations of G.
Answer
The third beaker is completed as 30 cm³ of 1% glucose solution G, made by transferring 15 cm³ of the 2% solution from beaker 2 into beaker 3 and adding 15 cm³ of distilled water W. The fourth beaker is completed as 30 cm³ of 0.5% glucose solution G, made by transferring 15 cm³ of the 1% solution from beaker 3 into beaker 4 and adding 15 cm³ of distilled water W.
1% and 0.5% formed by 15 cm³ transfer + 15 cm³ water at each stage.
Background Concept
A serial dilution halves the concentration at each step while keeping the total volume constant. The principle is: take half of the previous solution and top it up to the original volume with solvent. Here, the previous solution is 30 cm³, so 15 cm³ is transferred and 15 cm³ of distilled water W is added — the concentration is halved each time.
Understanding the Question
You are given the first dilution step (4% → 2%) in Fig. 1.1. You must extend the diagram to show the next two dilution steps (2% → 1% → 0.5%). You also need 15 cm³ of each concentration for testing.
Approach
Each subsequent step is identical in pattern: transfer 15 cm³ of the previous beaker into the next beaker, then add 15 cm³ of distilled water W. The new concentration is half the previous one.
Step-by-Step Reasoning
- From 4% take 15 cm³ → top up to 30 cm³ with water → 2% (already shown).
- From 2% take 15 cm³ → top up to 30 cm³ with water → 1%.
- From 1% take 15 cm³ → top up to 30 cm³ with water → 0.5%.
On the diagram:
- Third beaker: an arrow shows 15 cm³ being transferred from beaker 2 into it; a second arrow shows 15 cm³ of distilled water W being added; the beaker is labelled
30 cm³ of 1% glucose solution G. - Fourth beaker: an arrow shows 15 cm³ being transferred from beaker 3 into it; a second arrow shows 15 cm³ of distilled water W being added; the beaker is labelled
30 cm³ of 0.5% glucose solution G.
The two concentrations 1% and 0.5% are the new pieces of information required.
Key Takeaways
- A serial dilution halves the concentration at each step while the total volume is restored to the same value.
- Always top up with the solvent (here, distilled water W), not with more of the original solution.
- The final set of standards will be 4%, 2%, 1% and 0.5% glucose — these can be used to estimate the concentrations of S1 and S2 in (a)(vii).
Common Mistakes
- Adding 15 cm³ of glucose solution instead of distilled water — concentration would not halve.
- Transferring a different volume (e.g. 10 cm³ instead of 15 cm³).
- Forgetting to label the resulting concentrations (1% and 0.5%).
Things to Be Careful About
- Each beaker must end up containing 30 cm³ in total.
- The transferred volume (15 cm³) must equal the volume of water added (15 cm³) for the concentration to halve exactly.
You will need to test the different concentrations of glucose, as well as S1 and S2, with Benedict’s solution.
Decide the volumes of solutions you will use in your investigation.
Complete the table.
| solution | volume / |
|---|---|
| Benedict’s | |
| glucose solutions | |
| S1 | |
| S2 |
Answer
| solution | volume / cm³ |
|---|---|
| Benedict's | 4 |
| glucose solutions | 4 |
| S1 | 4 |
| S2 | 4 |
Benedict's = 4 cm³; all glucose solutions (including S1 and S2) = 4 cm³.
Background Concept
For a fair comparison, the volume of Benedict's solution and the volume of glucose solution must be the same in every test. Any difference in time-to-colour-change must be due only to the concentration of glucose, not to differing volumes.
Understanding the Question
You must fix the volume of each solution to be used in the second part of the investigation (testing 4%, 2%, 1%, 0.5% glucose, plus S1 and S2). You have already chosen the volume of Benedict's in (a)(i) and you have been told to use 4 cm³ of G for each temperature.
Approach
Keep every volume the same as in (a)(i) so the test is identical apart from the concentration of glucose.
Step-by-Step Reasoning
- Benedict's: same volume as chosen in (a)(i) — i.e. 4 cm³.
- Each glucose solution (4%, 2%, 1%, 0.5%): 4 cm³ (as stated in the procedure).
- S1 and S2: also 4 cm³ — the same as every other glucose solution so the comparison is fair.
Key Takeaways
- Standardising volumes is part of controlling variables.
- The volume of every glucose solution must be the same as the volume of G used earlier.
Common Mistakes
- Using a different volume of Benedict's here from the one chosen in (a)(i).
- Using a different volume for S1 or S2 than for the other glucose solutions — the comparison would then be invalid.
Things to Be Careful About
- All four volumes in the table must match the value of G (4 cm³) so that every comparison is between equal volumes.
Proceed as follows:
- Prepare all the concentrations of glucose solution as shown in Fig. 1.1 in the containers provided.
- Set up a water-bath and maintain it at the temperature you decided in (a)(iv).
- Test the four concentrations of glucose solution and S1 and S2 to compare the concentration of glucose.
- Record your results in (vii) on page 7.
Prepare the space below and record your results.
Answer
| glucose solution | time / s |
|---|---|
| 4% (G) | 22 |
| 2% | 50 |
| 1% | 100 |
| 0.5% | 200 |
| S1 | 75 |
| S2 | 150 |
(Times are representative — actual student readings will vary. Headings must be underlined, columns separated by a line, and units included.)
See working — six times recorded (whole seconds) showing highest concentration (4%) shortest and lowest (0.5%) longest.
Background Concept
In the Benedict's test, the higher the concentration of reducing sugar, the faster the brick-red colour appears (because there is more sugar to reduce the Cu²⁺ ions). The relationship is approximately inverse: doubling the glucose concentration roughly halves the time to first colour change.
Understanding the Question
At the temperature you selected in (a)(iv), you must test the four concentrations you prepared (4%, 2%, 1%, 0.5%) plus the two unknowns S1 and S2, and record the time to first colour change for each.
Approach
Build a single results table with two columns: the glucose solution (label or concentration) and the time in seconds. Record six values in whole seconds. Expect the time to increase as concentration decreases.
Step-by-Step Reasoning
- A correctly formatted table requires headings (underlined) with units:
glucose solutionandtime / s. - Six rows are needed: 4%, 2%, 1%, 0.5%, S1, S2.
- Each time is recorded as a whole number of seconds.
- The expected trend is that 4% gives the shortest time and 0.5% gives the longest; S1 and S2 fall between the standards according to their concentrations.
- Representative times at 90 °C: 4% = 22 s, 2% = 50 s, 1% = 100 s, 0.5% = 200 s, S1 = 75 s (between 1% and 2%), S2 = 150 s (between 0.5% and 1%).
Key Takeaways
- Time to first colour change is inversely related to glucose concentration.
- Whole seconds only — partial seconds are not credited.
- The six results must show a sensible trend: highest concentration → shortest time.
Common Mistakes
- Recording only some of the six values (e.g. omitting S1 or S2).
- Recording times in minutes or in decimal seconds.
- Forgetting to underline the column headings.
- A trend in which a more concentrated solution takes longer than a less concentrated one.
Things to Be Careful About
- Use the same temperature throughout — that is the point of selecting it in (a)(iv).
- The times must be recorded as the first appearance of colour at the top of the mixture.
Complete Fig. 1.2 below to show:
- each percentage concentration of glucose solution (the concentration of G is shown)
- where the samples S1 and S2 fit in the series of concentrations.

Answer
The intermediate tick marks on the number line are labelled 0.5, 1.0, 1.5, 2.0, 2.5, 3.0, 3.5 (each tick represents 0.5%, so the standards are at 4% (G), 2%, 1% and 0.5%). S1 is placed at approximately 1.3% (its measured time of 75 s fell between the 1% standard at 100 s and the 2% standard at 50 s). S2 is placed at approximately 0.7% (its measured time of 150 s fell between the 0.5% standard at 200 s and the 1% standard at 100 s).
(Positions of S1 and S2 are student-dependent — place them according to your own times from (a)(vii).)
Standards at 0.5, 1.0, 2.0 (each tick = 0.5%); S1 ≈ 1.3% and S2 ≈ 0.7% (student-dependent).
Background Concept
Because the time to first colour change is inversely related to glucose concentration, the concentration of an unknown can be estimated by finding where its time falls relative to the times for known standards. On a linear concentration scale, the standards are at evenly spaced positions and the unknown lies between whichever two standards its time falls between.
Understanding the Question
You must extend the number line in Fig. 1.2 to show every standard concentration (4%, 2%, 1%, 0.5%) and then mark the position of S1 and S2 based on their measured times.
Approach
Work out the spacing first (each tick = 0.5%), label the standards, then interpolate the unknowns.
Step-by-Step Reasoning
- The number line goes from 0 to 4 with eight equal intervals (one tick mark at the start, seven more in between, plus the 4 mark at the end). Each tick therefore represents 0.5% concentration.
- Label the tick marks: starting from 0, the labels are 0.5, 1.0, 1.5, 2.0, 2.5, 3.0, 3.5; the value 4 is already labelled G.
- The four standards are now at the right positions (4% at G, 2% at the tick four from the right, 0.5% at the tick one from the right, and 1% halfway between).
- For S1 and S2, find their times in (a)(vii) and decide which two standards their time falls between.
- Representative example: S1 at 75 s lies between 1% (100 s) and 2% (50 s); closer to 2% because 75 is further from 100. Linear interpolation: 2% − (75 − 50)/(100 − 50) × 1% = 2% − 0.5% = 1.5%; or, by inverse proportionality, somewhere around 1.3%.
- S2 at 150 s lies between 0.5% (200 s) and 1% (100 s); about halfway, so around 0.7%.
- Mark S1 and S2 on the line at the corresponding positions with an arrow and label.
Key Takeaways
- Standards must be placed at evenly spaced positions on a linear scale.
- Unknowns are placed by interpolating between the standards whose times bracket the unknown.
- The marker for an unknown must lie between the two bracketing standards.
Common Mistakes
- Using an uneven scale (e.g. one tick = 1%) — would place the 2% standard wrongly.
- Placing S1 or S2 outside the range of the standards.
- Placing them at guessed concentrations instead of using the times to interpolate.
Things to Be Careful About
- The positions are STUDENT-DEPENDENT — they depend entirely on the times measured in (a)(vii).
- If the time for S1 was equal to that of the 1% standard, S1 must be placed at the 1% mark.
Describe three modifications to this investigation which would improve the confidence in your results.
Answer
- Repeat each test (e.g. three times) and calculate a mean time to reduce the effect of random timing errors.
- Use a thermostatically-controlled water-bath so that the temperature remains constant throughout each test instead of dropping as the tube is added.
- Place a white card or tile behind the test-tube so that the first appearance of the colour change is easier to see and less likely to be missed.
- Repeat and take a mean. 2. Use a thermostatically-controlled water-bath. 3. Use a white card or tile behind the tube to see the colour change clearly.
Background Concept
The confidence in a set of results depends on controlling variables, repeating measurements to reduce random error, and using techniques that make the observation as accurate as possible. Vague answers like "be more careful" do not improve the procedure; specific modifications do.
Understanding the Question
You must describe THREE modifications that would improve the confidence in your results — i.e. make them more repeatable, more reproducible, or closer to the true value.
Approach
For each modification, state specifically WHAT would be changed and WHY it would help. Match each suggestion to a concrete weakness in the procedure you actually carried out.
Step-by-Step Reasoning
Possible improvements, each tied to a specific weakness:
-
Repeat each test and take a mean. Reduces the effect of random timing errors (e.g. hesitation starting the stopwatch). Improves reliability.
-
Use a thermostatically-controlled water-bath. The water-bath used in the practical is heated by a Bunsen burner / electric heater and is not thermostatically controlled — its temperature drifts when cold tubes are added. A thermostat keeps the temperature constant throughout each test.
-
Use a white card or tile behind the test-tube. The first appearance of the green/yellow colour against the blue background can be missed; a white background provides contrast and makes the colour change easier to detect.
-
Test each concentration in its own tube separately, rather than carrying out multiple reactions at once. Prevents timing errors caused by the need to watch several tubes at the same time.
-
Use a wider range of glucose concentrations (or smaller intervals between them). Gives more standards to interpolate against, improving the accuracy of the S1 and S2 estimates.
Any three of the above are credited.
Key Takeaways
- Improvements must be SPECIFIC (named technique or apparatus), not vague.
- Each improvement should be paired with the weakness it addresses.
- Common categories: repetition, temperature control, observation technique, range of standards.
Common Mistakes
- Vague answers such as "be more careful" or "do it again" — these do not improve the procedure.
- Repeating the same idea three times in different words (e.g. "repeat three times", "do more repeats", "take a mean").
- Suggesting an improvement that changes the variable being investigated (e.g. "use different glucose concentrations" — but this is fine for (a)(viii) purposes, only NOT for (a)(ii)).
Things to Be Careful About
- Choose improvements that are realistic in a school lab (e.g. a colorimeter is rarely available, so "use a colorimeter" is unlikely to be credited unless the lab actually has one).
A systematic error occurs when apparatus with scales are used, since the scales may be slightly different.
For example, when measuring the same line, two rulers may give different lengths. However, as long as the same ruler is used for all the measurements, the trend is not affected because the error is consistent.
State one piece of apparatus used in this investigation that may have a systematic error. Suggest whether this affected your results and give a reason for your answer.
apparatus = ______
reason = ______
Answer
apparatus = thermometer
reason = the SAME thermometer was used for all four temperatures, so any calibration error was consistent across measurements and did not affect the trend (the trend would only be affected if a DIFFERENT thermometer had been used).
Thermometer (or syringe or stopwatch) — no effect on the trend because the same apparatus was used for all measurements, so any systematic error was consistent.
Background Concept
A systematic error is a consistent error in the same direction caused by a fault in the apparatus or method (e.g. a miscalibrated thermometer that always reads 2 °C high). As long as the SAME faulty apparatus is used throughout an investigation, all readings are shifted by the same amount and the TREND is unaffected — although individual values may be wrong.
Understanding the Question
You must identify ONE piece of apparatus used in this investigation that COULD have a systematic error, state whether this error affected YOUR results, and give a reason.
Approach
Pick a measuring instrument used throughout: the thermometer, the syringe, or the stopwatch. State whether the same instrument was used for all measurements. If yes, the systematic error (if any) is the same for every reading and the trend is unaffected.
Step-by-Step Reasoning
- A thermometer that is miscalibrated (e.g. reads 1 °C high) would give every measured temperature an error in the same direction. If the same thermometer is used for all four temperatures, every reading is shifted by the same amount and the trend (time decreasing as temperature rises) is unchanged.
- A syringe whose scale is slightly off would deliver a slightly inaccurate volume each time. As long as the same syringe is used for every test, all volumes are equally affected and the comparison is still fair.
- A stopwatch that runs slow or fast would do so consistently, so all times are shifted by the same factor — the order of the times (and therefore the trend) is preserved.
- The systematic error WOULD affect the results only if a DIFFERENT instrument was used for different measurements (e.g. swapping a syringe midway through) — then the volumes would not be comparable.
Key Takeaways
- A systematic error affects accuracy but not necessarily the trend.
- Using the SAME apparatus throughout makes systematic errors consistent and therefore harmless to the trend.
- Random errors (variation between repeats) are a separate problem addressed by repeating.
Common Mistakes
- Naming an item that has no scale and cannot have a systematic error (e.g. "beaker", "test-tube").
- Saying the systematic error did affect the trend without explaining why.
- Confusing systematic error with random error.
Things to Be Careful About
- The apparatus must actually be used in the procedure (the thermometer, syringe and stopwatch are all used).
- The reason must mention the use of the SAME apparatus for ALL measurements to earn credit.
The rest of this paper
1 more questions- Q2Use of the Light Microscope · Presentation of Data and Observations22M