Biology 9700/36 — October/November 2013
Cambridge AS Level · Advanced Practical Skills · worked solutions for every part, with the mark scheme
Topics Presentation of Data and Observations · Analysis, Conclusions and Evaluation · Manipulation, Measurement and Observation · Use of the Light Microscope
The enzyme amylase catalyses the hydrolysis (breakdown) of starch to a reducing sugar.
You are required to:
- identify which solution, E1 or E2 contains the highest enzyme concentration by estimating the concentration of reducing sugar produced by the action of E1 and E2 when breaking down starch
- prepare known concentrations of reducing sugar solutions to compare with the concentrations of reducing sugars produced by the action of E1 and E2
- compare the concentrations of reducing sugars by using the Benedict’s test.
For each of your Benedict’s tests you need to standardise the:
- volume of Benedict’s solution
- volume of the samples
- temperature of the water bath.
State the:
volume of Benedict’s solution = ______
volume of each of the samples to be tested = ______
temperature of water bath = ______
You are provided with:
| labelled | contents | hazard | volume / |
|---|---|---|---|
| E1 | amylase solution | harmful irritant | 20 |
| E2 | amylase solution | harmful irritant | 20 |
| S | starch solution | none | 50 |
| G | 0.4% reducing sugar solution | none | 50 |
| W | distilled water | none | 100 |
Read steps 1 to 6 before proceeding.
Proceed as follows:
- Put of E1 and E2 into separate beakers.
- Put of S into each of the beakers with E1 and E2. Mix well.
- Leave the beakers for 15 minutes.
During the 15 minutes you are required to:
- set up a water bath ready for step 6 (on page 4)
- prepare the known concentrations of the reducing sugar solution.
- Set up the water bath to heat to the temperature as decided in (a)(i).
Decide which concentrations of the reducing sugar solution to make:
- using serial dilution
- using of the 0.4% reducing sugar solution, G, to start the serial dilution
- reducing the concentration by half between each concentration.
Complete Fig. 1.1 to show how you will make three further concentrations.
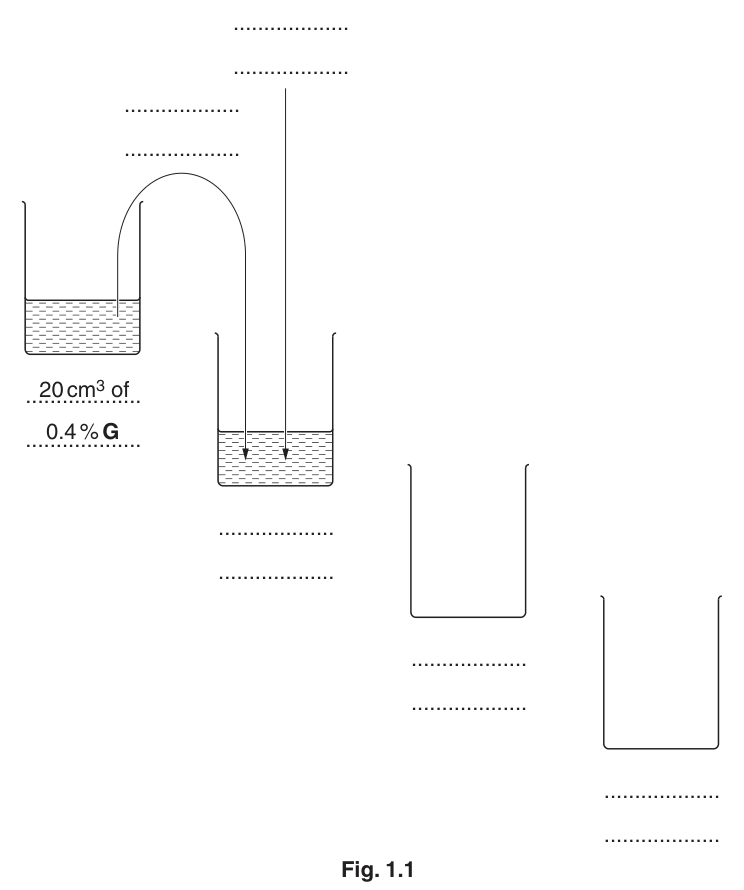
- Prepare all the concentrations of the reducing sugar solution, as in Fig. 1.1, in the containers provided.
- You are now required to test for the concentrations of reducing sugars by using the Benedict’s test:
- test each sample separately using the volumes decided in (a)(i)
- record the time taken for the appearance of any colour change. If there is no colour change after 120 seconds record ‘more than 120’.
Prepare the space below and record only your results for the known concentrations of reducing sugars.
Using your results for E1 and E2 complete the following.
The time taken for the first colour change in E1 was ______ .
The time taken for the first colour change in E2 was ______ .
Using these two times, state which of these two solutions has the highest concentration of reducing sugars.
..................................................................................................................................
Using the results from (a)(iii) estimate the concentration of reducing sugars in this solution.
..............................................................................................................................
Describe how you would modify this investigation to follow the time course of the hydrolysis of starch by enzyme E, without the use of Benedict’s solution.
A student investigated the effect of iron sulfate on the rate of amylase activity, using immobilised amylase in alginate beads.
The student prepared two types of alginate beads containing amylase:
- with iron sulfate
- without iron sulfate.
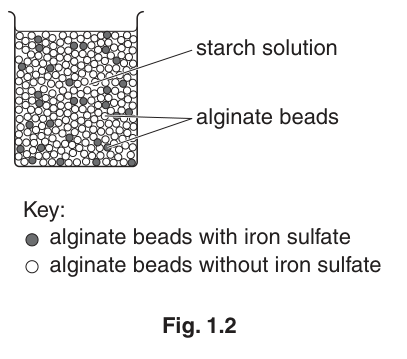
The student mixed the two types of beads together in varying proportions, for example 30 beads with iron sulfate and 70 beads without iron sulfate (30% with iron sulfate) as shown in Fig. 1.2. The student put the beads into beakers containing starch solution.
Other variables were considered and kept to a standard.
The student measured the mass of reducing sugars produced by each mixture of beads in one minute.
The student’s results are shown in Table 1.1.
Table 1.1
| percentage of beads with iron sulfate | mass of reducing sugar produced / |
|---|---|
| 0 | 60 |
| 10 | 25 |
| 20 | 12 |
| 30 | 5 |
| 40 | 2 |
Plot a graph of the data shown in Table 1.1.

Describe the trend shown by the data.
Explain the reason for the difference in the results between 0 and 10 percentage of beads with iron sulfate.
The rest of this paper
1 more questions- Q2Use of the Light Microscope · Presentation of Data and Observations · Analysis, Conclusions and Evaluation19M