Biology 9700/34 — October/November 2013
Cambridge AS Level · Advanced Practical Skills · worked solutions for every part, with the mark scheme
Topics Presentation of Data and Observations · Analysis, Conclusions and Evaluation · Manipulation, Measurement and Observation · Use of the Light Microscope
You are provided with an extract from plant cells, which contains a mixture of biological molecules.
This extract may contain any of the biological molecules, for example lipids, proteins or types of carbohydrates.
Visking tubing, V, is selectively permeable, similar to a cell membrane, so that some biological molecules will diffuse through the wall of the tubing.
You are required to investigate the diffusion of biological molecule(s) into the water surrounding the Visking tubing.
State which biological molecule(s) might diffuse through the wall of the Visking tubing.
[1]
You are provided with:
| labelled | contents | hazard | volume / |
|---|---|---|---|
| P | solution of plant extract | none | 15 |
| W | distilled water | none | 100 |
| labelled | details |
|---|---|
| V | 15 cm length of Visking tubing in a beaker containing water |
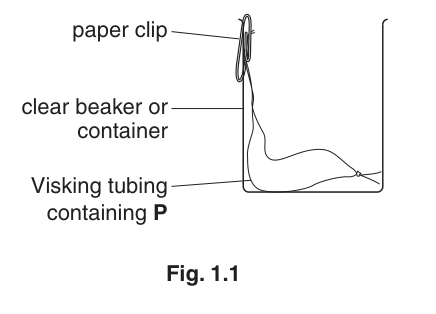
Fig. 1.1 shows the set-up of the apparatus.
You must now read up to the end of step 11 before proceeding.
Samples of the water surrounding the Visking tubing will be removed at 5 minute intervals for 15 minutes.
To compare the diffusion of any single biological molecule at each 5 minute interval the test for the biological molecule needs to be standardised.
For example, if you carried out the test for reducing sugars:
- one standardised variable is the volume of sample removed from water, e.g.
- the dependent variable is measuring the time taken for the first colour change to appear.
State the other variables which would need to be standardised for the reducing sugars test, using only the reagents and apparatus provided.
Describe how you will standardise each variable.
[3]
Decide:
- the test (or tests) you will carry out on the water
- the volume of the water you will need to sample for the test (or tests) at each time interval.
You may find it helpful to calculate the total volume of water needed for all the tests.
Draw on Fig. 1.1 (on page 4) the level of the water:
- before you remove any samples (label this 'before')
- after the total volume of water needed to sample for all the tests has been removed (label this 'after').
[2]
Proceed as follows:
- Tie a knot in the Visking tubing as close as possible to one end so that it seals the end.
- To open the other end, wet the Visking tubing and rub the tubing gently between your fingers.
- Put of P into the open end of the Visking tubing.
- Rinse the outside of the Visking tubing by dipping it into the water in the container labelled V.
- Put the Visking tubing into a small beaker or container as shown in Fig. 1.1.
- Make sure the open end of the Visking tubing is held in place by a paperclip.
You will start timing as soon as you add W.
Read steps 7 to 11 before proceeding.
- Put W into the small beaker to the level you decided in (iii).
- Immediately start timing and remove the first sample of water into a separate container to keep for the tests.
- After 5 minutes, remove the next sample into a different container.
- Repeat step 9 for two more samples.
- Use the reagents and apparatus provided to identify the biological molecule(s) that you decided in (a)(i) may be present in the samples.
Prepare the space below and record your results.
[5]
Use the results from (iv) to complete the hypothesis:
The Visking tubing allows ______ to diffuse into the surrounding water.
[1]
Explain how the results support your hypothesis.
[1]
Predict the trend in the results if the time was extended from 15 minutes to 30 minutes.
[1]
Suggest how you would modify this investigation to investigate the concentration of reducing sugars in P.
[3]
Some scientists investigated the total sugar content of plant extracts from different types of fruit.
The results are shown in Table 1.1.
Table 1.1
| type of fruit | percentage of sugars |
|---|---|
| avocado (A) | 0.6 |
| banana (B) | 12.2 |
| kiwi (K) | 8.0 |
| lemon (L) | 2.5 |
| melon (M) | 5.9 |
Plot a chart of the data shown in Table 1.1.
[4]
[Total: 21]
The rest of this paper
1 more questions- Q2Use of the Light Microscope · Analysis, Conclusions and Evaluation · Presentation of Data and Observations19M