Biology 9700/33 — October/November 2013
Cambridge AS Level · Advanced Practical Skills · worked solutions for every part, with the mark scheme
Topics Analysis, Conclusions and Evaluation · Presentation of Data and Observations · Manipulation, Measurement and Observation · Use of the Light Microscope
Lipase is an enzyme which catalyses the hydrolysis (breakdown) of triglycerides into fatty acids and glycerol.
The substrate for lipase will be the triglycerides present in milk, labelled M.
The end-point of this hydrolysis can be determined by using an indicator, P, which changes colour when the fatty acids are produced as shown in Fig. 1.1.
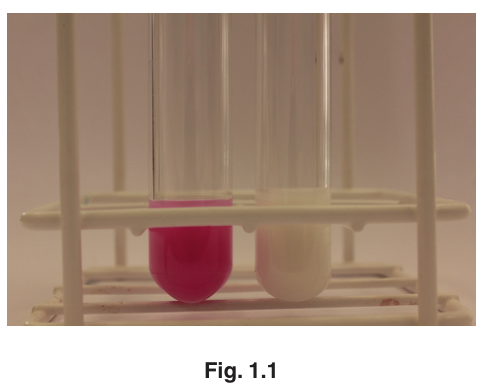
Fig. 1.1
You are required to investigate the effect of substrate concentration in M (independent variable) on the lipase-catalysed reaction.
You are provided with:
| labelled | contents | hazard | volume / |
|---|---|---|---|
| M | milk | none | 70 |
| W | distilled water | none | 100 |
| A | alkali solution | irritant | 100 |
| P | indicator solution | flammable | 10 |
| E | lipase solution | irritant | 20 |
Proceed as follows:
You may assume that the triglyceride content of the milk, M, is 5%.
You are required to dilute this 5% milk, M, to provide a range of known concentrations of triglycerides using simple dilution.
Decide which three further concentrations of triglycerides to make, then complete Table 1.1.
- The difference between each concentration should be 1%.
- You will need to make up of each concentration.
Table 1.1
| volume of milk solution / | volume of distilled water / | percentage concentration of triglycerides in milk |
|---|---|---|
| 20 | 0 | 5 |
State the concentration of triglycerides which you would expect to reach the end-point (pink to white) in the shortest time.
concentration = ______
- Prepare all the concentrations of triglycerides as in Table 1.1 in the containers provided.
- Put of A into each of the concentrations which you prepared in step 1 and mix well.
- Put of each mixture, as made in Step 2, into separate test-tubes.
- Put five drops of P into each of the test-tubes and gently shake so that all the mixture turns pink. (Note that each of the concentrations might not be the same shade of pink).
- Set up a water-bath and adjust the temperature of the water to between and . You will need to add hot water/cold water to maintain the temperature of the water-bath between and for steps 6 to 9.
- Put the test-tubes from Step 4 into the water-bath for five minutes.
- Put of M in a test-tube to act as a standard to help you recognise the end-point. Put this test-tube in the water-bath.
When you start the timer after adding E to the first test-tube in Step 8, you must not stop the timer at any of the end-points, just record the time.
The reaction will start as soon as you add E, so read steps 8 to 13 before proceeding.
Continue as follows:
- Put of E into the test-tube containing the lowest concentration of triglycerides and mix well, then return it to the water-bath.
- Start timing and record start time on Fig. 1.2.
- Immediately, put of E into the next test-tube containing next highest concentration of triglycerides and mix well, then return it to the water-bath.
- Record start time on Fig. 1.2.
- Immediately repeat steps 10 and 11 for the remaining concentrations.
- Observe the four test-tubes and record the time on Fig. 1.2 when each end-point is reached. This is your raw data.
Using the colour of M may help you recognise the end-point.
If the time taken to reach the end-point for any one concentration is longer than 5 minutes record 'more than 300'.
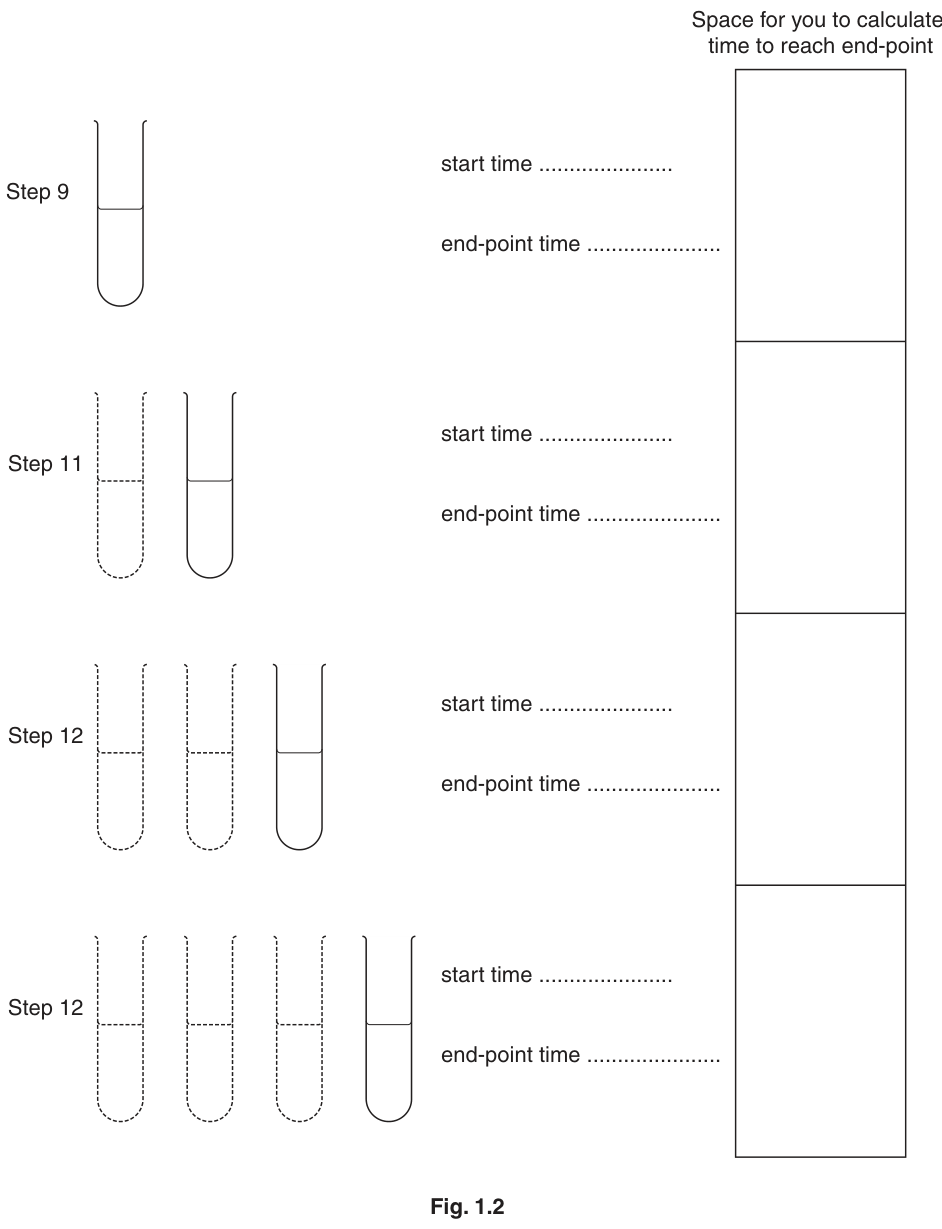
Fig. 1.2
From your timer readings you will be required to calculate the time taken to reach the end-point in each test-tube.
- Process your raw data to find the time taken to reach the end-point for each concentration (these are your processed results).
If you have time check your results.
Prepare the space below to record your processed results.
Calculate the rate of lipase activity for the 5% concentration of triglycerides.
rate = ______
Describe how you could set up a control for this investigation using the apparatus provided.
Identify one significant source of error in this investigation.
Some scientists investigated the effect of the triglycerides in different types of milk (independent variable) on the time taken to reach the end-point. They used the same method as in your investigation.
The results are shown in Table 1.2.
Table 1.2
| type of milk | time taken to reach the endpoint / s |
|---|---|
| full fat (F) | 130 |
| evaporated (V) | 120 |
| low fat (L) | 215 |
| condensed (C) | 150 |
| dried (D) | 265 |
Plot a chart of the data shown in Table 1.2.

Suggest one reason for the difference in the time taken to reach the end-point between evaporated milk (V) and dried milk (D).
A student carried out an investigation into the effect of immobilised lipase on the hydrolysis of triglycerides in milk. The student used the apparatus in Fig. 1.3.
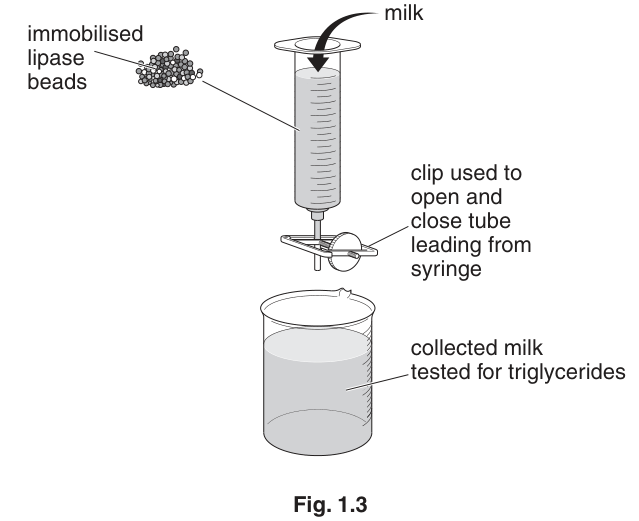
Fig. 1.3
Identify two variables that the student would need to standardise to compare the activity of different concentrations of lipase immobilised in alginate beads.
Describe how one of these variables would be standardised.
The rest of this paper
1 more questions- Q2Use of the Light Microscope · Presentation of Data and Observations · Analysis, Conclusions and Evaluation22M