Biology 9700/31 — October/November 2013
Cambridge AS Level · Advanced Practical Skills · worked solutions for every part, with the mark scheme
Topics Presentation of Data and Observations · Analysis, Conclusions and Evaluation · Manipulation, Measurement and Observation · Use of the Light Microscope
Agar pieces can be used to investigate diffusion.
You are required to investigate the effect of ascorbic acid (independent variable) diffusing into stained agar pieces.
As ascorbic acid, A, diffuses into the stained agar piece it causes the piece to decolourise (lose its blue colour).
You are provided with:
| labelled | contents | hazard | volume / |
|---|---|---|---|
| A | 0.10% ascorbic acid | irritant | 100 |
| W | distilled water | none | 100 |
| labelled | contents | hazard | size |
|---|---|---|---|
| U | agar block containing a blue stain | none | at least |
Read steps 1–6 before proceeding.
Proceed as follows:
- You are required to dilute the 0.10% ascorbic acid, A, to provide a range of known concentrations using simple dilution.
Decide which concentrations of ascorbic acid to make, then complete Table 1.1.
- The difference between each concentration should be 0.02%.
- You will need to make up of each concentration.
Table 1.1
| volume of ascorbic acid / | volume of distilled water / | percentage concentration of ascorbic acid |
|---|---|---|
| 20 | 0 | 0.10 |
Prepare all the concentrations of ascorbic acid as in Table 1.1 in the beakers or containers provided.
You will need to cut the agar block, U, into smaller pieces as shown in Fig. 1.1.
To avoid staining your skin, try not to touch the agar.
You may use the blunt forceps and paper towels to handle the agar.
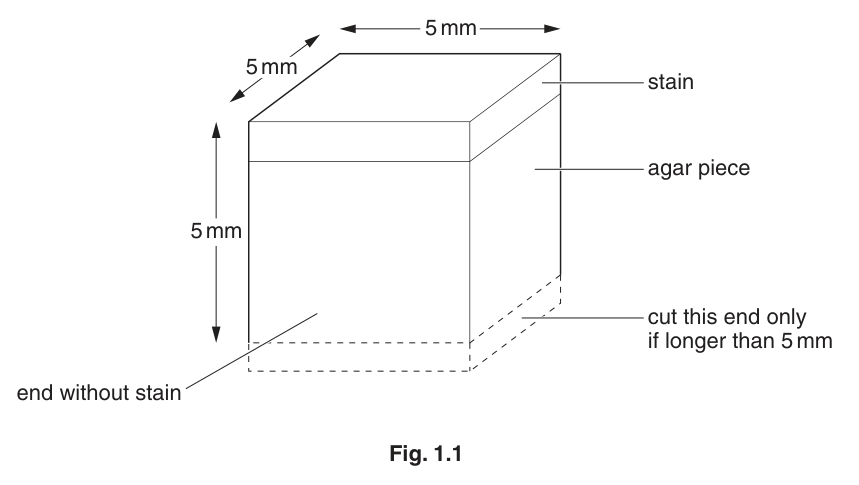
- Place the agar block onto a damp paper towel and cut the block into identical pieces of as shown in Fig. 1.1.
You will need to consider the number of pieces needed for each concentration of ascorbic acid you have stated in Table 1.1 on page 3.
Fig. 1.1 shows the measurement of the agar pieces that you need. - Put the prepared agar pieces into each of the concentrations of ascorbic acid. Immediately start timing.
- Gently stir the contents of each beaker or container at regular intervals.
- Record the time taken for the pieces to decolourise.
After 15 minutes, if any agar piece has not decolourised, stop timing, and record ‘more than 900’.
Prepare the space below and record your results.
Identify two significant sources of error in this investigation.
Describe three modifications to this investigation which would improve the confidence in your results.
A student investigated measuring the concentration of ascorbic acid in different solutions by using a colour change with an indicator.
The greater the volume of indicator added the greater the concentration of ascorbic acid in the solution.
The student’s results are shown in Table 1.3.
Table 1.3
| percentage concentration of ascorbic acid | volume of indicator / |
|---|---|
| 0.10 | 0.25 |
| 0.30 | 0.75 |
| 0.60 | 1.45 |
| 0.70 | 1.75 |
| 1.00 | 2.50 |
Plot a graph of the data shown in Table 1.3.

Use your graph to estimate the concentration of ascorbic acid present in a solution that required of indicator.
Show clearly on your graph how you obtained the ascorbic acid concentration.
concentration of ascorbic acid = ______
The rest of this paper
1 more questions- Q2Use of the Light Microscope · Analysis, Conclusions and Evaluation · Presentation of Data and Observations21M