Biology 9700/35 — May/June 2013
Cambridge AS Level · Advanced Practical Skills 1 · worked solutions for every part, with the mark scheme
Topics Presentation of Data and Observations · Analysis, Conclusions and Evaluation · Manipulation, Measurement and Observation · Use of the Light Microscope
You are reminded that you have only one hour for each question in the practical examination.
You should:
- read carefully through the whole of Question 1 and Question 2
- then plan your use of the time to make sure that you finish all the work that you would like to do.
You will gain marks for recording your results according to the instructions.
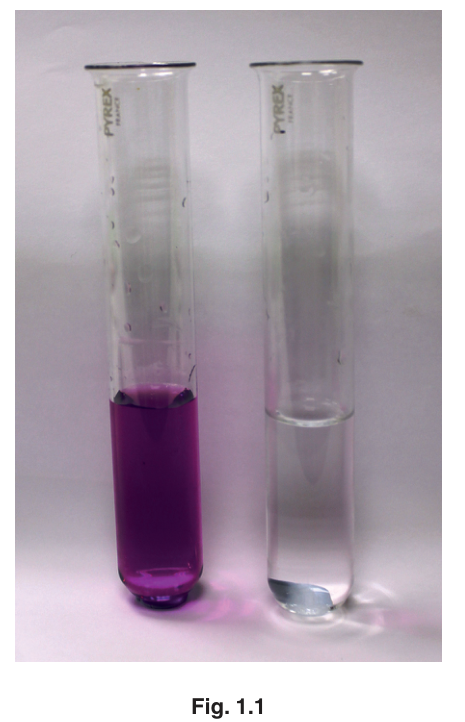
Glucose solutions change the colour of pink potassium manganate(VII) solution, PM.
Fig. 1.1 shows the colour change from pink to the colourless end-point.
The rate of the colour change depends on the concentration of the glucose solution.
The greater the concentration of glucose solution the faster the end-point is reached.
You are required to:
- make different concentrations of glucose solution
- find, for each glucose solution, the time taken for PM to change to colourless
- estimate the unknown concentrations of the glucose solutions, U1 and U2.
You are provided with:
| labelled | contents | hazard | volume / |
|---|---|---|---|
| G | 20% glucose solution | none | 100 |
| W | distilled water | none | 200 |
| S | sulfuric acid | harmful | 40 |
| PM | potassium manganate(VII) solution | harmful | 20 |
| U1 | glucose solution | none | 20 |
| U2 | glucose solution | none | 20 |
Sulfuric acid and potassium manganate(VII) solution are harmful.
If any comes into contact with your skin, wash immediately under cold water.
It is recommended that you wear safety goggles/glasses.
Proceed as follows:
- Using the 20% glucose solution, G, as a starting concentration you are required to make up of each of four different concentrations of glucose solutions, 6%, 8%, 10%, 12%.
Complete Table 1.1 to show how you will make the four glucose solutions 6%, 8%, 10% and 20%.
Table 1.1
| volume of 20% glucose solution / | volume of distilled water / | final percentage concentration of glucose |
|---|---|---|
| 6 | ||
| 8 | ||
| 10 | ||
| 12 | 8 | 12 |
- Make all the glucose solutions as in Table 1.1, in the containers provided.
- Put of each glucose solution into four separate test-tubes.
- Using the syringe labelled S, put of S into each test-tube. Insert the bung and, with your finger holding the bung in place, gently mix the solution in each test-tube. Do not turn the test-tube upside-down.
When adding PM to the first glucose solution, you must not stop the timer, just record the time. When adding PM to the other glucose solutions, or at any of the end-points, do not stop the timer, just record the time.
From your timer readings you will be required to calculate the time taken to reach the end-point in each test-tube.
Answer
| volume of 20% glucose solution / | volume of distilled water / | final percentage concentration of glucose |
|---|---|---|
| 6 | 14 | 6 |
| 8 | 12 | 8 |
| 10 | 10 | 10 |
| 12 | 8 | 12 |
6 cm³ glucose + 14 cm³ water = 6%; 8 cm³ glucose + 12 cm³ water = 8%; 10 cm³ glucose + 10 cm³ water = 10% (12% row already given).
Background Concept
A dilution keeps the total amount of solute constant while increasing the total volume. The dilution equation
relates the stock concentration , the volume of stock , the desired final concentration and the final total volume . Solving for gives the volume of stock to use; the remainder of the final volume is made up with the diluent (here, distilled water W).
Understanding the Question
Table 1.1 specifies that of each of four glucose solutions (6%, 8%, 10% and 12%) must be prepared from the 20% stock G and distilled water W. The 12% row is already filled in (12 cm³ glucose + 8 cm³ water). The candidate must complete the three missing rows for 6%, 8% and 10%.
Approach
Apply the dilution equation with (the stock percentage), the target percentage, and . Calculate (volume of 20% glucose) for each target, then subtract from to get the volume of distilled water.
Step-by-Step Reasoning
For 6% glucose:
- , so of 20% glucose.
- Water .
For 8% glucose:
- , so of 20% glucose.
- Water .
For 10% glucose:
- , so of 20% glucose.
- Water .
The 12% row is already given: of stock + of water = of 12%.
Key Takeaways
- The dilution equation is the standard way to prepare a solution of known concentration from a more concentrated stock.
- The volume of diluent (water) = total volume − volume of stock.
- The candidate must give BOTH the stock volume AND the water volume for each row.
Common Mistakes
- Only giving the stock volume and forgetting the water volume (the mark scheme credits both).
- Substituting the wrong (e.g. using 12% instead of 20% as the stock).
- Writing the target concentration (6, 8, 10) in the water column instead of the actual cm³ of water.
Things to Be Careful About
- Verify that stock + water = for every row.
- Keep the unit () consistent throughout.
Consider the units of the values recorded on your timer or clock.
State the:
- smallest value which your timer or clock shows ______
- smallest unit of time you have decided to record _____
Read up to step 11 before proceeding.
Proceed as follows:
- Using the syringe labelled PM, put of PM into the test-tube containing the lowest concentration of glucose solution as shown in Fig. 1.2.
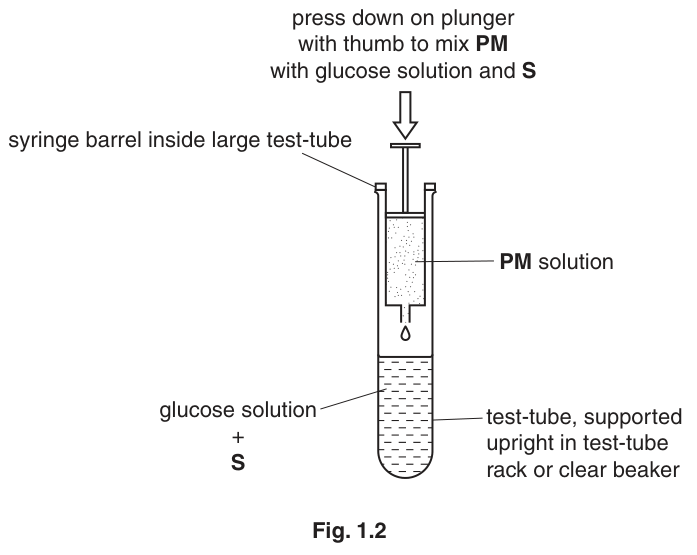
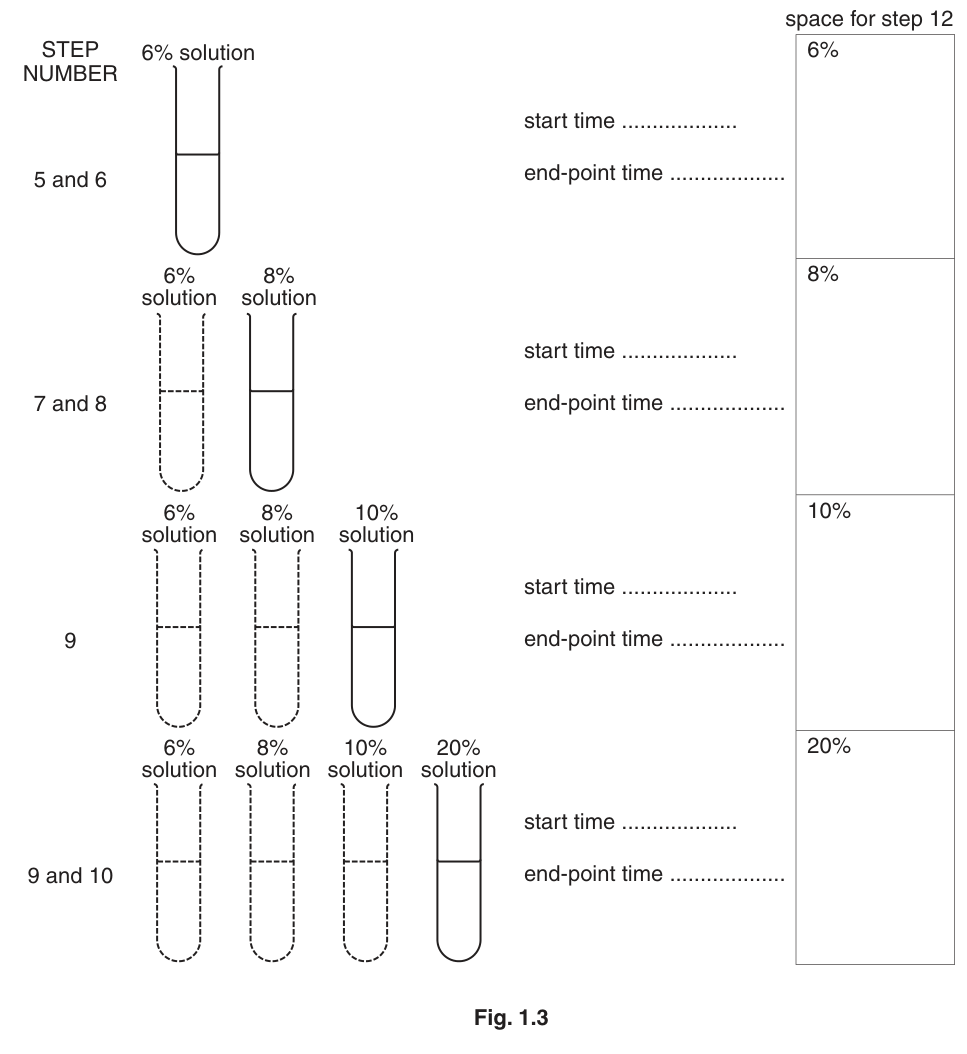
- Start timing and record the start time from your timer on Fig. 1.3 on page 5.
- Immediately, put of PM into the test-tube containing next highest concentration of glucose solution.
- Record start time from your timer on Fig. 1.3 on page 5.
- Immediately, repeat steps 7 and 8 for the remaining concentrations of glucose solution.
- Observe the four test-tubes and record the time on Fig. 1.3 when each end-point is reached.
Answer
- Smallest value the timer shows: (one second).
- Smallest unit of time to record: seconds ().
seconds (s)
Background Concept
Whenever a quantity is recorded, the unit and the precision must be stated explicitly. For time, the unit is usually seconds when the reaction is on the order of tens of seconds to minutes. The smallest value the timer can show is its display resolution; the smallest unit recorded is the precision the candidate chooses to round to.
Understanding the Question
Before the experiment starts, the candidate must state two things about the timer: (1) the smallest value it can display and (2) the smallest unit to which the candidate will round all readings. For a typical laboratory stopwatch or digital clock, both answers are 1 and seconds.
Approach
Look at the timer or clock available. The smallest division on its display is the smallest value it can show. Then decide what precision to record to. For this experiment, whole seconds is appropriate.
Step-by-Step Reasoning
A standard digital stopwatch or wall clock shows whole seconds (with smaller divisions that are not meaningful for a reaction lasting tens of seconds). The candidate will record all readings to the nearest whole second.
Key Takeaways
- Always state the unit of any measured quantity.
- The chosen precision should be sensible for the timescale of the experiment.
Common Mistakes
- Stating minutes instead of seconds (the reaction is fast enough that seconds is the appropriate unit).
- Stating "time" alone, without naming the unit.
- Confusing "smallest value shown" with "smallest value recorded".
Things to Be Careful About
- The unit must be appropriate to the timescale (seconds, not minutes, for this reaction).
You are required to estimate the glucose concentration of solutions, U1 and U2 using the same procedure.
State one variable, which you will standardise when setting up the test-tubes to find the end-points for U1 and U2.
Answer
Volume of PM (the same of potassium manganate(VII) added to each test-tube).
Volume of PM (2 cm³)
Background Concept
A fair test requires that the only thing that changes between trials is the independent variable. In this experiment the independent variable is the glucose concentration, and the dependent variable is the time for PM to turn colourless. Any other variable that could affect the time must be kept the same (standardised) for every test-tube.
Understanding the Question
The question asks for ONE variable to standardise when setting up the test-tubes for U1 and U2. The mark scheme accepts any of: the volume of S, the volume of PM, or the volume of glucose/U1/U2 solution added to each tube. The cleanest single answer is the volume of PM because, if the volume of oxidising agent differs between the U1/U2 and the standard tests, the end-point time would change independently of the glucose concentration.
Approach
Think of the variables that go into each test-tube (volumes of glucose, S, PM) and choose one that is both controllable AND able to alter the time if it were not standardised.
Step-by-Step Reasoning
- of glucose solution goes into each test-tube.
- of S is added to each.
- of PM is added to each.
The volume of PM is the cleanest single answer because it directly determines how much oxidising agent is available to be reduced, and any change in it would change the time independently of the glucose concentration.
Key Takeaways
- A standardised variable is one kept the same across all trials so that any difference in the dependent variable is due only to the independent variable.
- The cleanest variables to standardise here are the volumes of the reagents added to each test-tube.
Common Mistakes
- Stating a variable that does not actually change between trials (so does not need standardising).
- Stating a variable that is not controllable in a school lab (e.g. ambient temperature is hard to standardise reliably).
- Naming a variable that is not relevant to this experiment.
Things to Be Careful About
- The variable must be one that could plausibly differ between the U1/U2 tests and the standard tests, and that would affect the time if it differed.
Describe how you will standardise this variable.
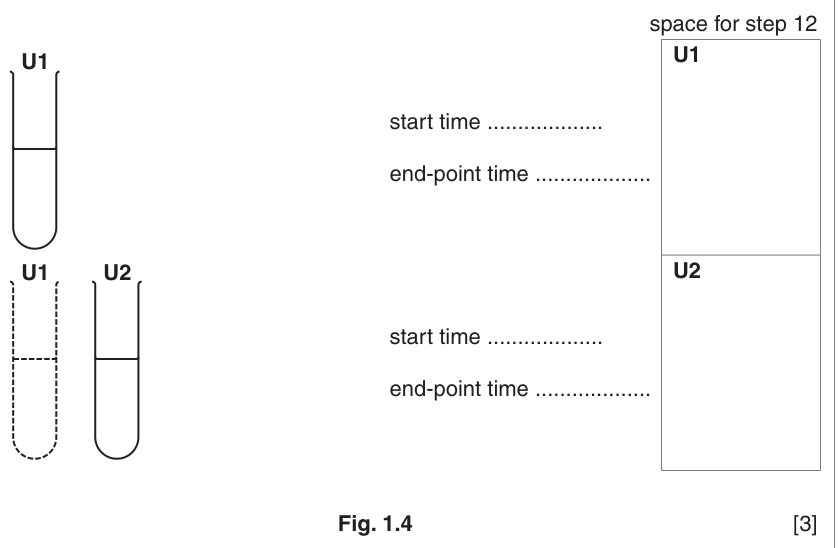
- Use the same procedure to obtain the end-points for the solutions, U1 and U2 and record your times on Fig. 1.4.
Answer
- Use a syringe to measure the same volume of PM (or S or glucose solution) for U1 and U2 as was used for the standard solutions.
- Record the start time and the end-point time for U1 and for U2 on Fig. 1.4.
- Set up U1 first so that its start time is recorded before the start time of U2.
- Record all four times (start and end-point for U1 and for U2) to the same precision (e.g. whole seconds).
Use a syringe to measure the standardised volume; record start and end-point times for U1 and U2; set up U1 before U2; read all times to the same precision.
Background Concept
A standardised variable only stays the same if it is measured and delivered in the same way each time. For small liquid volumes in a Cambridge A-level practical, the syringe is the standard apparatus because it can be read to or better. To use it accurately, draw up slightly more than needed and expel down to the required volume with the meniscus on the line.
Understanding the Question
The candidate has identified a variable to standardise in (a)(iii) and is now asked to describe how that standardisation will be enforced for the U1 and U2 tests. Four specific points earn the four marks: (1) use a syringe; (2) record the start and end-point times for U1 and U2; (3) start the timer for U1 before U2; (4) record all times to the same precision.
Approach
For each marking point, think about what the candidate is actually doing in the lab, not in the abstract. The order of operations matters: set up U1, add PM, record start; then set up U2, add PM, record start; then watch both and record end-point times.
Step-by-Step Reasoning
- A syringe is the right apparatus for measuring of PM (or of S, or of glucose solution) accurately. A measuring cylinder would be too coarse for these small volumes.
- Two readings are needed for each tube: the start time (when PM is added) and the end-point time (when the pink colour disappears). Both are written on Fig. 1.4.
- Because the procedure is the same as for the standards, U1 is set up first so that its reaction is underway before U2 is started. This is consistent with the way the standards are tested (6% first, then 8%, 10%, 20%).
- All four times (U1 start, U1 end, U2 start, U2 end) are read to the same precision — for example, whole seconds — so that they are directly comparable.
Key Takeaways
- Standardisation requires both the right apparatus (a syringe for small volumes) and the right procedure (consistent order and precision).
- A clear, ordered description earns the four marks: apparatus, recording, order, precision.
Common Mistakes
- Saying "measuring cylinder" instead of "syringe".
- Forgetting one of the four points (especially precision or order).
- Describing a different procedure from the one used for the standards (e.g. timing each tube individually — that is a modification, not a description of how the variable is standardised here).
Things to Be Careful About
- The description should match the actual lab procedure, not a generic answer.
- The order of the four points does not matter, but all four must be present for full marks.
Depending on the timer or clock you have used, you may find the following examples helpful so that you can process your results for (v) and for Step 12 to find the time taken to reach the end-point.
Example 1: using stop-clock or stopwatch
| minutes:seconds | ||
|---|---|---|
| start time | 1:24 | = 84 seconds |
| end-point time | 2:55 | = 175 seconds |
time taken to reach end-point = 91 seconds
Example 2: using clock times
| hours:minutes:seconds | ||
|---|---|---|
| start time | 9:10:00 | difference in time |
| end-point time | 9:11:31 | 1 minute 31 seconds |
time taken to reach end-point = 91 seconds
Using your results from Fig. 1.3, complete Table 1.2 to show the calculation to find the time taken for 6% glucose solution to reach the end-point.
Table 1.2
| 6% solution start time | ||
| 6% solution end-point time |
time taken to reach end-point = ______
- Use the space on Fig. 1.3 and Fig. 1.4 for processing your readings to find the time taken to reach the end-point for the other glucose solutions, and for U1 and U2.
Working
Convert each clock reading to seconds, then subtract the start time from the end-point time.
For example (using the mark-scheme example values):
- start time
- end-point time
Answer
Time taken for the glucose solution to reach the end-point = (representative example; the candidate records their own processed value in seconds).
Time taken = 91 s (representative; the candidate records their own processed value in seconds).
Background Concept
The time taken to reach the end-point is the difference between the end-point time and the start time. To subtract two clock readings, they must first be converted to the same unit (here, seconds).
Understanding the Question
The question asks the candidate to complete Table 1.2 by showing the calculation of the time taken for the 6% glucose solution. The actual numbers come from Fig. 1.3 and so are student-dependent; the format of the answer is what is being tested.
Approach
Read the start time and the end-point time for the 6% tube from Fig. 1.3, convert both to seconds, and subtract.
Step-by-Step Reasoning
Using the mark-scheme example values:
- Start time: minute seconds s.
- End-point time: minutes seconds s.
- Time taken s.
The candidate should write the start time, the end-point time, and the difference (in seconds) into Table 1.2.
Key Takeaways
- Convert both readings to the same unit before subtracting.
- The answer is reported in the chosen unit (here, seconds).
Common Mistakes
- Subtracting minutes from seconds without converting.
- Recording the end-point time itself as the answer instead of the difference.
- Not writing the unit with the final answer.
Things to Be Careful About
- The example given in the question (91 s) uses minutes:seconds; if a digital stopwatch was used, the values are already in seconds and no conversion is needed.
Using only these processed results, prepare the space below to record the time taken to reach the end-point for all six solutions.
Answer
Table of processed results (representative values):
| percentage concentration of glucose | time / s |
|---|---|
| 120 | |
| 85 | |
| 55 | |
| 30 | |
| U1 | 90 |
| U2 | 22 |
Trend: as the percentage concentration of glucose increases, the time taken to reach the end-point decreases. The glucose solution (the most concentrated standard) gives the shortest time compared with the , and solutions.
Table with headings 'percentage concentration of glucose' and 'time / s', six rows (6%, 8%, 10%, 20%, U1, U2) with whole-number times, and the 20% having the shortest time among the four standards.
Background Concept
A results table is the standard way to present processed data. The conventions the CIE mark scheme rewards are: cell boundaries drawn, a heading that names the quantity, units in the heading (not in the data cells), and data presented in a sensible order. The trend (how one variable changes with the other) should be visible from the table.
Understanding the Question
The question asks the candidate to prepare the space below the procedure to record the time taken for all six solutions (6%, 8%, 10%, 20%, U1, U2). Four marks are available: (1) a table with cells drawn and the heading percentage concentration of glucose; (2) a time / s (or time / seconds) heading; (3) whole-number processed results for all six solutions; (4) the trend that 20% (the highest concentration standard) has the shortest time compared with 6%, 8% and 10%.
Approach
Draw a two-column table. Head the first column with the independent variable (concentration) and the second with the dependent variable (time, in seconds). List the six concentrations in the first column and the processed times (in whole seconds) in the second. Make sure the 20% has the shortest time among the four standards.
Step-by-Step Reasoning
- A heading is required for the column that lists the concentrations, and that heading must name the quantity (percentage concentration of glucose). Units are not required here because the entries are percentages, but the percentage sign is fine.
- A heading is required for the time column; the unit (seconds) goes in the heading, not in the data cells.
- The candidate's actual times are student-dependent but should be whole numbers. The 20% row must have the smallest value among the four standards (because higher concentration = faster reduction of PM = shorter time).
- The trend: as concentration increases, time decreases.
Key Takeaways
- Headings carry the quantity AND the unit; data cells contain only the number.
- Processed data should be reported to a sensible precision (here, whole seconds).
- The table should make the trend visible.
Common Mistakes
- Putting units in the data cells (e.g. writing "120 s") instead of in the heading.
- Using the wrong units in the heading (e.g. ).
- Not drawing all cell boundaries.
- Including non-whole-number times (decimals are not credited).
- Missing one of the six concentrations.
- Reporting times that are inconsistent with the trend (e.g. 6% shorter than 20%).
Things to Be Careful About
- The mark scheme does NOT credit units in the data cells.
- The trend must be visible in the numbers: 20% < 10% < 8% < 6%.
Glucose solutions may be used for different purposes, for example:
Glucose tolerance test solutions, containing 25% glucose.
Sports drink solutions, containing 8% glucose.
Oral Rehydration solutions, containing 2% glucose.
Suggest which of the above solutions is U2.
Answer
Glucose tolerance test solution (containing glucose).
Glucose tolerance test solution
Background Concept
Because a higher concentration of glucose reduces the potassium manganate(VII) more quickly, there is an inverse relationship between concentration and end-point time. The unknown solution's time can therefore be compared to the times of the standard solutions to estimate its concentration, and that estimate matched to the closest named reference.
Understanding the Question
The question supplies three reference solutions: a glucose tolerance test at , a sports drink at and an Oral Rehydration Solution (ORS) at . The candidate must decide which of these matches U2.
Approach
Compare U2's processed time with the times of the standards. If U2's time is shorter than that of the standard, U2 must be more concentrated than , which fixes it as the glucose tolerance test solution.
Step-by-Step Reasoning
- The standard solutions tested are , , and , with the giving the shortest time.
- U2's processed time is shorter than the time (it sits above the highest standard), so U2 is more concentrated than .
- Of the three reference solutions, only the glucose tolerance test () is more concentrated than . The sports drink () and the ORS () are both less concentrated and would give longer times.
- Therefore U2 is the glucose tolerance test solution.
Key Takeaways
- The relationship between concentration and time is inverse in this experiment.
- An unknown can be identified by comparing its time to the standard curve (here, a simple look-up between the four standards and the three named references).
Common Mistakes
- Confusing which reference is the most concentrated (the glucose tolerance test at , not the sports drink at ).
- Comparing to the wrong standard (e.g. matching U2 to the row rather than to the named solutions).
Things to Be Careful About
- The candidate should justify the answer from the data, not just guess.
Identify one significant source of error in your investigation.
Answer
The colour change to colourless at the end-point is subjective and difficult to judge precisely, so the recorded end-point times may differ between trials.
Difficult to judge the colour change / end-point accurately (it is subjective).
Background Concept
A source of error is anything that introduces variability or bias into the measurements. The CIE mark scheme distinguishes between errors in the dependent variable (e.g. subjective end-point), errors in the standardised variables (e.g. hard-to-read syringe), errors in the procedure (e.g. inconsistent mixing), and inherent errors of the reaction (e.g. being too quick to time).
Understanding the Question
The question asks for ONE significant source of error in this investigation. The mark scheme accepts any of: a subjective end-point; difficulty reading the dark PM solution in the syringe; inconsistent mixing; or the reaction being too quick to time accurately. The cleanest single answer is the subjective end-point.
Approach
Identify the step in the procedure that is most dependent on human judgement. The end-point of the reaction is the moment the pink colour just disappears, and this transition is gradual rather than instantaneous, so different observers (or the same observer on different occasions) may judge it at slightly different times.
Step-by-Step Reasoning
- The end-point is when the pink colour of PM has fully disappeared and the solution is colourless.
- This change happens over a short interval rather than instantaneously, so the moment of "colourless" is not precisely defined.
- Consequently the recorded end-point time can vary by a few seconds between trials, even when the actual reaction rate is the same.
Key Takeaways
- Subjective end-points are a common source of error in colour-change reactions.
- The error is the variability in the recorded end-point time, not a single wrong number.
Common Mistakes
- Stating "human error" without specifying the aspect of the procedure that is affected.
- Stating an error that is not actually significant (e.g. "the room was too cold") without explaining how it affects the result.
- Naming a problem that is not specific to this experiment (e.g. "the equipment was old").
Things to Be Careful About
- The error should be specific to this experiment and have a clear cause.
- The answer must name the variable affected (e.g. the end-point time) AND give the reason (e.g. the colour change is subjective) to earn the mark.
Describe two modifications to this investigation which would improve the confidence in your results.
Answer
- Repeat each concentration at least three times and calculate a mean time — this reduces the effect of random errors in judging the end-point and gives a more reliable estimate of the true time for each concentration.
- Use a colorimeter to detect the end-point (or time each test-tube individually with its own stopwatch) — this removes the subjectivity of judging the pink-to-colourless change by eye and gives a more objective measurement of the end-point time.
Two modifications: (1) repeat each concentration at least three times to obtain a mean; (2) use a colorimeter (or time each tube individually) to detect the end-point objectively.
Background Concept
An improvement is any change to the procedure that reduces error (random or systematic) and so increases confidence in the results. CIE mark schemes usually group improvements into: better range of the independent variable, more replicates, better control of standardised variables, and more objective measurement of the dependent variable.
Understanding the Question
The question asks for TWO modifications that would improve confidence in the results. The mark scheme accepts any two of: a wider or different range of concentrations; repeating more than once to obtain three readings; or using a colorimeter (or timing each test-tube individually) to detect the end-point.
Approach
Choose two modifications that target different aspects of the experiment. The most impactful pair is usually: more replicates (improves reliability) + more objective end-point detection (improves accuracy). The mark scheme allows any two of the three credits, so any clean pair is fine.
Step-by-Step Reasoning
- Replicates. With only one reading per concentration, a single anomalous timing cannot be distinguished from a real effect. Repeating each concentration at least three times and taking a mean smooths out the random error in judging the end-point.
- Objective end-point. A colorimeter measures the absorbance of the solution and can be set to a specific transmittance threshold that defines "colourless" unambiguously. Alternatively, timing each test-tube with its own stopwatch removes the rush of trying to add PM to four tubes in quick succession and judge their end-points simultaneously.
Key Takeaways
- Replicates improve reliability (consistency) by averaging out random errors.
- Objective measurement improves accuracy (closeness to the true value) by removing human judgement.
- The two modifications should address different aspects of the experiment.
Common Mistakes
- Stating two modifications that are essentially the same (e.g. "repeat twice" and "repeat three times").
- Stating a modification that is too vague to act on (e.g. "be more careful").
- Stating an improvement that is not specific to this experiment (e.g. "use a better stopwatch" without saying why).
Things to Be Careful About
- Each modification should be specific and should clearly explain how it improves the result.
- The mark scheme awards a maximum of 2 marks for 2 modifications, so no more than two are needed.
The rest of this paper
1 more questions- Q2Use of the Light Microscope · Presentation of Data and Observations · Analysis, Conclusions and Evaluation23M