Biology 9700/34 — May/June 2013
Cambridge AS Level · Advanced Practical Skills · worked solutions for every part, with the mark scheme
Topics Presentation of Data and Observations · Analysis, Conclusions and Evaluation · Manipulation, Measurement and Observation · Use of the Light Microscope
Yeast cells use enzymes as part of their metabolic reactions. Some of these reactions release carbon dioxide.
You are required to investigate the hypothesis that:
The rate of release of carbon dioxide from yeast cells will decrease with time.
Carbon dioxide reacts with water to form a weak acid. The indicator, P, can be used to show the change in pH.
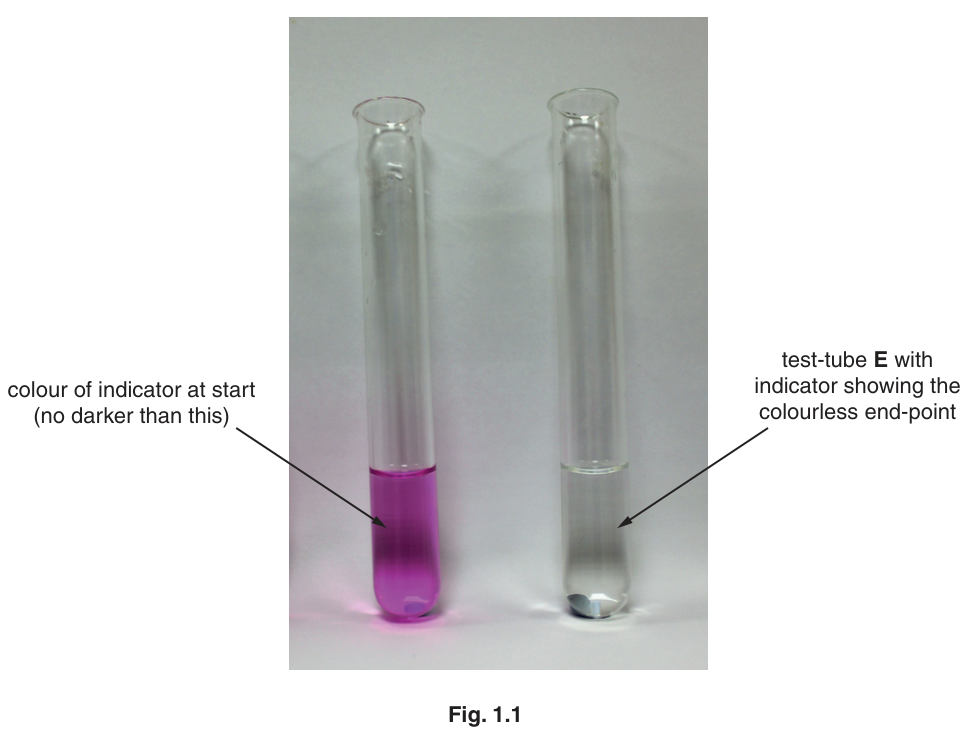
The pink indicator, P, will become colourless when carbon dioxide is added. This is the end-point as shown in Fig. 1.1.
You are provided with:
| labelled | contents | hazard | volume / |
|---|---|---|---|
| Y | yeast cell suspension | none | 20 |
| P | indicator solution | flammable | 10 |
| A | alkali solution | irritant | 20 |
| W | distilled water | none | 100 |
You will need to standardise the pink colour before you start the readings.
Proceed as follows:
- Put of W into a test-tube.
For steps 2 and 3, you must use one pipette to add the drops of P and a different pipette to add the drops of A.
-
Put 2 drops of P into the same test-tube. The solution should remain colourless. Insert the bung and with your finger holding the bung in place, mix the solution.
-
You are required to put drops of A into the solution until it becomes a pink colour. The colour should not be darker than the pink colour shown in Fig. 1.1.
Decide how you will use this test-tube to standardise the five other test-tubes you require.
State the variables which you will standardise when setting up these test-tubes to take the readings.
- Set up the five test-tubes as you have described in (i).
Describe how you standardised the colour in these five test-tubes.
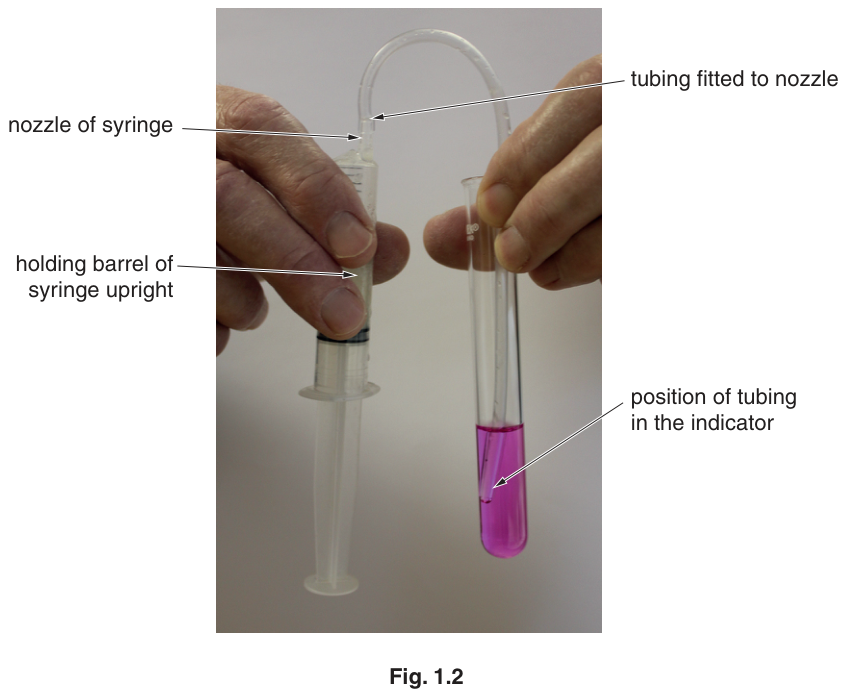
Fig. 1.2 shows how to use the apparatus provided.
The tubing from the syringe needs to reach into the test-tube so that it is below the surface of the indicator solution as shown in Fig. 1.2.
Decide how you will standardise the position of the tubing in each test-tube, without cutting the tubing. You may find Fig. 1.2 helpful.
Describe how you standardised the position of the tubing.
You are required to:
- take five readings as shown in Fig. 1.3
- leave Y in the syringe for 10 minutes
- take another five readings as shown in Fig. 1.3.
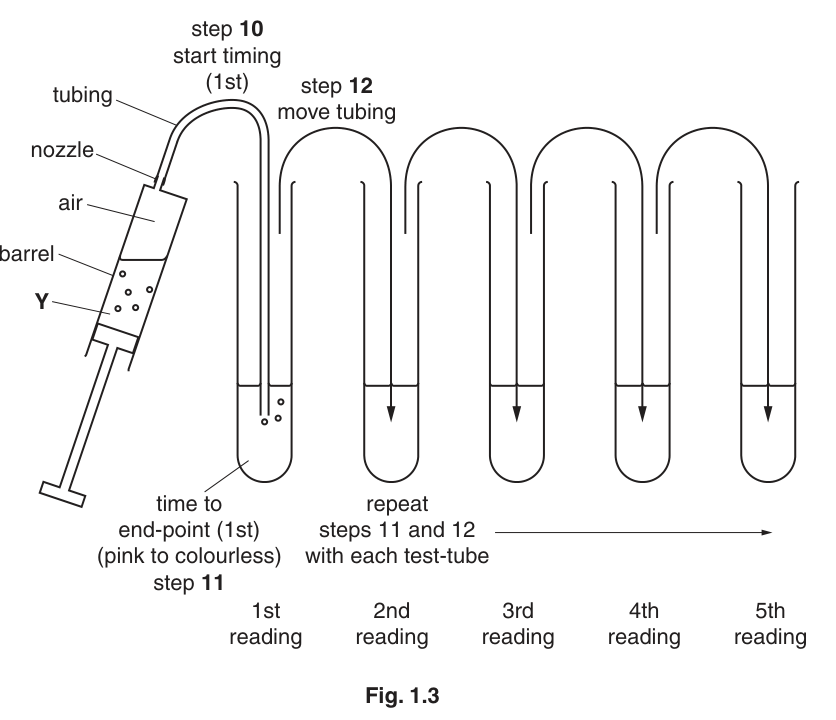
The tubing must be transferred from one test-tube to the next as quickly as possible, after reaching the end-point.
Read up to the end of step 17 before proceeding.
To avoid the time delay in stopping and starting the timing, you must not stop the timer at any of the end-points, just record the time.
From your readings you will be required to calculate the time taken to reach the end-point in each test-tube.
Consider the units of the values recorded on your timer or clock.
State the:
- smallest value which your timer shows ______
- smallest unit of time you have decided to record ______
Complete Table 1.1 with the raw data, recording the time when the tubing is put into the indicator and the time when the end-point is reached.
Repeat for each test-tube.
After 10 minutes, complete Table 1.2 with the second set of raw data.
Table 1.1 – first five readings
| time | time | time | time | time | ||||||
|---|---|---|---|---|---|---|---|---|---|---|
| start of reading | 1st | 2nd | 3rd | 4th | 5th | |||||
| end-point | 1st | 2nd | 3rd | 4th | 5th | |||||
| space for any processing of the results |
Table 1.2 – readings after 10 minutes
| time | time | time | time | time | ||||||
|---|---|---|---|---|---|---|---|---|---|---|
| start of reading | 1st | 2nd | 3rd | 4th | 5th | |||||
| end-point | 1st | 2nd | 3rd | 4th | 5th | |||||
| space for any processing of the results |
- Remove the tubing from the syringe nozzle.
- Use this syringe to take up of Y from below the froth.
- Clean the outside of the syringe to remove any of Y.
- Holding the barrel of the syringe with the nozzle pointing upwards, pull out the plunger to the mark. There is now of air in the syringe. The syringe should be kept upright to avoid Y from entering the tubing. Do not press the plunger.
- Holding the barrel of the syringe upright, fit the tubing onto the nozzle of the syringe.
- As shown in Fig. 1.2 and Fig. 1.3, put the end of the tubing into P in the first test-tube and start timing. Both the syringe and the test-tube contents need to be gently mixed by shaking until the end-point is reached.
- Record in Table 1.1 the time shown on the timer when the end-point is reached. The colourless end-point can be compared with the contents of E. Do not stop the timer.
- Immediately, transfer the tubing into P in the next test-tube and record in Table 1.1 the start time shown on the timer (start of second reading). Both the syringe and the test-tube contents need to be gently mixed by shaking until the end-point is reached.
- Repeat steps 11 and 12 with the remaining three test-tubes.
- After the 5th reading, stop timing. Remove the syringe with the tubing from the test-tube.
- Leave Y in the syringe for 10 minutes. (The syringe should be kept upright so that Y is not able to enter the tubing).
- During the 10 minutes, repeat step 4. You are provided with a container labelled, ‘for waste’ and a container labelled ‘for washing’, so you can re-use your test-tubes.
- After 10 minutes, repeat steps 10 to 14 and record the results in Table 1.2.
Depending on the timer or clock which you have used you may find the following examples helpful, so that you can process your results to find the time taken to reach the end-point.
Example 1: using stop clock or stopwatch
| minutes:seconds | ||
|---|---|---|
| start time | 1:54 | = 114 seconds |
| end-point time | 2:18 | = 138 seconds |
time taken to reach end-point = 24 seconds
Example 2: using clock times
| hours:minutes:seconds | difference in time | |
|---|---|---|
| start time | 9:10:50 | |
| end-point time | 9:11:14 | 24 seconds |
time taken to reach end-point = 24 seconds
Using your results from Table 1.1, complete Table 1.3 below to show the calculation to find the time taken to reach the end-point in your first test-tube.
Table 1.3
| 1st start time | |
| 1st end-point time |
time taken to reach end-point = ______
Combining the processed results from Table 1.1 and Table 1.2, prepare the space below to record only the processed results. This will enable the trend to be observed.
Identify three significant sources of error in this investigation.
Describe three modifications to this investigation which would improve the confidence in your results.
The original hypothesis was:
The rate of release of carbon dioxide from yeast cells will decrease with time.
State whether your results support this hypothesis.
Use your results to explain your answer.
The rest of this paper
1 more questions- Q2Use of the Light Microscope · Presentation of Data and Observations · Analysis, Conclusions and Evaluation20M