Biology 9700/36 — October/November 2012
Cambridge AS Level · Advanced Practical Skills · worked solutions for every part, with the mark scheme
Topics Presentation of Data and Observations · Analysis, Conclusions and Evaluation · Manipulation, Measurement and Observation · Use of the Light Microscope
You are required to investigate the effect of surface area (independent variable) on the diffusion of solution E into agar blocks with different surface areas.
- agar block, S, contains starch which has been stained blue by iodine solution
- agar block, U, contains starch only
As solution E diffuses into the agar block it hydrolyses (breaks down) the starch and the iodine loses its colour.
You are provided with:
| labelled | contents | hazard |
|---|---|---|
| S | agar block containing starch and iodine | irritant |
| U | agar block containing starch only | none |
| W | distilled water | none |
| E | solution of E | irritant |
You will need to cut three different sizes of agar block from each of the large agar blocks (block S and block U).
Fig. 1.1 shows you the measurements of the largest size of block you will cut (block 1).
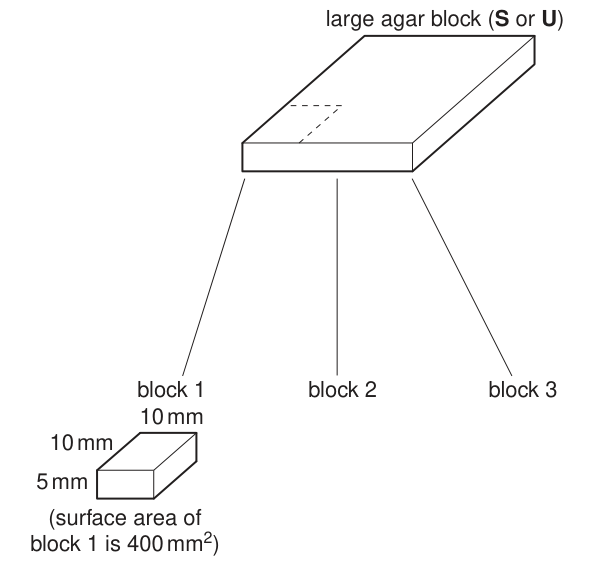
Fig. 1.1
You may use the space on Fig. 1.1 to work out how to cut the two further sizes of blocks, smaller than block 1, with different surface areas (blocks 2 and 3).
Complete Table 1.1.
Table 1.1
| block | width measurement / mm | length measurement / mm | depth measurement / mm | surface area / |
|---|---|---|---|---|
| 1 | 10 | 10 | 5 | 400 |
| 2 | 5 | |||
| 3 | 5 |
You must not touch the agar blocks with your hands.
You can use the mounted needle, blunt forceps and paper towel to handle the blocks.
Proceed as follows:
- Prepare the different sized blocks 1, 2 and 3 as you decided in (a)(i) so that you have one stained and one unstained block of each size.
- Cover the blocks with damp paper towel to prevent evaporation.
- Put the beaker or container provided on to a piece of black card and put hot water between and into the beaker.
- Put of solution E into six test-tubes and put them into the water-bath. Leave for 5 minutes.
- Use a mounted needle to put block 1 from S and block 1 from U into two separate test-tubes in the water-bath as shown in Fig. 1.2. Be careful not to break up the blocks as you lower them into the solution E.
Start timing.
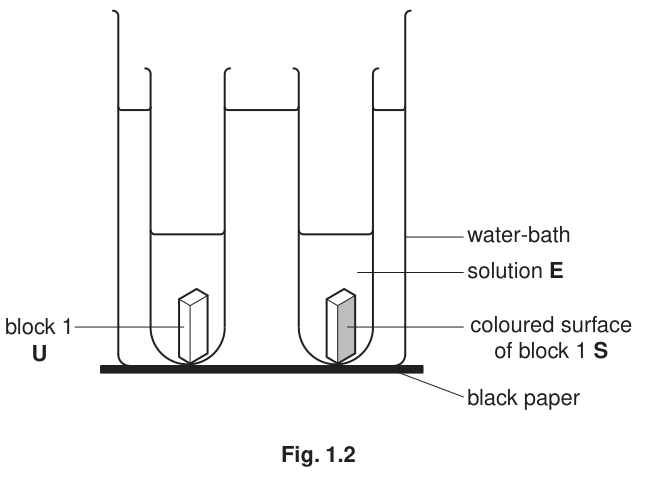
Fig. 1.2
- Observe the coloured surface of the block from S. Record the time taken for the colour to disappear. Use block U as a standard colour. If the colour does not disappear by 360 seconds, record 'more than 360'.
- Repeat steps 5 and 6 with blocks 2 and 3 from S and U.
- Record the temperature of the water in the water-bath.
temperature of water = ______
Prepare the space below and record your results.
Identify two significant sources of error in this investigation.
Describe three modifications to this investigation which would improve the confidence in your results.
A student investigated the time course of an enzyme-catalysed reaction using the hydrolysis of starch by an enzyme.
Fig. 1.3 shows the apparatus used.
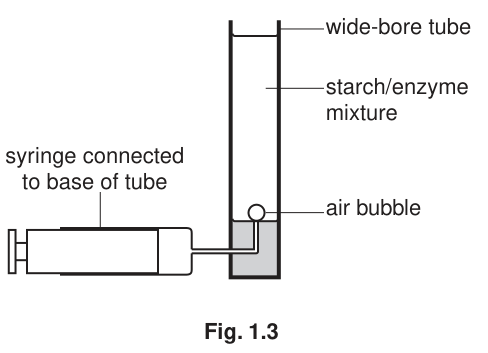
Fig. 1.3
To measure the progress of the enzyme-catalysed reaction a bubble was released into the mixture. As the concentration of starch decreases the bubble rises faster.
Other variables were considered and kept to a standard.
The data from the student's investigation are shown in Table 1.2.
Table 1.2
| time when bubble is released / s | speed of the bubble / |
|---|---|
| 7 | 3.4 |
| 12 | 4.0 |
| 20 | 6.0 |
| 25 | 7.8 |
| 30 | 7.9 |
Plot a graph of the data shown in Table 1.2.
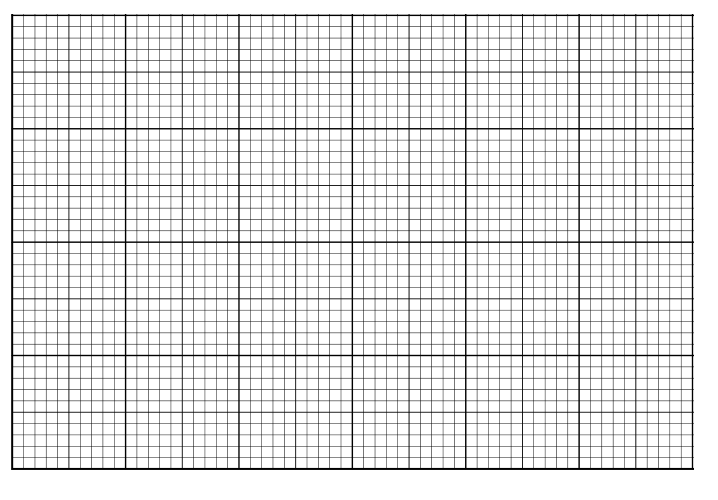
If a bubble was released at 10 seconds, use your graph to estimate the speed of the bubble.
Show on the graph how you estimated the speed of the bubble.
speed of bubble = ______
Explain the reason for the results:
between 12 seconds and 17 seconds
between 25 seconds and 30 seconds.
The rest of this paper
1 more questions- Q2Use of the Light Microscope · Presentation of Data and Observations · Analysis, Conclusions and Evaluation18M