Biology 9700/35 — October/November 2012
Cambridge AS Level · Advanced Practical Skills · worked solutions for every part, with the mark scheme
Topics Presentation of Data and Observations · Analysis, Conclusions and Evaluation · Manipulation, Measurement and Observation · Use of the Light Microscope
Yeast cells contain an enzyme, catalase, which catalyses the hydrolysis (breakdown) of hydrogen peroxide into oxygen and water with the transfer of heat to the surroundings.
The progress of this enzyme-catalysed reaction can be followed by measuring the temperature at intervals of time.
You are required to:
- make different concentrations of the copper sulfate solution, C
- investigate the effect of different concentrations of C (the independent variable).
You are provided with:
| labelled | contents | hazard | volume / |
|---|---|---|---|
| C | 3% copper sulfate solution | harmful irritant | 25 |
| H | hydrogen peroxide solution | harmful irritant | 50 |
| W | distilled water | none | 50 |
| Y | yeast suspension | low | 20 |
You are required to make a serial dilution of 3% copper sulfate solution, C which reduces the concentration of C by a factor of ten between each successive dilution.
You will need to make up of each concentration of solution C.
Complete Fig. 1.1 to show how you will make two further concentrations of C, starting with the 3% solution, C.
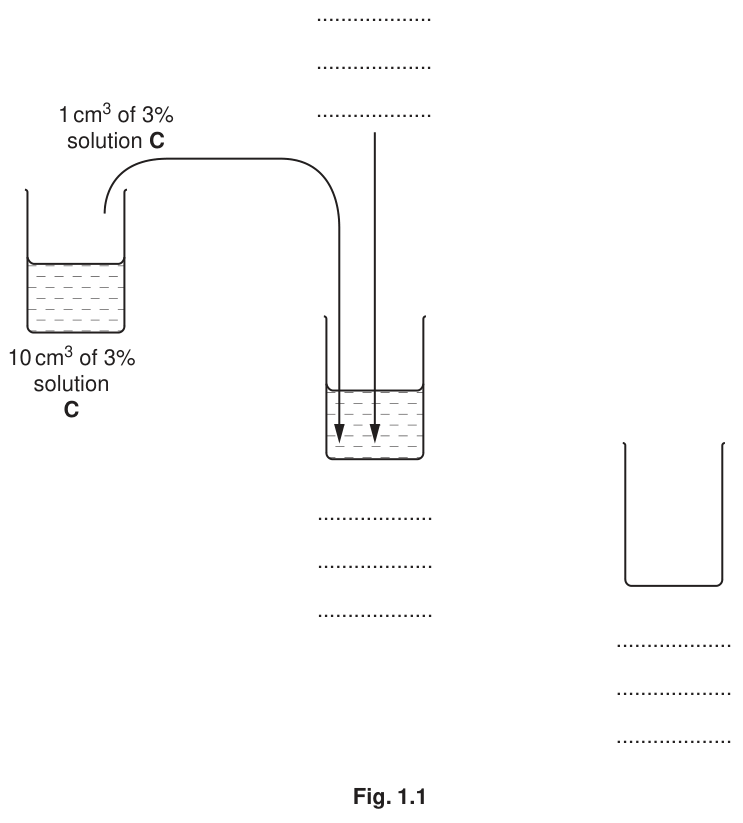
Answer
The completed serial dilution of 3% copper sulfate solution C:
- Beaker 1 (already drawn): 10 cm³ of 3% solution C.
- Beaker 2: 9 cm³ of distilled water W + 1 cm³ of 3% C (transferred from beaker 1) → 10 cm³ of 0.3% C.
- Beaker 3: 9 cm³ of distilled water W + 1 cm³ of 0.3% C (transferred from beaker 2) → 10 cm³ of 0.03% C.
- A second arrow from beaker 2 to beaker 3, labelled 1 cm³ of 0.3% C, is added so the dilution is cascaded correctly.
Each step dilutes the previous concentration by a factor of 10 and each beaker contains a final volume of 10 cm³.
0.3% C = 9 cm³ W + 1 cm³ of 3% C; 0.03% C = 9 cm³ W + 1 cm³ of 0.3% C (final volume 10 cm³ in each).
Background Concept
A serial dilution is a stepwise dilution in which the concentration is reduced by the same factor at every step. It is the standard way to produce a set of accurately known concentrations from a single stock, and is used everywhere from school biology to clinical microbiology.
For a ten-fold (1:10) dilution, one part of the more concentrated solution is added to nine parts of diluent (distilled water here), so the final volume is ten times the volume of stock transferred. Because the same amount of solute is now spread through ten times the volume, the concentration falls by a factor of 10:
Repeating the step (1+9 again) gives a second ten-fold dilution, so two steps produce a hundred-fold (10²) overall reduction of the original 3% stock.
Understanding the Question
The stem of the question sets up an investigation into the effect of copper sulfate C on the catalase–hydrogen peroxide reaction (followed by temperature change). It also instructs you to make a ten-fold serial dilution of C in 10 cm³ volumes. Fig. 1.1 already shows the first beaker (10 cm³ of 3% C) and an arrow removing 1 cm³ of it into a second beaker. You have to complete the figure so it shows the next two dilutions (0.3% and 0.03%) in the right sequence, with the correct volumes of water and stock at each step.
Approach
Two things drive the design:
- Concentration — each ten-fold dilution of 3% gives 0.3% and then 0.03%, in that order.
- Volume — to keep a final volume of 10 cm³ in each beaker, the 1 cm³ transferred must be topped up with 9 cm³ of water.
The dilution must be cascaded: the 1 cm³ added to beaker 3 must come from beaker 2 (which contains 0.3%), not from the original 3% stock, otherwise the second ten-fold reduction is not achieved.
Step-by-Step Reasoning
- The starting concentration in beaker 1 is 3% C (given in the figure).
- Dilution 1 (beaker 2). Add 9 cm³ of W to beaker 2, then transfer the 1 cm³ of 3% C already shown by the arrow. Total volume = 1 + 9 = 10 cm³. New concentration = × 3% = 0.3%.
- Dilution 2 (beaker 3). Add 9 cm³ of W to beaker 3, then transfer 1 cm³ of the 0.3% solution from beaker 2 into it. Total volume = 1 + 9 = 10 cm³. New concentration = × 0.3% = 0.03%.
- Labels. Write the concentration under each beaker (0.3% under beaker 2, 0.03% under beaker 3). Add the volume labels (cm³) inside or beside each beaker: '9 cm³ of W + 1 cm³ of 3% C' in beaker 2; '9 cm³ of W + 1 cm³ of 0.3% C' in beaker 3. The transfer into beaker 3 is labelled '1 cm³ of 0.3% C'.
- Second arrow. Draw a new arrow from beaker 2 to beaker 3 to show the cascaded transfer.
Key Takeaways
- A ten-fold dilution = 1 part stock + 9 parts diluent (= 10 parts total).
- Two cascaded ten-fold dilutions give a hundred-fold (10²) overall reduction of the original 3% stock.
- The dilution must be cascaded — successive dilutions transfer from the most recently made concentration, not from the original stock.
Common Mistakes
- Forgetting the 9 cm³ of water in one or both of the new beakers — the figure only shows the 1 cm³ transfer, so a candidate must remember to draw the diluent in.
- Adding 1 cm³ of 3% C directly into beaker 3 instead of cascading from beaker 2 — this would make beaker 3 the same concentration as beaker 2, not a further ten-fold dilution.
- Swapping the concentration labels under the beakers (0.03% under beaker 2, 0.3% under beaker 3) — the dilution must be in the correct sequence.
- Omitting units (cm³ or ml) on the volume labels.
Things to Be Careful About
- Each beaker must contain 9 cm³ of water in addition to the 1 cm³ transferred — these are independent marking points.
- The concentration sequence under the beakers is 0.3% then 0.03% (decreasing by a factor of 10 each step).
- The third beaker receives 1 cm³ of the 0.3% solution (the previous concentration), not the 3% stock.
- Use cm³ or ml; both are accepted, but be consistent.
Proceed as follows:
- Make the concentrations of C as stated in (a)(i).
- Label test-tubes with W and with the concentrations of C.
- Put of W into the test-tube labelled W and put of H into the same test-tube. Mix well.
- Put a thermometer into the contents of the test-tube. Record the temperature.
- Stir Y and put of Y into the same test-tube. Mix well.
- Start timing and record the temperature of the contents of the test-tube every 30 seconds up to 210 seconds.
- Repeat steps 3 to 6 replacing the of W with of the lowest concentration of C.
- Repeat step 7 with the other concentrations of C.
Prepare the space below to record your results.
Answer
Results table — time as the first column (in seconds) and one column per treatment, ordered from the water control to the highest copper sulfate concentration:
| time / s | W (0% C) | 0.03% C | 0.3% C | 3% C |
|---|---|---|---|---|
| 30 | 25.0 | 25.0 | 25.0 | 25.0 |
| 60 | 25.5 | 25.0 | 25.0 | 25.0 |
| 90 | 26.0 | 25.5 | 25.0 | 25.0 |
| 120 | 26.5 | 25.5 | 25.0 | 25.0 |
| 150 | 27.0 | 26.0 | 25.0 | 25.0 |
| 180 | 27.0 | 26.0 | 25.0 | 25.0 |
| 210 | 27.5 | 26.5 | 25.0 | 25.0 |
(Values shown are representative of the kind of pattern expected: temperature rises in W and the lowest concentrations because catalase is active, but the rise is much smaller or absent in 3% C where the enzyme is inhibited. The candidate's own readings, recorded during the experiment, replace these.)
Key features of the table that earn credit:
- Time as a column with the unit s (not minutes).
- Temperature as a column heading with the unit °C.
- Treatments ordered W, then from the lowest concentration to 3% C (i.e. 0.03% → 0.3% → 3%).
- Readings recorded to whole or half a degree (e.g. 25.0, 25.5, 26.0).
- The W column shows temperature at 210 s higher than at 30 s (the exothermic reaction is taking place).
Table: time / s in the first column, temperature / °C heading for each treatment, columns ordered W → 0.03% C → 0.3% C → 3% C, with W reading at 210 s > 30 s.
Background Concept
In CIE Biology Paper 3, a results table is the candidate's record of what they actually observed during the experiment. Marks are awarded for both the structure of the table and the content within it. Structure marks cover headings, units and the order in which treatments are presented; content marks cover the data itself (correct pattern, sensible values, correct precision).
The convention for a heading is the quantity followed by a solidus and the unit, e.g. time / s and temperature / °C. Units must sit in the heading, not in the cells. The independent variable treatments are conventionally ordered from the control to the highest concentration, so that any trend across the columns (or rows) is easy to read at a glance.
Understanding the Question
The stem describes an experiment in which the temperature of a yeast + hydrogen peroxide mixture is recorded every 30 s for 210 s, with four treatments: water (W), 0.03% C, 0.3% C and 3% C. You are asked to prepare the space to record your results — i.e. draw the table you will fill in during the experiment, before doing the experiment itself. The mark scheme then scores both the table's structure and the data you record in it.
Approach
The cleanest layout is time as a column on the left, one column per treatment to its right. The time column is the 'first column' so its values are scored first. The treatments go in the order W, 0.03% C, 0.3% C, 3% C so the trend in temperature against increasing copper sulfate concentration can be read off left-to-right. Temperature values are recorded to the precision of the thermometer (typically 0.5 °C), giving whole or half-degree values.
Step-by-Step Reasoning
- Draw a ruled table with all cells separated by lines (no 'free-floating' text in the data area). The mark scheme requires 'all cells drawn'.
- Head the first column 'time / s' (or with 'seconds'). Do not use minutes; the readings are at 30-second intervals.
- Head the next four columns with the treatments: W (0% C), 0.03% C, 0.3% C, 3% C. The order must run from the control to the highest concentration. The % sign goes in the header, not in the cells.
- Mark each heading with the temperature unit °C (e.g. 'temperature / °C' in a row of the heading area, or by making the cells below the heading read temperatures in °C).
- Record the time-axis readings (30, 60, 90, 120, 150, 180, 210 s) — at least four — in the first column, as whole numbers.
- Record temperature readings in the cells for each treatment as whole or half-degree values, all between 15 and 35 °C.
- In the W column, ensure temperature at 210 s is higher than at 30 s — this is the pattern mark, showing that the exothermic catalase reaction took place in the absence of inhibitor.
- The 3% C column should show little or no temperature rise (inhibition); the 0.03% and 0.3% columns show intermediate rises (mp 5 also allows the candidate's own observed order from lowest to highest concentration).
Key Takeaways
- Headings: quantity / unit, with the unit on the line of the heading, not inside the data cells.
- Order the treatments from the control to the highest concentration so the table reads as a tidy gradient.
- Use the precision of the measuring instrument — here 0.5 °C on a standard laboratory thermometer — and stick to that precision consistently.
- The control (W) column should show the expected biological effect; here, a rise in temperature because the catalase reaction is exothermic and uninhibited.
Common Mistakes
- Putting the unit inside the data cells ('45 s' written under each time value) instead of in the heading.
- Writing the % in the data cells of the column (e.g. 0.03 in a cell under a column labelled 'concentration / %') — the mark scheme rejects this.
- Using minutes instead of seconds.
- Putting treatments in the wrong order, e.g. starting with 3% C, or jumping from 0.03% straight to 3% and omitting 0.3%.
- Recording the W reading as falling from 30 s to 210 s, or as constant — the mark scheme requires W to rise over the 210 s because the exothermic reaction proceeds in the absence of inhibitor.
Things to Be Careful About
- The 'first column/row' is whichever one contains the time values; marks for the time data (whole numbers in the time cells) apply there.
- The pattern mark for W (temperature at 210 s > at 30 s) is independent of the temperature marks themselves — the candidate gets both if the table is correctly structured.
- A neat, ruled table with no merged cells and no out-of-area notes scores structure marks; a scruffy table with free text loses them.
- Do not put volumes, method reminders or extra columns (e.g. for 'observations') inside the data area — they will be ignored but may obscure the data you need to record.
Explain the effect of the 3% copper sulfate solution on the enzyme-catalysed reaction.
Answer
Based on a typical result (where the temperature change from 30 s to 210 s for 3% C is less than for W and 0.03% C):
The 3% copper sulfate inhibits the catalase enzyme. The temperature rise from 30 s to 210 s in 3% C was smaller than in W (and 0.03% C), so fewer enzyme–substrate complexes were formed because the Cu²⁺ ions blocked the active sites of catalase (or denatured the enzyme).
(If the candidate's own data showed a greater rise with 3% C, the alternative wording would be: 'the reaction speeds up / more enzyme–substrate complexes form / Cu²⁺ acts as a cofactor.' If the rise was the same, the answer would be: 'no effect.')
3% C inhibits the catalase reaction; the temperature change is smaller than for W, so Cu²⁺ ions block the active sites of catalase (or denature the enzyme).
Background Concept
Enzymes are globular proteins whose activity depends on the precise 3D shape of the active site. Anything that disrupts that shape — high temperature, extreme pH, or heavy metal ions such as Cu²⁺, Hg²⁺, Ag⁺ — can either denature the enzyme permanently (irreversible) or bind to its active site and block substrate access (competitive or non-competitive inhibition). Either way, the rate of reaction falls.
Copper sulfate is the classic A-level example of a heavy-metal enzyme inhibitor. The effect is usually concentration-dependent: low concentrations may have little or no effect, while high concentrations strongly inhibit.
Understanding the Question
You are asked to explain the effect of the 3% copper sulfate solution on the enzyme-catalysed reaction, using the data you have just recorded. The mark scheme actually accepts three different answers depending on which pattern your data show:
- 3% C gives a smaller temperature change than W/0.03% C → inhibition (Cu²⁺ blocks active sites / denatures enzyme).
- 3% C gives a larger temperature change than W/0.03% C → stimulation (Cu²⁺ acts as a cofactor / more active sites used).
- 3% C gives the same change (±0.5 °C) as W/0.03% C → no effect.
In practice, with 3% CuSO₄ and catalase from a yeast suspension, inhibition is by far the most common outcome. The most likely correct answer, therefore, is inhibition.
Approach
First, decide which of the three patterns your data show by comparing the change from 30 s to 210 s for 3% C against the change for W and 0.03% C. Then choose the matching explanation from the list above. The explanation must contain a biological reason (inhibition / blocking the active site / denaturing) and a numerical reference to your own data, otherwise it does not score.
Step-by-Step Reasoning
- Read the 30 s and 210 s temperatures for W, 0.03% C and 3% C from your table.
- Compute the change for each treatment.
- Compare the 3% C with the W (and 0.03% C) .
- If 3% C is less than W: state that the 3% copper sulfate inhibits the catalase reaction. The biological reason: the Cu²⁺ ions either bind to the active site (so substrate cannot bind) or denature the enzyme by disrupting its tertiary structure. Either explanation credits the mark, as long as the words inhibit / block active site / denature appear.
- Cite your data: e.g. 'ΔT for 3% C was 0.0 °C, compared with +2.5 °C for W, so 3% C inhibits the reaction.'
- If your data showed the opposite pattern (3% C gave a larger rise), the explanation would be '3% C speeds up the reaction / more enzyme–substrate complexes form / Cu²⁺ acts as a cofactor.' The same kind of data citation is required.
Key Takeaways
- The mark rewards a directional statement (inhibits / activates / no effect) plus a biological reason.
- Heavy-metal ions are classic enzyme inhibitors at high concentration because they bind strongly to –SH, –NH₂ and –COO⁻ groups on the protein.
- Always tie the conclusion back to your own recorded numbers, not a textbook generalisation.
Common Mistakes
- Stating a direction without a biological reason (e.g. 'the reaction was slower with 3% C' — no credit because no mechanism is given).
- Giving a textbook reason without referring to the data (e.g. 'Cu²⁺ inhibits catalase' — the mark scheme requires data for W, 0.03% C and 3% C at 30 s and 210 s).
- Confusing inhibition (active site blocked, enzyme still folded) with denaturation (irreversible unfolding) — both can credit, but pick one and state it clearly.
- Saying 'the enzyme died' or 'the yeast was killed' — these are not biological explanations and do not credit.
Things to Be Careful About
- The mark scheme requires results for W, 0.03% C and 3% C, plus readings for the lowest and 210 s temperatures — make sure your data table contains all of these before answering.
- Match the explanation to the data you actually have. Do not write 'inhibits' if your data show stimulation.
- One mark is for the direction-and-reason only — keep the answer short and do not pad with unrelated information.
Identify two significant sources of error in this investigation.
Answer
-
Starting / initial temperature — the temperature of the test-tube contents at 0 s was not the same / not standardised between experiments, so the temperature changes recorded are not directly comparable.
-
Thermometer position — the depth of the thermometer in the test-tube was not the same / not standardised between experiments, so different volumes of liquid were being measured and the readings varied.
(Other acceptable answers: mixing was not standardised between test-tubes; concentration of hydrogen peroxide changed over time / decreased because the bottle had been opened.)
- Initial temperature not standardised. 2. Thermometer position not standardised (alternative: mixing not standardised; H₂O₂ concentration changed).
Background Concept
A source of error in an experiment is a feature of the procedure that introduces unwanted variation between repeats or between treatments. The mark scheme for this question specifically requires the candidate to give two items, each with a cause and an idea of how the error affects the readings. The cause names what is not being controlled; the effect says how the readings differ as a result.
The distinction between a source of error and an improvement is important. A source of error is something that does go wrong in the experiment as it is set up. An improvement is a change to the procedure that would prevent that error. A correct improvement to a known error in this experiment scores under (a)(v), not here.
Understanding the Question
You are asked for two significant sources of error in the investigation. The mark scheme offers four acceptable causes (initial temperature, thermometer position, mixing, hydrogen peroxide concentration), and awards up to two marks — one per correctly identified cause with an idea of how the error affects the readings.
Approach
Walk through the procedure step by step and ask: what is not being controlled? In each case, the answer is a cause (a thing) plus an effect (a way in which the readings change). The strongest errors are those that vary between treatments, because they would be wrongly attributed to the independent variable (copper sulfate concentration).
Step-by-Step Reasoning
- Initial temperature — the procedure does not specify bringing W, H, Y and C to the same temperature before mixing. The starting temperature of each test-tube therefore drifts with the laboratory air. Effect: the initial temperature is not the same for each test-tube, so the change in temperature from 0 s to 210 s is not directly comparable across treatments.
- Thermometer position — the procedure does not fix how deep the thermometer sits in the test-tube. Effect: the bulb may be in different volumes of liquid, or touching the glass, giving readings that are not comparable between test-tubes.
- Mixing — the procedure says only 'mix well', without specifying how vigorously, for how long, or with what tool. Effect: the rate at which the contents equilibrate (and the rate of heat loss to the surroundings) varies between test-tubes.
- Concentration of hydrogen peroxide — hydrogen peroxide decomposes over time, especially when the bottle has been opened. Effect: the substrate concentration falls between early and later test-tubes, so the rate of the catalase reaction falls, confounding the effect of C.
Key Takeaways
- A source of error has a cause (the thing not controlled) and an effect (how the readings change as a result). One without the other does not credit.
- Errors that vary between treatments are the most damaging, because they are confounded with the independent variable.
- Errors that vary between repeats (e.g. different starting temperatures) are still sources of error because they increase the spread of the data.
Common Mistakes
- Naming an improvement instead of an error (e.g. 'use a water bath' is an improvement, not an error). The improvement is rewarded in (a)(v).
- Giving the cause without the effect (e.g. 'the initial temperature was different' — fine if the effect on the readings is also stated).
- Naming a non-significant error, such as 'the candidate might mis-time the stopwatch' — the mark scheme lists only the four causes above as significant; other vague 'human errors' do not credit.
- Repeating the same cause with two different wordings — only distinct causes score.
Things to Be Careful About
- Read the procedure again before answering — the source of error must be something the procedure does not control, not something the procedure does control (e.g. the volume of Y is fixed at 1 cm³, so 'volume of yeast' is not a source of error).
- The two errors you name must be different causes — e.g. 'initial temperature' and 'thermometer position' are different; 'initial temperature' and 'starting temperature' are not.
- A mark is lost if the effect described does not actually follow from the cause named.
Describe three modifications to this investigation which would improve the confidence in your results.
Answer
Three modifications, each addressing a real weakness in the procedure:
-
Thermostatically controlled water bath — place each test-tube in a water bath at a set temperature (e.g. 25 °C) before adding Y, so the starting temperature of every test-tube is the same. (Addresses the 'initial temperature not standardised' source of error.)
-
Magnetic / mechanical stirrer (or a standardised shaking protocol) — stir each test-tube at the same rate so the contents mix in the same way and heat loss to the surroundings is consistent. (Addresses the 'mixing not standardised' source of error.)
-
Repeat the experiment and calculate means (and/or use a data logger with a temperature sensor / a digital thermometer) — replicates give a measure of the spread of the data, so anomalous results can be identified; a data logger reads continuously and more precisely than a mercury thermometer. (Addresses the precision and reliability of the temperature readings.)
(Other acceptable modifications: use 'fresh' hydrogen peroxide from a freshly opened bottle; insulate the test-tubes with cotton wool to reduce heat loss; use a wider / narrower range of concentrations of C; record for longer or at shorter intervals.)
- Thermostatically controlled water bath (controls initial temperature). 2. Magnetic stirrer (standardises mixing). 3. Replicate and calculate means (or use a data logger / digital thermometer for higher precision).
Background Concept
An improvement is a change to the procedure that reduces a known source of error or increases the precision of the measurement. The mark scheme for (a)(v) lists seven distinct improvements, but only the first three are required for full marks. The strongest improvements are those that:
- Control a variable (e.g. thermostatted water bath, fresh H₂O₂, insulated tubes).
- Increase the precision of the dependent variable (e.g. data logger, digital thermometer with a finer scale).
- Improve the range or granularity of the independent variable (e.g. more concentrations, narrower intervals).
- Increase the number of observations (e.g. repeats, longer recording time).
The improvement must be specific and realistic in a school-laboratory setting. Vague suggestions such as 'do it more carefully' or 'use better equipment' do not credit.
Understanding the Question
You are asked to describe three modifications that would improve the confidence in the results. 'Confidence' here means both precision (the readings agree closely with each other) and accuracy (the readings reflect the true temperature change). Each modification should be a specific, named change to equipment, procedure, or to the number of readings taken.
Approach
For each of the three modifications, name the change and (briefly) the source of error or weakness it addresses. Pairing each improvement with the error it fixes shows the examiner that you understand why the change is needed.
Step-by-Step Reasoning
- Initial temperature not standardised → use a thermostatically controlled water bath to bring every test-tube to the same starting temperature (e.g. 25 °C) before adding Y. Do not say 'temperature-controlled room' or 'air conditioning' — the mark scheme rejects these because they do not directly control the temperature of the test-tube contents.
- Mixing not standardised → use a magnetic stirrer (with a small follower in each tube) or a mechanical stirrer at a fixed speed, so each tube mixes in the same way.
- Temperature readings imprecise → use a data logger with a temperature sensor, a digital thermometer, or a thermometer with a narrower scale (e.g. 0.1 °C divisions). This improves the resolution of every reading.
- Hydrogen peroxide decomposes over time → use fresh hydrogen peroxide from a newly opened bottle for every test-tube, so the substrate concentration is the same in each one.
- Range of independent variable too narrow → use a wider range (e.g. 5%, 1%, 0.1%, 0.01% in addition to the 3%, 0.3%, 0.03%) to map out the full dose–response curve.
- Only one reading per treatment → repeat the experiment and calculate means, or record for longer / at shorter intervals to capture the full shape of the temperature curve.
- Heat lost to the surroundings → insulate the test-tubes (e.g. with cotton wool around the outside) so the temperature change measured is closer to the heat actually released by the reaction.
Key Takeaways
- Pair each improvement with the source of error it addresses — this is what shows the examiner you understand both halves of the question.
- Improvements must be specific and operational (a named piece of apparatus, a named protocol change), not vague exhortations.
- Three is the maximum; do not list more than three or you risk contradiction and wasted time.
Common Mistakes
- 'Temperature-controlled room' or 'air conditioning' — the mark scheme explicitly rejects these.
- 'Repeat the experiment and take a mean' without saying what is being repeated, or without a clear link to the dependent variable.
- 'Use a more accurate thermometer' — too vague; say what thermometer (digital, narrower scale, data logger).
- 'Be more careful' / 'avoid human error' — these are not specific modifications and do not credit.
- Three modifications that all address the same source of error (e.g. three different ways to standardise temperature) — only the first scores, the others are redundant.
Things to Be Careful About
- Improvements must be practical in a school lab. 'Use a colorimeter to measure the heat released' is not a practical improvement here.
- Do not confuse improvements with sources of error — a 'source of error' describes what is wrong; an improvement describes what would fix it. (a)(iv) and (a)(v) are different questions.
- Three different types of improvement (control a variable, increase precision, increase replication) score more strongly than three of the same type.
Describe how you would set up a control for this investigation.
Answer
The W test-tube already in the procedure acts as the control: it contains 1 cm³ of distilled water W in place of the 1 cm³ of C, together with the same 1 cm³ of W, 5 cm³ of H and 1 cm³ of Y. Everything except the copper sulfate is identical to the test-tubes containing C, so any difference in temperature change between W and the C-containing tubes is due to the copper sulfate and not to the other reagents.
(An alternative valid control: replace the 1 cm³ of yeast suspension Y with 1 cm³ of water or with inert beads, to test that the temperature change is due to the enzyme and not to the other reagents.)
Replace the 1 cm³ of C with 1 cm³ of W (water) — this is the W test-tube already in the procedure, which contains W + H + Y but no C.
Background Concept
A control in a biology experiment is a treatment in which the variable under test is removed or held constant, while every other factor is kept the same as in the experimental treatments. The control tells you what would happen without the factor you are investigating, so any difference between the control and the experimental treatments can be attributed to that factor.
In this experiment, the independent variable is the concentration of copper sulfate C. A control therefore has no copper sulfate (replaced with the same volume of water) but still contains the other reagents: H (hydrogen peroxide) and Y (yeast suspension, the source of catalase).
Understanding the Question
You are asked to describe how you would set up a control. One mark is available. The mark scheme accepts three formulations, each describing the same idea from a different angle:
- replace C with water;
- W + H + Y (i.e. the same three reagents, but no C);
- replace Y with water or inert beads (to confirm the temperature change is enzymatic).
All three formulations credit, but the most direct answer is 'replace C with water'.
Approach
Identify the variable the experiment is testing (copper sulfate C) and describe a treatment in which that variable is absent but every other reagent is present in the same volumes.
Step-by-Step Reasoning
- The independent variable is the concentration of C (0%, 0.03%, 0.3%, 3%).
- A control is the 0% treatment — i.e. the tube that contains no C at all.
- The procedure already does this in step 3 (the W test-tube): 1 cm³ of W replaces the 1 cm³ of C, with 5 cm³ of H and 1 cm³ of Y added in the same way as for the other tubes.
- So the W test-tube is the control. Its temperature change shows the effect of the catalase reaction in the absence of copper sulfate, against which the C-containing tubes are compared.
- State this clearly: 'the W test-tube, which contains 1 cm³ of W in place of 1 cm³ of C (plus the usual 5 cm³ of H and 1 cm³ of Y), is the control.'
Key Takeaways
- A control differs from the experimental treatments only in the independent variable; every other reagent and volume is the same.
- The W test-tube in this procedure is the negative control for the effect of copper sulfate on the catalase reaction.
- An alternative control (replacing Y with water or inert beads) tests the dependence of the reaction on the enzyme, rather than on C.
Common Mistakes
- 'Just remove C' — too vague; the mark scheme wants the substitute stated (water / W).
- 'Boil the enzyme Y' to denature it — the mark scheme rejects this because boiled enzyme is not the same as a control; the control must contain all the same reagents, just without the variable under test.
- 'Add more water' — not a control; the control must replace one specific reagent, not add an extra.
- 'Repeat the experiment' — that is a replicate, not a control.
Things to Be Careful About
- The volumes of the other reagents must be unchanged: 1 cm³ of W, 5 cm³ of H, 1 cm³ of Y. Only C is replaced.
- The control must run under the same conditions (timing, temperature, thermometer) as the experimental tubes.
- A negative control (no C) tests for the absence of an effect; a positive control (a known inhibitor or activator) would test the procedure's ability to detect an effect, but the mark scheme does not credit this here.
State the value of the smallest division on the scale of your thermometer.
smallest division = ______
State the actual error in measuring a temperature of using this thermometer.
______
Working
For any analogue scale, the absolute uncertainty on a single reading is conventionally taken as half of the smallest division on the scale.
A typical school-laboratory thermometer has smallest divisions of 0.5 °C, so:
Hence 30 °C is recorded as .
Answer
smallest division = 0.5 °C
0.25 °C
smallest division = 0.5 °C; 30 °C ± 0.25 °C
Background Concept
Every analogue measuring instrument has a smallest division (the smallest interval marked on its scale) and a corresponding uncertainty (the largest reading error you could make when using the instrument). By convention, the absolute uncertainty on a single reading of an analogue scale is taken to be half the smallest division.
The reasoning is that you can read the scale to half a division by eye, but no more precisely. For a thermometer with 1 °C divisions, the uncertainty is ±0.5 °C; for one with 0.5 °C divisions, it is ±0.25 °C; for one with 0.2 °C divisions, it is ±0.1 °C.
Understanding the Question
You are asked to (a) state the value of the smallest division on your thermometer, and (b) state the actual error in measuring 30 °C with it. There is no 'right' answer to (a) without seeing the actual thermometer, but a school thermometer typically has 0.5 °C divisions. The mark scheme explicitly rejects any smallest division smaller than 0.25 °C — i.e. you cannot claim a precision finer than the instrument actually has. (1) mark is awarded for the half-division calculation.
Approach
Read the smallest division from the thermometer scale, then halve it to get the absolute uncertainty on a single reading.
Step-by-Step Reasoning
- Identify the smallest division on the thermometer. A standard school mercury or alcohol thermometer usually has 0.5 °C divisions (sometimes 1 °C). Read the scale carefully and write the value with its unit.
- Halve the smallest division to get the uncertainty on a single reading:
- Quote the answer with the unit °C, and combine with the stated reading:
- If your thermometer actually has 1 °C divisions, the error is 0.5 °C; if it has 0.2 °C divisions (rare in school), the error is 0.1 °C — but the mark scheme rejects anything less than 0.25 °C.
Key Takeaways
- Uncertainty on a single analogue reading = ½ × smallest division.
- The result is always quoted as reading ± uncertainty, both in the same unit.
- The instrument, not the experiment, sets the limit of precision.
Common Mistakes
- Using the full smallest division as the uncertainty (e.g. writing ±0.5 °C for a thermometer with 0.5 °C divisions). The mark scheme wants half the smallest division.
- Quoting a smallest division finer than the instrument actually has (e.g. 0.1 °C on a 0.5 °C thermometer) — the mark scheme rejects this.
- Forgetting the unit (°C) on either the smallest division or the uncertainty.
- Quoting an uncertainty with the wrong number of significant figures — keep it to one or two significant figures (e.g. 0.25, not 0.250).
Things to Be Careful About
- The smallest division is the finest interval on the scale, not the labelled major interval. On a thermometer labelled every 5 °C with 10 small divisions between each label, the smallest division is 0.5 °C, not 5 °C.
- The uncertainty applies to every reading made with that instrument, not just to 30 °C — so the same ±0.25 °C applies to all temperatures you record.
- If the question is extended to ask about a difference between two readings, the absolute uncertainties add, giving a larger error on the difference (e.g. ±0.5 °C on ΔT, not ±0.25 °C).
In a similar investigation, a student investigated how changing the concentration of catalase solution (independent variable) affected the hydrolysis of hydrogen peroxide.
The student stopped the reaction after one minute by adding a high concentration of sodium azide.
A dye was added which reacted with the hydrogen peroxide that had not been hydrolysed. This produced different intensities of colour depending on the quantity of the remaining hydrogen peroxide in the solution.
A colorimeter was used to measure the absorbance of light by the coloured solution.
Other variables were considered and kept to a standard.
The results of the student’s investigation are shown in Table 1.1.
Table 1.1
| concentration of catalase solution / arbitrary units | absorbance of light by the coloured solution / arbitrary units |
|---|---|
| 10 | 1.34 |
| 14 | 1.12 |
| 30 | 0.66 |
| 50 | 0.04 |
| 100 | 0.02 |
Plot a graph of the data shown in Table 1.1.

Answer
A line graph plotted on Graph Grid 1:
- x-axis: concentration of catalase / arbitrary units (au), with the origin at 0 and the scale running 0 → 20 → 40 → 60 → 80 → 100 (each 2 cm represents 20 au; the value 100 need not be labelled but the orientation is correct).
- y-axis: absorbance of light by the coloured solution / arbitrary units (au), with the origin at 0 and the scale running 0 → 0.2 → 0.4 → 0.6 → 0.8 → 1.0 → 1.2 → 1.4 (each 2 cm represents 0.2 au; the value 1.4 need not be labelled but the orientation is correct).
- Five points plotted as small crosses (or dots in a circle, or crosses in a circle) to within half a small square:
- (10, 1.34), (14, 1.12), (30, 0.66), (50, 0.04), (100, 0.02).
- Points joined with a smooth, ruled line less than 1 mm thick, exactly point to point, with no feathery edges, no extrapolation beyond the first (10, 1.34) or last (100, 0.02) point, and no irregularities in thickness.
The shape is a steeply decreasing curve at low catalase concentrations, flattening out near zero absorbance at high catalase concentrations.
Line graph: absorbance (au) on y vs catalase concentration (au) on x; points (10, 1.34), (14, 1.12), (30, 0.66), (50, 0.04), (100, 0.02) plotted as small crosses and joined with a smooth ruled line; curve falls steeply then plateaus near zero.
Background Concept
In CIE Biology Paper 3, a line graph is the standard way to display a continuous relationship between an independent variable (plotted on the x-axis) and a dependent variable (plotted on the y-axis). The marks fall into four groups — Orientation (correct axes and labels), Scale (sensible, occupying at least half the grid), Plotting (points within half a small square), and Line (smooth, ruled, point-to-point, thin).
The independent variable is the one the experimenter varies deliberately; the dependent variable is the one measured in response. Here the stem states that catalase concentration is the independent variable and absorbance is the dependent variable, so catalase goes on x and absorbance on y.
Understanding the Question
You are given five (concentration, absorbance) pairs in Table 1.1 and asked to plot a line graph on Graph Grid 1. The independent variable (catalase concentration) is plotted on the x-axis, the dependent variable (absorbance) on the y-axis.
Approach
Choose the axes, choose scales that use at least half the grid in each direction, plot each of the five points as a small cross within half a small square of the true position, then join the points with a smooth ruled line. Do not extrapolate beyond the data.
Step-by-Step Reasoning
- Orientation (O). Label the x-axis concentration of catalase / arbitrary units (au) and the y-axis absorbance of light by the coloured solution / arbitrary units (au). Do not put units in the cells of the axis.
- Scale (S). The x-values run 0 to 100, so a scale of 20 au to 2 cm is natural (0, 20, 40, 60, 80, 100). The y-values run 0 to 1.4, so a scale of 0.2 au to 2 cm is natural (0, 0.2, 0.4, 0.6, 0.8, 1.0, 1.2, 1.4). Both scales use at least half the grid in each direction. The label of the origin need not be repeated if it is at 0.
- Plotting (P). Plot the five points as small crosses (a short horizontal and a short vertical stroke crossing at the data point). The mark scheme rejects dots, blobs, or crosses so large that any part of the cross falls outside the correct small square.
- (10, 1.34): x = 10, y = 1.34
- (14, 1.12): x = 14, y = 1.12
- (30, 0.66): x = 30, y = 0.66
- (50, 0.04): x = 50, y = 0.04 (very close to the x-axis)
- (100, 0.02): x = 100, y = 0.02 (essentially on the x-axis)
- Line (L). Join the points with a single smooth, ruled line, point to point, using a pencil and ruler (or a fine pen) such that the line is less than 1 mm thick. The line should curve steeply downwards from (10, 1.34) through (14, 1.12) and (30, 0.66), then flatten almost to the x-axis between (50, 0.04) and (100, 0.02). Do not extrapolate the line beyond the first or last point.
Key Takeaways
- Independent variable on x, dependent on y — even if the convention feels backwards (e.g. when 'absorbance falls as catalase rises', it is still the catalase concentration that goes on x because the experimenter chose to vary it).
- The 'use at least half the grid' rule means a scale like 50 au to 2 cm on the x-axis (0 to 200) would not fit the data; the scale must be chosen so the data fill the grid.
- The line is point-to-point, not a line of best fit — a small distinction, but important here because the candidate is joining specific measured values, not fitting a smooth curve through them.
Common Mistakes
- Reversing the axes (absorbance on x, catalase on y). The mark scheme accepts this only if the scale is then reversed correctly (0.4 to 2 cm on the now-x axis, 20 to 2 cm on the now-y axis).
- Using awkward scales (e.g. 30 au to 2 cm on x, 0.3 au to 2 cm on y) that make plotting hard.
- Plotting points as large blobs, dots, or crosses that extend outside the correct small square.
- Joining the points with a feathery line, a line that has gaps, or a line of irregular thickness.
- Extrapolating the line beyond (10, 1.34) or beyond (100, 0.02) — the mark scheme rejects this.
- Forgetting units on the axes (au, or arbitrary units).
Things to Be Careful About
- The origin must be at 0 (or labelled) on both axes; do not start the x-axis at 10 just because the first data point is at 10.
- The grid is 20 × 30 large squares subdivided into 10 × 10 small squares, so each small square is 2 mm × 2 mm. A 'small cross' must fit inside one small square.
- The line is ruled (drawn with a ruler or straight edge between adjacent points) but smooth (not a zig-zag); because the data curve is steep then flat, the line will need a gentle curve through most segments.
- A line graph is the right choice here because the independent variable is continuous (concentration) and the data describe a continuous trend. A bar chart would be wrong.
Explain the relationship between the concentration of catalase solution and the hydrolysis of hydrogen peroxide.
Answer
-
As the concentration of catalase increases, more active sites are available to bind to hydrogen peroxide, so more enzyme–substrate complexes (ESCs) form and more hydrogen peroxide is hydrolysed. Less hydrogen peroxide remains in the solution, so the absorbance of light by the dye–peroxide complex falls (the dye reacts with the H₂O₂ that has not been hydrolysed — the more H₂O₂ hydrolysed, the less dye colour, and the lower the absorbance).
-
At high catalase concentrations, hydrogen peroxide becomes the limiting factor — all the hydrogen peroxide has been hydrolysed, so the absorbance cannot fall any further and the curve plateaus close to zero absorbance.
More catalase → more active sites bind H₂O₂ → more ESCs → more H₂O₂ hydrolysed → lower absorbance; at high [catalase], H₂O₂ becomes the limiting factor and the curve plateaus.
Background Concept
Enzymes catalyse reactions by binding their substrate at the active site to form a short-lived enzyme–substrate complex (ESC). The more active sites that are occupied at any one moment, the faster the reaction proceeds — up to a point. That point is reached when either the enzyme is in excess (so adding more enzyme does not increase the rate because all the substrate is already being turned over) or the substrate is in excess (so adding more substrate does not increase the rate because all the enzyme is already saturated).
In this experiment, the dye reacts with the hydrogen peroxide that has not been hydrolysed. The colour (and therefore the absorbance) is therefore inversely related to the amount of H₂O₂ that has been broken down. A low absorbance means little H₂O₂ is left; a high absorbance means a lot of H₂O₂ is left.
Understanding the Question
You are asked to explain the relationship between catalase concentration (independent variable) and the hydrolysis of hydrogen peroxide (which is reported indirectly as absorbance, the dependent variable). The graph shows absorbance falling as catalase concentration rises, and then plateauing close to zero at high catalase concentrations. Two marks are available — one for the decrease, one for the plateau.
Approach
Walk through the shape of the curve and explain each part in terms of what is happening at the molecular level (ESCs, active sites, substrate availability).
Step-by-Step Reasoning
- The fall (left side of the curve). As catalase concentration increases from 10 to 30 (and beyond) au, more enzyme molecules are present, so more active sites are available to bind hydrogen peroxide. More enzyme–substrate complexes form per unit time, so more H₂O₂ is hydrolysed. With more H₂O₂ broken down, less H₂O₂ remains to react with the dye, so the absorbance falls.
- The plateau (right side of the curve). At 50 au and 100 au catalase, the absorbance is essentially zero (0.04 and 0.02). This means virtually no H₂O₂ remains — the catalase is in such excess that all the substrate has been hydrolysed. Beyond this point, adding more catalase cannot increase the amount of H₂O₂ broken down because there is no H₂O₂ left to break down. The hydrogen peroxide is the limiting factor.
- Link back to the data. Quote one or two specific points to anchor the explanation: e.g. 'absorbance fell from 1.34 at 10 au to 0.04 at 50 au, showing that more H₂O₂ was hydrolysed; absorbance then remained near zero at 100 au because the H₂O₂ had been used up.'
Key Takeaways
- A line on a graph of absorbance vs catalase concentration that falls and then plateaus is the classic signature of a reaction that is enzyme-limited at low [enzyme] and substrate-limited at high [enzyme].
- The plateau is just as important as the fall: it tells you the reaction has gone to completion and the substrate is exhausted.
- The dependent variable (absorbance) is inversely related to the amount of hydrolysis here, because the dye measures H₂O₂ that has not been broken down.
Common Mistakes
- 'More enzyme means more reaction' without mentioning active sites or ESCs — too vague for the mark.
- Forgetting to explain the plateau (the mark scheme gives one mark for the fall and one for the plateau, so the plateau explanation is required).
- Stating that absorbance falls 'because the reaction is faster' — the link to H₂O₂ remaining (or the dye reacting with H₂O₂) must be explicit.
- Confusing the dependent and independent variables (saying 'more absorbance means more H₂O₂ broken down') — the dye reacts with the H₂O₂ that has not been broken down.
Things to Be Careful About
- The answer must be mechanistic — use the words active site, enzyme–substrate complex (or ESCs), and limiting factor somewhere in the answer.
- Quote the data to anchor the explanation; 'it goes down' is not enough.
- The plateau is not 'the reaction has stopped' — it is 'the substrate has been used up'. A stopped reaction would not have begun in the first place; the reaction is complete.
The rest of this paper
1 more questions- Q2Use of the Light Microscope · Presentation of Data and Observations · Analysis, Conclusions and Evaluation18M