Biology 9700/31 — October/November 2012
Cambridge AS Level · Advanced Practical Skills · worked solutions for every part, with the mark scheme
Topics Manipulation, Measurement and Observation · Presentation of Data and Observations · Analysis, Conclusions and Evaluation
You are required to investigate how much glucose diffuses from a plant tissue extract through a partially permeable wall of Visking (dialysis) tubing.
Fig. 1.1 shows the apparatus you will set up for this investigation.
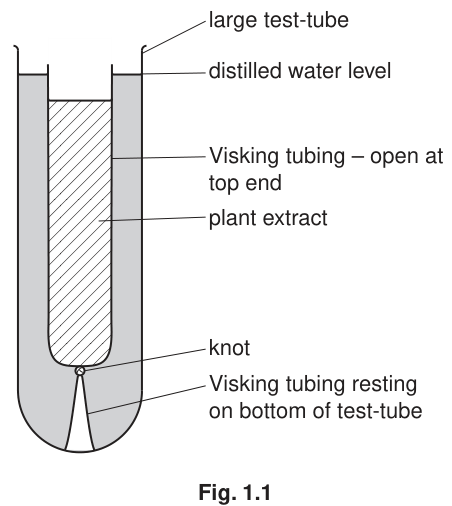
You are provided with:
| labelled | contents | hazard | volume / |
|---|---|---|---|
| P | plant tissue extract | none | 20 |
| W | distilled water | none | 100 |
| G | 1% glucose solution | none | 25 |
| Benedict's solution | Benedict's solution | harmful irritant | 30 |
| labelled | contents | hazard | details | quantity |
|---|---|---|---|---|
| V | Visking tubing in distilled water | none | 15 cm length in distilled water | 1 |
Proceed as follows:
- Tie a knot in the Visking tubing as close as possible to one end so that it seals the end.
- To open the other end, wet the Visking tubing and rub the tubing gently between your fingers.
- Without mixing P, put some of P into the Visking tubing to the level shown in Fig. 1.1.
- Rinse the outside of the Visking tubing by dipping it into the water in the container labelled V.
- Put the Visking tubing into the large test-tube.
State the volume of W needed to reach the water level as shown in Fig. 1.1.
volume of W = ______
Complete Fig. 1.2 to show how you will make four further concentrations of G, starting with the 1% solution, G.
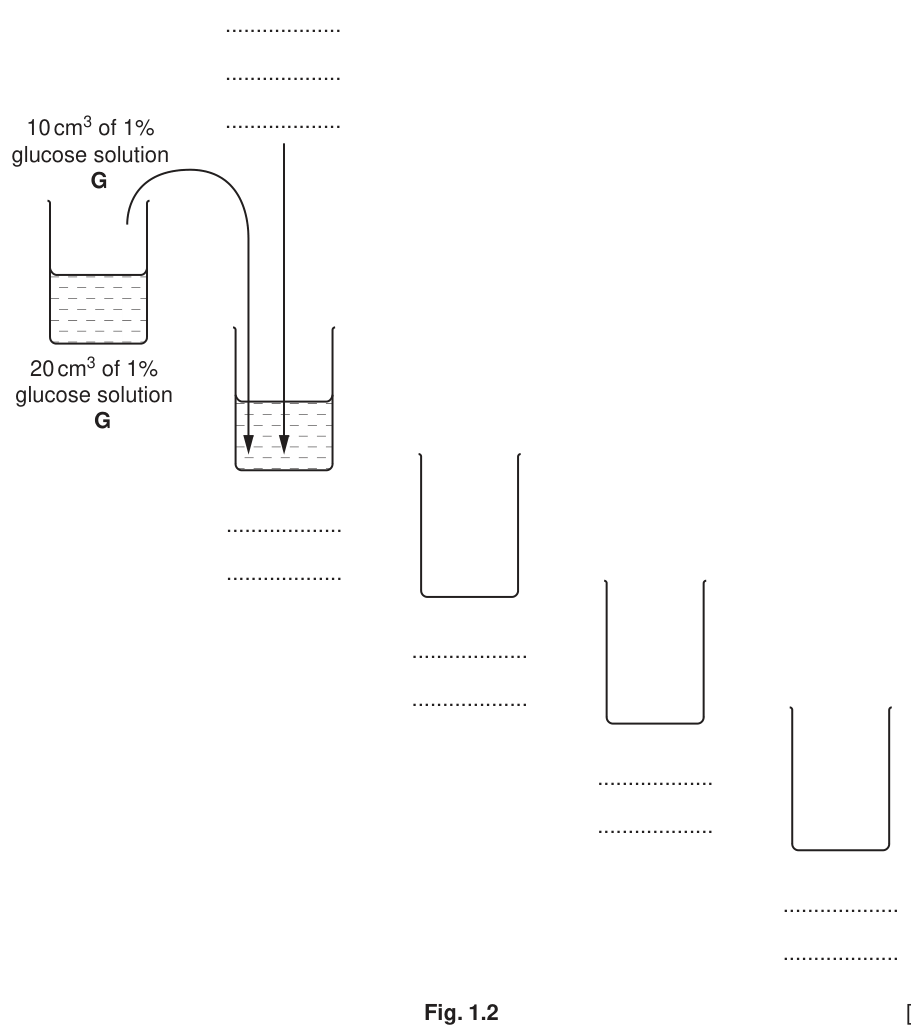
- Prepare the concentrations of G as decided in (a)(ii) in the containers provided.
- After 20 minutes, which started at step 7, remove the Visking tubing and put it into the container labelled 'for waste'.
- Pour the water from the large test-tube into a container and label it S.
- Carry out the Benedict's test on all 6 solutions (five of G and one of S).
You will need to use of each of the solutions of G and S with of Benedict's solution.
- Test each solution separately and record the time taken for the first appearance of any colour change. If there is no colour change after 120 seconds record 'more than 120'.
Prepare the space below and record your results.
Complete Fig. 1.3 below to show:
- the positions of each of the percentage concentrations of solution G
- the letter S to show where the sample fits in the series of concentrations.

A colorimeter could not have been used in this investigation.
Describe three other modifications to this investigation which would improve the confidence in your results.
In a similar investigation, a student investigated how changing the concentration of glucose solution (independent variable) in the Visking tubing affected the quantity of glucose diffusing through the wall into the surrounding solution.
After 20 minutes a dye was added to the surrounding solution. This produced different intensities of colour depending on the glucose concentration in the surrounding solution.
A colorimeter was used to measure the absorbance of light by the coloured solution.
Other variables were considered and kept to a standard.
The student's results are shown in Table 1.1.
Table 1.1
| concentration of glucose solution inside the Visking tubing / arbitrary units | absorbance of light by the coloured solution / arbitrary units |
|---|---|
| 10 | 0.750 |
| 15 | 1.100 |
| 20 | 1.475 |
| 25 | 1.850 |
| 30 | 1.900 |
Plot a graph of the data shown in Table 1.1.
Explain the difference in the results for the glucose concentration at 10 arbitrary units and at 15 arbitrary units.
Explain the difference in the gradients of the line between the glucose concentrations of 10 arbitrary units and 25 arbitrary units and between 25 arbitrary units and 30 arbitrary units.
The student used a measuring cylinder to measure the volumes of glucose solution. The smallest division on the measuring cylinder scale was .
State the actual error in measuring a volume of using this measuring cylinder.
______
The rest of this paper
1 more questions- Q2—20M