Biology 9700/34 — May/June 2012
Cambridge AS Level · Advanced Practical Skills · worked solutions for every part, with the mark scheme
Topics Presentation of Data and Observations · Analysis, Conclusions and Evaluation · Manipulation, Measurement and Observation · Use of the Light Microscope
Plant cells contain an enzyme, catalase, which catalyses the hydrolysis (breakdown) of hydrogen peroxide into oxygen and water. An extract of plant tissue contains catalase.
You are required to:
- make different concentrations of plant extract containing catalase
- investigate the effect of different concentrations of plant extract by finding the time taken for a square of filter paper, soaked in the plant extract, to rise in hydrogen peroxide solution.
You are provided with:
| labelled | contents | hazard | volume / |
|---|---|---|---|
| H | hydrogen peroxide solution | harmful irritant | 100 |
| W | distilled water | none | 80 |
| P | 100% plant extract solution | none | 50 |
Decide on the concentrations of plant extract solution you will use in your investigation.
You will need to make up of each concentration of plant extract solution.
Prepare the space on page 3 to show:
- the concentration of P
- the volumes of P
- the volumes of W.
Answer
| Concentration of P (%) | Volume of P (cm³) | Volume of W (cm³) |
|---|---|---|
| 100 | 10.0 | 0.0 |
| 80 | 8.0 | 2.0 |
| 60 | 6.0 | 4.0 |
| 40 | 4.0 | 6.0 |
| 20 | 2.0 | 8.0 |
Each row totals 10 cm³. The concentration of P is reduced in even 20% steps from the 100% stock.
Five concentrations in even 20% intervals from 100% to 20% (100, 80, 60, 40, 20%), each made up to a final volume of 10 cm³ with P + W (e.g. 100% = 10.0 cm³ P + 0.0 cm³ W; 80% = 8.0 cm³ P + 2.0 cm³ W; etc.).
Background Concept
A simple (proportional) dilution mixes a stock of known concentration with a diluent (here distilled water, W) to give a lower concentration. The relationship is
where is the concentration and volume of stock transferred, and is the target concentration and total volume made up. Here the stock P is 100% plant extract, so .
Understanding the Question
You have 100% plant extract P and distilled water W. You must design five concentrations in a sensible range, prepare exactly 10 cm³ of each, and record the volumes of P and W you will use. The total volume per concentration is fixed at 10 cm³. The mark scheme requires the 100% stock itself to be one of the five test concentrations.
Approach
Pick an interval that gives a clear spread of results across the range. Even intervals (e.g. 20% steps) are the simplest and the mark scheme rewards them. Apply to find the volume of P for each , then subtract from 10 cm³ to obtain the volume of W.
Step-by-Step Reasoning
For an 80% solution of 10 cm³:
Repeating for each concentration gives:
- 100% → 10.0 cm³ P + 0.0 cm³ W
- 80% → 8.0 cm³ P + 2.0 cm³ W
- 60% → 6.0 cm³ P + 4.0 cm³ W
- 40% → 4.0 cm³ P + 6.0 cm³ W
- 20% → 2.0 cm³ P + 8.0 cm³ W
The five concentrations form a simple-dilution series in even 20% steps, each making 10 cm³ total.
Key Takeaways
- Use for every dilution; the total volume equals stock + diluent.
- Choose even intervals so the effect of the independent variable is unambiguous on a subsequent graph.
- Keep the 100% stock as one of the test concentrations so the full range is explored.
Common Mistakes
- Rounding (e.g. writing 2 cm³ for a 6.7% concentration) — the mark scheme rejects figures rounded up or down.
- Omitting 100% as one of the test concentrations — the mark scheme requires 100% to be included.
- Uneven intervals (e.g. 100, 75, 50, 30, 10) — these break the even-step pattern the mark scheme rewards.
- Forgetting the 10 cm³ total — the volume of W is the difference between 10 cm³ and the volume of P.
Things to Be Careful About
- Decide the interval BEFORE making up the solutions so the page-3 table is the recipe you actually follow.
- Read the bottom of the meniscus when measuring with a syringe or pipette.
- Label each container immediately after preparation; otherwise a 40% tube can easily be confused with a 60% tube.
You are advised to read steps 1 to 10 before proceeding.
Proceed as follows:
- Prepare the concentrations of plant extract solution as stated in (a)(i).
- Put H into the test-tube, filling to within from the top.
- Cut squares of filter paper, .
- Use forceps to pick up one square of filter paper and dip the whole square into one of the concentrations of plant extract solution in its container.
- Wipe the square against the inside of the container to remove excess plant extract solution from both sides of the square.
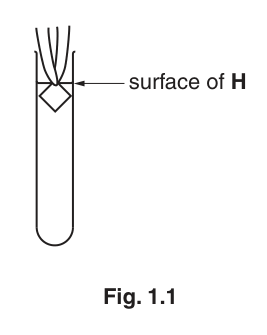
- Hold the square so that the top of the square is level with the surface of H as shown in Fig. 1.1.
- Release the square (you may need to shake the forceps) and start timing.
- Record the time taken for the square to return to the surface.
If the time is more than three minutes, stop timing and record 'more than 180'. - Remove the square from the test-tube.
- Repeat steps 4 to 9 with the other concentrations of plant extract.
Prepare the space below and record your results.
Answer
| Concentration of P (%) | Time 1 / s | Time 2 / s | Mean time / s |
|---|---|---|---|
| 100 | 13 | 15 | 14 |
| 80 | 18 | 20 | 19 |
| 60 | 27 | 25 | 26 |
| 40 | 64 | 60 | 62 |
| 20 | > 180 | > 180 | > 180 |
(Student-dependent. The candidate's own timings are recorded to the nearest whole second; the highest concentration must give the shortest time, and a mean is calculated for at least two concentrations.)
Representative example: 100% ≈ 14 s, 80% ≈ 19 s, 60% ≈ 26 s, 40% ≈ 62 s, 20% > 180 s; student values will vary but the trend (higher concentration → shorter time) and the convention of whole seconds, replicated readings and a mean must be preserved.
Background Concept
Catalase hydrolyses hydrogen peroxide to oxygen and water:
The O₂ produced forms bubbles that cling to the paper square and lift it to the surface. The faster the reaction, the sooner the paper rises, so the rise time is inversely related to catalase activity.
Understanding the Question
You are recording your own experimental timings. The table must obey CIE conventions: clear heading(s) with units, integer seconds, the right trend, at least two readings per concentration (or six or more concentrations), and a mean for at least two concentrations. Values that exceed the 180 s time cap are recorded as "> 180" rather than estimated.
Approach
- Decide the table layout BEFORE starting the experiment (independent variable as one column, time(s) as the other, mean column if replicates are done).
- Head each recorded-data column with the quantity AND its unit; put units in the heading, not in the data cells.
- Time each square to the nearest whole second, writing the time in the correct cell immediately.
- Repeat each concentration and record a mean (whole seconds, rounded).
- If the time exceeds 180 s, write "> 180" rather than continuing to time.
Step-by-Step Reasoning
The table must contain:
- Heading 1: percentage concentration of plant extract (or P), with % in the heading. Units must NOT be in the data cells.
- Heading 2: time / s (or seconds). Units in the heading, not in cells.
- Data: whole-second numbers ≤ 180, or "> 180".
- Trend: the highest concentration (100%) gives the SHORTEST time; the lowest (20%) gives the LONGEST (or "> 180").
- Replication: at least two readings per concentration, OR six or more concentrations tested.
- Mean: a mean (or rate) recorded for at least two concentrations.
A worked example with realistic values is shown in the solution table above. The student's own times will differ, but the trend and the conventions must match.
Key Takeaways
- A CIE results table has: a heading with quantity, a heading with unit, units in the heading only, and a sensible layout that matches the independent variable.
- Replicate readings and a mean are required for any practical that supports them.
- A correct trend across the independent variable is itself a mark — check the direction of the effect before you leave the lab.
Common Mistakes
- Putting % or s in the data cells instead of in the heading.
- Writing decimal seconds (e.g. 13.5 s) instead of whole seconds.
- Leaving the 20% cell blank because the time exceeded 180 s, instead of writing "> 180".
- Reversing the trend (recording longer times at higher concentration) — this is a fail.
- Forgetting a mean column when replicates are recorded.
Things to Be Careful About
- A column labelled just "time" without a unit loses a mark; write time / s.
- A second-by-second stopwatch read at the moment the paper breaks the surface is the standard measurement.
- If a square rises faster than you can write, accept the imprecision — but recording the trend is what scores.
Identify three significant sources of error in your investigation.
Answer
Any three of the following significant sources of error (max 3):
- Volume of plant extract on the paper varies — different dipping / soaking times, or different wiping of the paper, mean the amount of catalase added to each square is not standardised, so the independent variable is not the only difference between squares.
- Hydrogen peroxide concentration / amount changes — the H₂O₂ is used up as O₂ is produced, and the same tube is reused for different squares, so the concentration of substrate around each square is not the same; later squares have a lower [H₂O₂] than the first.
- The paper rises on its edge / flat / sticks to the side of the test tube — the time taken to reach the surface is then longer or shorter than the time to rise freely, so the recorded times do not all measure the same thing.
- Temperature of the hydrogen peroxide rises during the investigation as the tube is held in the hand or as the reaction proceeds, changing the reaction rate between squares.
- The paper sticks to the side of the tube while sinking and is released suddenly, giving an irregular start time.
Three significant sources of error: variable volume of plant extract on each paper square; loss / contamination of hydrogen peroxide between squares; and irregular rising (paper on edge, flat or sticking to the side of the tube).
Background Concept
A "source of error" in a CIE practical is a SPECIFIC, named feature of the procedure that causes the recorded value to be wrong or to vary between repeats. Errors that affect every tube equally (e.g. the stopwatch is always 0.5 s slow) are systematic and are not credited here — the mark scheme asks for sources that genuinely vary between squares.
Understanding the Question
You must identify three SIGNIFICANT sources of error in the filter-paper catalase method. The mark scheme pairs each error with the variable it affects, so the answer needs both a cause and the consequence on the variable.
Approach
Walk through the procedure step by step and ask: "what could be different between squares that would change the timing?" Focus on:
- the amount of enzyme added to each square (independent variable side);
- the state of the substrate (H₂O₂) for each square (controlled variable);
- the way the paper actually rises inside the tube (dependent variable side).
Step-by-Step Reasoning
- Variable extract on paper — the same dipping time, wiping pressure and paper thickness are not enforced, so the mass of catalase carried into the H₂O₂ is different each time.
- H₂O₂ changes — the substrate is consumed and may be contaminated by extract from the previous square; the effective concentration for square N is lower than for square 1.
- Paper rises on edge / flat — the surface area exposed to the H₂O₂ differs, and the time to reach the surface is no longer a clean measure of the rate.
- Temperature rise — the reaction is temperature-sensitive; a few degrees' change during the practical alters the rate independently of the concentration of P.
- Sticking paper — the paper clings to the glass and is released unpredictably, so the start time of the rise is inconsistent.
Pick the three that are most significant for THIS procedure.
Key Takeaways
- A good source-of-error answer names the cause, the variable affected, and the direction of the effect.
- Errors that affect all squares equally (e.g. a miscalibrated stopwatch) are NOT credited here — the mark scheme wants between-square variation.
- Vague phrases like "human error" or "not accurate" do NOT score; the error must be specific to this experiment.
Common Mistakes
- Vague answers ("human error", "parallax", "not accurate") — the mark scheme does not credit these.
- Errors that affect every tube equally (e.g. "the stopwatch is slow") — these do not vary the result between concentrations and are not credited.
- Naming an error without the variable it affects (e.g. just "the paper rises flat") — the mark scheme wants the consequence.
- Confusing sources of error with improvements — sources of error describe what is wrong NOW; improvements describe what to change.
Things to Be Careful About
- The H₂O₂ being "used up" is a valid cause; write it specifically ("the H₂O₂ is used up, so later squares have a lower substrate concentration").
- "Foam on the paper" is a sign that the extract was not wiped off — the mark scheme allows "not even" or "bubbles / foam on side" as a way of expressing the consequence.
- If a square hits the side and goes back down, that is a real timing error (paper on edge / flat) and should be named.
Suggest how you would make three improvements to this investigation.
Answer
Any three of the following improvements (max 3):
- Standardise the dipping / soaking time in the plant extract (e.g. hold the square in the extract for a fixed 5 s each time) so the amount of catalase carried on each paper is the same.
- Use a deeper / wider test tube so the paper square does not touch the sides while rising, and is free to rise vertically.
- Use fresh hydrogen peroxide for each square (or use a new tube for each concentration) so the substrate is not used up or contaminated between squares.
- Repeat each concentration at least twice and calculate a mean (the mark scheme does not credit "calculate a mean" alone — the improvement is the repeat itself).
- Use more concentrations (or a serial dilution) to give a smoother trend.
- Control the pH using a buffer, since enzyme activity is pH-sensitive.
- Use a water bath to keep the temperature of the H₂O₂ constant.
Three improvements: standardise the dipping time of the paper in the plant extract; use a deeper test tube so the paper does not touch the sides; use fresh hydrogen peroxide for each square (or new tube per concentration).
Background Concept
An "improvement" in a CIE practical must be SPECIFIC (it names a piece of apparatus, a volume or a duration), ACHIEVABLE in a school lab, and DIRECTLY linked to one of the sources of error you have identified. Improvements that are vague ("be more careful", "use better equipment") are not credited.
Understanding the Question
You must suggest three improvements to the filter-paper catalase method. The mark scheme awards 1 mark per specific, creditable improvement, to a maximum of 3.
Approach
Pair each improvement with the source of error it solves. A simple structure works:
- "Because the dipping time varies (error), standardise it by holding the paper in the extract for a fixed 5 s (improvement)."
Focus on:
- standardising the enzyme (catalase) added to each square;
- keeping the substrate (H₂O₂) constant between squares;
- controlling physical conditions (pH, temperature) that change the rate;
- increasing replication and improving the resolution of the independent variable.
Step-by-Step Reasoning
- Standardise the dipping time — directly counters "variable volume of extract on the paper".
- Deeper / wider tube — directly counters "paper sticks to the side / rises on edge".
- Fresh H₂O₂ for each square — directly counters "H₂O₂ is used up / contaminated".
- More repeats — reduces the effect of random error on the mean.
- More concentrations / serial dilution — gives a smoother graph of rate against concentration.
- Buffer for pH — catalase has a pH optimum; a buffer keeps the rate independent of small pH changes.
- Water bath for temperature — keeps the reaction temperature constant across all squares.
Choose the three most impactful for THIS procedure.
Key Takeaways
- A good improvement is specific (number, time, volume, piece of apparatus) and tied to a variable.
- Improvements should target the same things as the sources of error: enzyme amount, substrate concentration, physical conditions, and replication.
- A repeat is a real improvement; a calculated mean alone is a way of handling existing repeats and is NOT itself credited.
Common Mistakes
- Vague improvements ("do it more carefully", "use a more accurate stopwatch") — the mark scheme rejects these.
- Improvements that would change the variable being investigated (e.g. "use a different concentration of H₂O₂") — these alter the experiment rather than improving it.
- Improvements with no link to a stated error — each improvement should make a named variable more controlled.
- Confusing improvements with the procedure — the procedure is what you DO; an improvement is what you would CHANGE.
Things to Be Careful About
- "Calculate a mean" is NOT credited on its own — the improvement that earns the mark is doing more repeats.
- A buffer must be named specifically (e.g. "phosphate buffer"); just "buffer" is borderline but usually accepted.
- A water bath must be at a stated temperature (e.g. 25 °C) or the improvement is incomplete.
Catalase catalyses the hydrolysis of hydrogen peroxide into oxygen and water.
A student investigated the effect of changing the concentration of hydrogen peroxide solution on this hydrolysis.
For each concentration of hydrogen peroxide solution the time to collect of oxygen was recorded.
Table 1.1 shows the results of the student's investigation.
Table 1.1
| percentage concentration of hydrogen peroxide | time to collect of oxygen / s |
|---|---|
| 4 | 47 |
| 8 | 18 |
| 12 | 15 |
| 16 | 13 |
| 25 | 11 |
Plot a graph of the data shown in Table 1.1.
Answer
Axes
- x-axis: percentage concentration of hydrogen peroxide (no units / dimensionless, but write the heading on the axis); scale 0 to 25 in steps of 5 (5% per 2 cm).
- y-axis: time to collect 25 cm³ of oxygen / s; scale 0 to 50 in steps of 10 (10 s per 2 cm).
Plotted points (small cross, dot in circle, or cross in circle, accurate to within half a small square):
- (4, 47)
- (8, 18)
- (12, 15)
- (16, 13)
- (25, 11)
Line: a smooth curve drawn with a thin line through the five points, falling steeply from (4, 47) to (8, 18) and then levelling off through (12, 15), (16, 13) and (25, 11). No extrapolation beyond the lowest or highest point.
See graph: percentage concentration of H₂O₂ (x, 0–25 in 5% steps) plotted against time to collect 25 cm³ of O₂ / s (y, 0–50 in 10 s steps); five points (4, 47), (8, 18), (12, 15), (16, 13), (25, 11); smooth curve falling steeply then plateauing, no extrapolation.
Background Concept
A CIE graph of experimental data must use the printed grid efficiently, label both axes with quantity AND unit, choose scales that are easy to read (1, 2 or 5 units per 2 cm is the convention), plot each point accurately, and join them with an appropriate line. A line graph is used when both variables are continuous.
Understanding the Question
You are given five (x, y) data points from a student who measured the time to collect 25 cm³ of O₂ at five different H₂O₂ concentrations. You must plot them on the printed grid and draw a smooth curve through the points. There is no theoretical line to compare with, so a smooth curve is appropriate.
Approach
- Choose the scales: x-axis 0–25 in 5% steps (5 per 2 cm, so 10 cm of grid); y-axis 0–50 in 10 s steps (10 per 2 cm, so 10 cm of grid). Each scale uses at least half the grid in that direction.
- Label the axes: percentage concentration of hydrogen peroxide on the x-axis; time to collect 25 cm³ of oxygen / s on the y-axis.
- Plot each of the five points as a small cross (or dot in a circle) to within half a small square.
- Draw a smooth curve through the points — no point-to-point zig-zag, no extrapolation.
Step-by-Step Reasoning
- Scales
- x: each 2 cm = 5%, so the major gridlines are at 0, 5, 10, 15, 20, 25.
- y: each 2 cm = 10 s, so the major gridlines are at 0, 10, 20, 30, 40, 50.
- Plotting the five points
- (4, 47): 0.8 of a major x-square and 4.7 of a major y-square from the origin.
- (8, 18): 1.6 of a major x-square and 1.8 of a major y-square.
- (12, 15): 2.4 of a major x-square and 1.5 of a major y-square.
- (16, 13): 3.2 of a major x-square and 1.3 of a major y-square.
- (25, 11): exactly on the 5.0 major x-square and 1.1 of a major y-square.
- Line: the data show a steep fall from (4, 47) to (8, 18), then a more gentle decline to (25, 11). Draw a single smooth curve through all five points — no straight segments between adjacent points, no extension of the curve beyond the first or last point.
Key Takeaways
- CIE graph marks: (1) correct axes with quantity + unit, (2) a scale that uses at least half the grid in each direction, (3) accurate plotting to within half a small square, (4) an appropriate line (smooth curve here) and a thin line.
- The shape of the curve is itself the biological message: rate is high at low [H₂O₂] and falls to a plateau at high [H₂O₂] — classic enzyme-saturation kinetics.
- A line graph is used when BOTH variables are continuous; a bar chart is for a discrete x-variable.
Common Mistakes
- Plotting concentration on the y-axis — the independent variable goes on the x-axis.
- Choosing an awkward scale (e.g. 3% per 2 cm, or 7 s per 2 cm) — the marks require scales of 1, 2 or 5 units per 2 cm.
- Plotting points as large blobs that cover more than one small square — this loses the accuracy mark.
- Joining the points dot-to-dot with straight lines — for a smooth trend, draw a smooth curve.
- Extrapolating the curve beyond the highest or lowest x-value — the mark scheme explicitly rejects this.
Things to Be Careful About
- A 20 cm × 20 cm grid (or 20 × 30 as in this question) will only need 10 cm × 10 cm of the chosen scales if the data permit; the chosen scales here use the bottom-left quadrant only. That is acceptable as long as the scale uses at least half the grid in each direction.
- The point (25, 11) is on the edge of the grid; ensure the cross is exactly at the 5.0 major-square mark, not just inside the grid.
- Do NOT add a theoretical line (Michaelis–Menten, etc.) — only the data curve is required.
Explain the effect of changing the concentration of hydrogen peroxide.
Answer
- As the concentration of hydrogen peroxide increases, more substrate molecules are available to bind to the active sites of catalase, so more enzyme–substrate complexes (ESCs) form and the rate of reaction increases — the time to collect 25 cm³ of oxygen decreases.
- At low hydrogen peroxide concentrations, the substrate is the limiting factor: increasing its concentration increases the frequency of successful collisions with the active sites of catalase, so the rate continues to rise.
- At high hydrogen peroxide concentrations, all of the active sites of catalase are occupied (the enzyme is saturated), so further increases in substrate concentration have no further effect on the rate and the time levels off (the plateau on the graph). The reaction is now limited by something other than substrate — for example, the concentration of catalase, the temperature or the pH.
At low [H₂O₂] the substrate is limiting — more substrate molecules bind to the active sites of catalase, more ESCs form, and the rate (1/time) rises. At high [H₂O₂] the active sites are saturated, so further increases in substrate have no effect and the time levels off (plateau).
Background Concept
Enzymes are biological catalysts that speed up reactions by binding their substrate at the active site to form an enzyme–substrate complex (ESC). For a fixed amount of enzyme, the rate of reaction depends on how often substrate molecules encounter the active sites. As substrate concentration rises, the rate of formation of ESCs rises — until every active site is occupied (the enzyme is saturated), at which point the rate reaches a maximum (V_max) and further increases in substrate have no effect.
Understanding the Question
You are given a graph showing the time to collect 25 cm³ of O₂ at five H₂O₂ concentrations. The curve falls steeply at first and then flattens. You must EXPLAIN this shape in terms of the active-site model of enzyme action. The mark scheme awards a mark for invoking substrate–active-site binding, a mark for using the term "active site" or "ESC", and a mark for identifying the plateau as enzyme saturation.
Approach
- State the direction of the effect and link it to substrate–active-site binding.
- Explain why the effect gets smaller as concentration rises (active sites become occupied).
- Explain the plateau in terms of saturation and what is now limiting the reaction.
Step-by-Step Reasoning
- At low [H₂O₂] the active sites of catalase are not all occupied; the substrate is the limiting factor. Increasing [H₂O₂] increases the frequency of successful collisions between H₂O₂ molecules and the active sites, so more enzyme–substrate complexes form per unit time, the rate of reaction rises, and the time to collect 25 cm³ of O₂ falls sharply.
- At intermediate [H₂O₂] a growing fraction of the active sites are occupied at any one moment; the curve continues to fall but more gently.
- At high [H₂O₂] essentially all of the active sites are occupied — the enzyme is saturated. Adding more substrate cannot increase the number of ESCs because there are no free active sites left. The rate reaches V_max and the time levels off (the plateau). The reaction is now limited by something other than substrate: the concentration of catalase, the temperature, or the pH.
The shape of the graph (steep fall then plateau) is therefore a direct visual signature of the active-site model of enzyme action.
Key Takeaways
- A reaction that gets faster as substrate concentration rises is doing so because more substrate molecules can bind to the active sites — invoke the active site / ESC explicitly.
- A plateau on a rate-vs-concentration graph means the enzyme is saturated: all active sites are full and the substrate is no longer limiting.
- After the plateau, the rate is limited by enzyme concentration, temperature or pH — not by substrate.
Common Mistakes
- Saying the reaction "slows down" or "decreases" — the mark scheme explicitly rejects this. The rate is RISING throughout the data; it is the increase that gets smaller, until the curve levels off. The reaction does not slow down, it reaches a maximum.
- Confusing rate and time — the time to collect O₂ falls as the rate rises; do not say the reaction slows when you mean the time gets shorter.
- Not naming the active site / ESC — the mark scheme requires the term "active site" or "enzyme–substrate complex". "The enzyme binds the substrate" alone does not earn this mark.
- Citing temperature or pH as the cause of the plateau when the data are at fixed temperature and pH — the plateau is enzyme saturation, not a temperature or pH effect.
- Saying "the enzyme is denatured" — denaturation is irreversible loss of structure; it is not what is happening here.
Things to Be Careful About
- The rate is INVERSELY related to the time plotted on the y-axis: a fall in time = a rise in rate.
- Use the precise terms "active site" and "enzyme–substrate complex (ESC)" rather than paraphrases.
- Distinguish the two regions of the curve: low [H₂O₂] (substrate limiting) vs high [H₂O₂] (enzyme saturated). Both need to be addressed for full marks.
The rest of this paper
1 more questions- Q2Use of the Light Microscope · Presentation of Data and Observations · Analysis, Conclusions and Evaluation18M