Biology 9700/33 — May/June 2012
Cambridge AS Level · Advanced Practical Skills · worked solutions for every part, with the mark scheme
Topics Presentation of Data and Observations · Analysis, Conclusions and Evaluation · Manipulation, Measurement and Observation · Use of the Light Microscope
When onion cells are placed into a sodium chloride solution with a higher concentration than the cells, water leaves the vacuoles and the cells become plasmolysed. In each concentration there will be cells which may show different states of plasmolysis.
You are provided with four samples of onion tissue, each soaked in a different concentration of sodium chloride solution, labelled S1, S2, S3 and S4.
| labelled | concentration of sodium chloride solution / |
|---|---|
| S1 | 0.8 |
| S2 | 0.4 |
| S3 | 0.2 |
| S4 | unknown |
You are required to:
- observe and record the cells at different states of plasmolysis in S1, S2, S3 and S4
- use these results to answer (a)(iii) concerning the unknown concentration in S4.
Fig. 1.1 will help you decide on the state of plasmolysis of the onion cells.
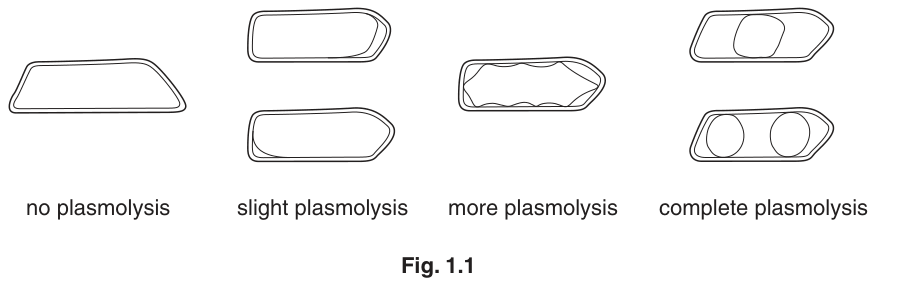
Fig. 1.1
You are advised to read steps 1 to 10 before proceeding.
Proceed as follows:
- Label one dry and clean microscope slide S1 and put the slide on a paper towel.
- Put a few drops of the sodium chloride solution from S1 onto the slide.
- Remove a piece of the onion tissue from solution S1 and, using forceps or fingers, peel off the inner concave epidermis, as shown in Fig. 1.2.
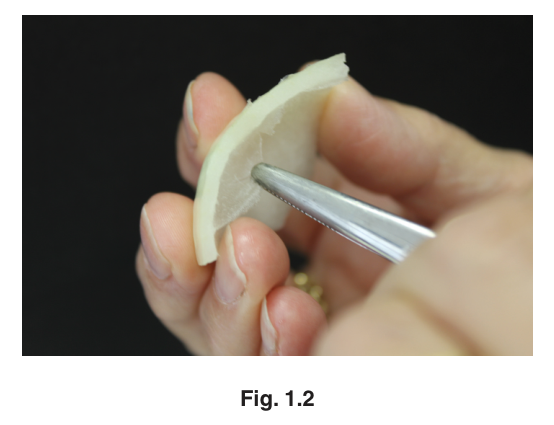
Fig. 1.2
- Cut one piece of the epidermis that will fit under a coverslip. Replace the remaining epidermis into the solution in S1.
- Place the epidermis in the sodium chloride solution on the slide as shown in Fig. 1.3. If the epidermis is folded, you may need to add more drops of sodium chloride solution so that it floats and uncurls. It is important to prevent the epidermis from drying out.
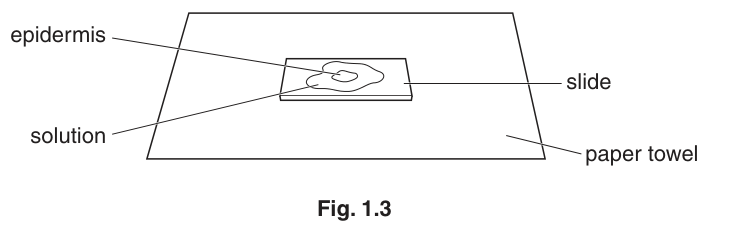
Fig. 1.3
- Cover the epidermis on the slide with a coverslip and use a paper towel to remove any excess liquid that is outside the coverslip.
- Observe the states of plasmolysis of the cells using the microscope.
- You may need to reduce the amount of light entering the microscope to observe the cells clearly.
Describe how you will obtain accurate results to record the cells at different states of plasmolysis.
Prepare the space below for recording your results.
- Record your results for S1 as you have described in (a)(i).
- Repeat steps 1 to 9 with S2, S3 and S4.
Use your results to complete the following statement.
The sodium chloride concentration of the unknown sample, S4, is between
______ and ______ .
Identify one significant source of error in using Fig. 1.1 to obtain your results.
Suggest how you would make three improvements to this investigation.
A student investigated the effect of different sodium chloride concentrations on red blood cells.
Red blood cells are destroyed (haemolysed) when placed in a sodium chloride solution with a lower concentration than the cells.
The student’s results are shown in Table 1.1.
Table 1.1
| concentration of sodium chloride / | percentage of red blood cells destroyed |
|---|---|
| 5.5 | 100 |
| 6.0 | 96 |
| 6.5 | 74 |
| 7.0 | 31 |
| 7.5 | 10 |
| 8.0 | 0 |
Plot a graph of the data shown in Table 1.1.

State the sodium chloride concentration at which 50% of the red blood cells are destroyed.
Show on the graph how you obtained the concentration.
Sodium chloride concentration = ______
Explain what is happening between the red blood cells and the external solutions when 0 and 100% of red blood cells are destroyed.
0% red blood cells destroyed
100% red blood cells destroyed
The rest of this paper
1 more questions- Q2Presentation of Data and Observations · Use of the Light Microscope · Analysis, Conclusions and Evaluation21M