Biology 9700/32 — May/June 2012
Cambridge AS Level · Advanced Practical Skills · worked solutions for every part, with the mark scheme
Topics Presentation of Data and Observations · Analysis, Conclusions and Evaluation · Manipulation, Measurement and Observation · Use of the Light Microscope
Enzyme E catalyses the hydrolysis of starch. Starch can be found on the surface of some types of paper.
The end-point of this hydrolysis is the change of stained paper from blue/black to a light blue or white.
You are required to:
- make different concentrations of the enzyme solution, E
- investigate the effect of different concentrations of E, by finding the time taken for the blue/black colour of a square of paper to change to light blue or white.
You are provided with:
| labelled | contents | hazard | percentage concentration | volume / |
|---|---|---|---|---|
| E | enzyme solution | irritant harmful | 1.0 | 50 |
| W | distilled water | none | – | 50 |
| iodine | iodine in potassium iodide solution | irritant harmful | diluted | – |
Decide on the concentrations of E you will use in your investigation.
You will need to make up to of each E concentration.
Prepare the space provided on page 3 to show:
- the concentrations of E
- the volumes of E
- the volumes of W.
Use this space:
You are advised to read steps 1 to 12 before proceeding.
Proceed as follows:
- Prepare the concentrations of enzyme solution as stated in (a)(i).
- Cut one piece of white paper , from the grid on page 15.
- Make a single cut, long, in the end of a wooden splint as shown in Fig. 1.1.
- Fit the piece of paper into the cut as shown in Fig. 1.2.
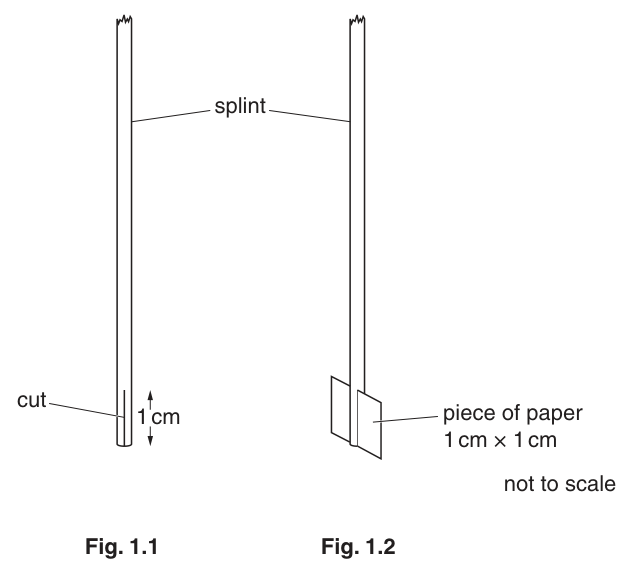
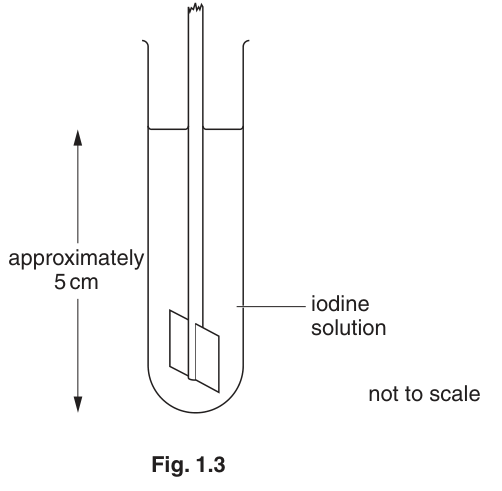
- Put the piece of paper into the iodine solution, as shown in Fig. 1.3, for at least 30 seconds so that the paper is evenly stained.
This should be used as the colour standard.
- Put one of the concentrations of E into a test-tube to a depth of .
- Repeat steps 2 to 5.
- Put this splint and its piece of stained paper into the test-tube containing E, as shown in Fig. 1.4.
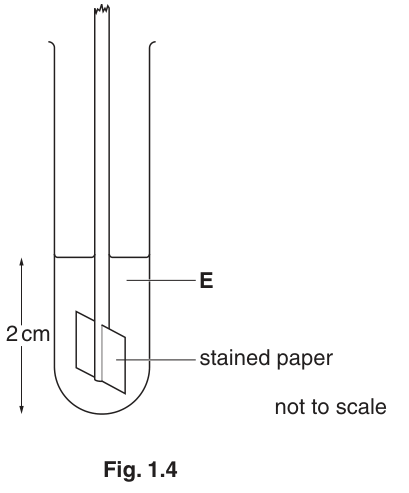
- Start timing.
- Occasionally mix the contents by moving the test-tube.
- Record the time taken for the stained paper to reach the end-point.
If the end-point is not reached at three minutes, stop timing. Record this as ‘more than 180’.
- Repeat steps 6 to 11 with each of the other concentrations of E.
Prepare the space below and record your results.
Describe how you would set up a control using the apparatus provided.
Fig. 1.5 shows the ruler used by a student in step 6 to measure the depth of E.
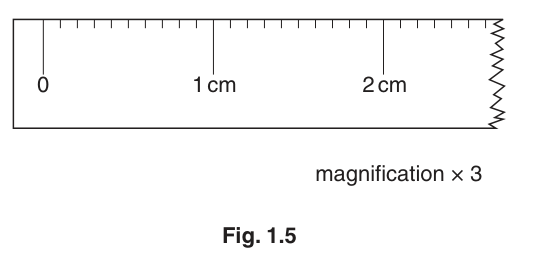
State the degree of uncertainty of the measurements using this ruler.
Identify two significant sources of error in your investigation.
Suggest how you would make two improvements to this investigation.
Lactase is an enzyme which catalyses the hydrolysis of lactose.
Lactase can be held on the surface of alginate beads (immobilised) and put into lactose solution.
A student investigated the effect of varying the size of alginate beads on the rate of reaction of lactase on lactose.
Other variables were considered and kept to a standard. There were 10 beads of each diameter.
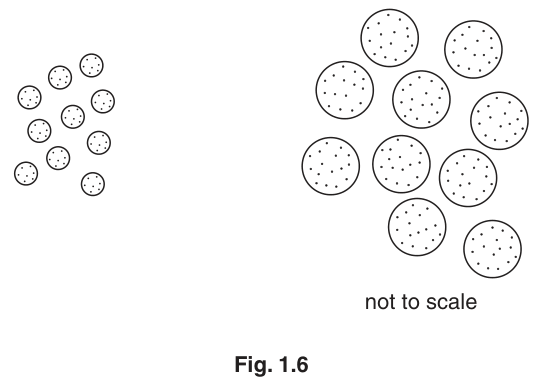
Fig. 1.6 shows two of the sets of beads and the distribution of the lactase molecules.
The results of the student’s investigation are shown in Table 1.1.
Table 1.1
| bead diameter / mm | mass of product in a minute / |
|---|---|
| 1.0 | 24.0 |
| 1.5 | 30.5 |
| 3.0 | 42.0 |
| 4.5 | 50.0 |
| 6.0 | 52.5 |
Plot a graph of the data shown in Table 1.1.
From your graph state the mass of product formed in a minute for immobilised lactase beads of diameter.
Explain the effect of immobilised lactase bead diameter on the mass of product formed in a minute, using the data and Fig. 1.6.
The rest of this paper
1 more questions- Q2Use of the Light Microscope · Presentation of Data and Observations · Analysis, Conclusions and Evaluation18M