Biology 9700/36 — October/November 2011
Cambridge AS Level · Advanced Practical Skills · worked solutions for every part, with the mark scheme
Topics Analysis, Conclusions and Evaluation · Manipulation, Measurement and Observation · Presentation of Data and Observations · Use of the Light Microscope
Enzyme E catalyses the hydrolysis of sucrose to glucose and fructose.
By adding enzyme E to different concentrations of sucrose the reducing sugars, glucose and fructose, will be formed. After a set time, the presence of reducing sugars can be determined by using Benedict’s solution.
The end-point of this investigation is the time taken for the reducing sugars to change the colour of Benedict’s solution from blue to the first colour you see (ignore any further colour changes).
You are required to find the sucrose concentration of a sample, U, by using the results of Benedict’s tests on the reaction of enzyme E on different concentrations of sucrose.
You are provided with:
| labelled | contents | hazard | percentage concentration | volume / |
|---|---|---|---|---|
| E | invertase solution | irritant | – | 25 |
| S | sucrose solution for serial dilution | none | 10 | 25 |
| U | sucrose solution | none | unknown | 10 |
| Benedict’s solution | Benedict’s solution | harmful irritant | – | 60 |
| W | distilled water | none | – | 150 |
You are required to carry out a serial dilution of sucrose solution, S, to reduce the concentration of the sucrose solution by half between each successive dilution.
Fig. 1.1 shows how to make the first concentration of 5% sucrose solution.
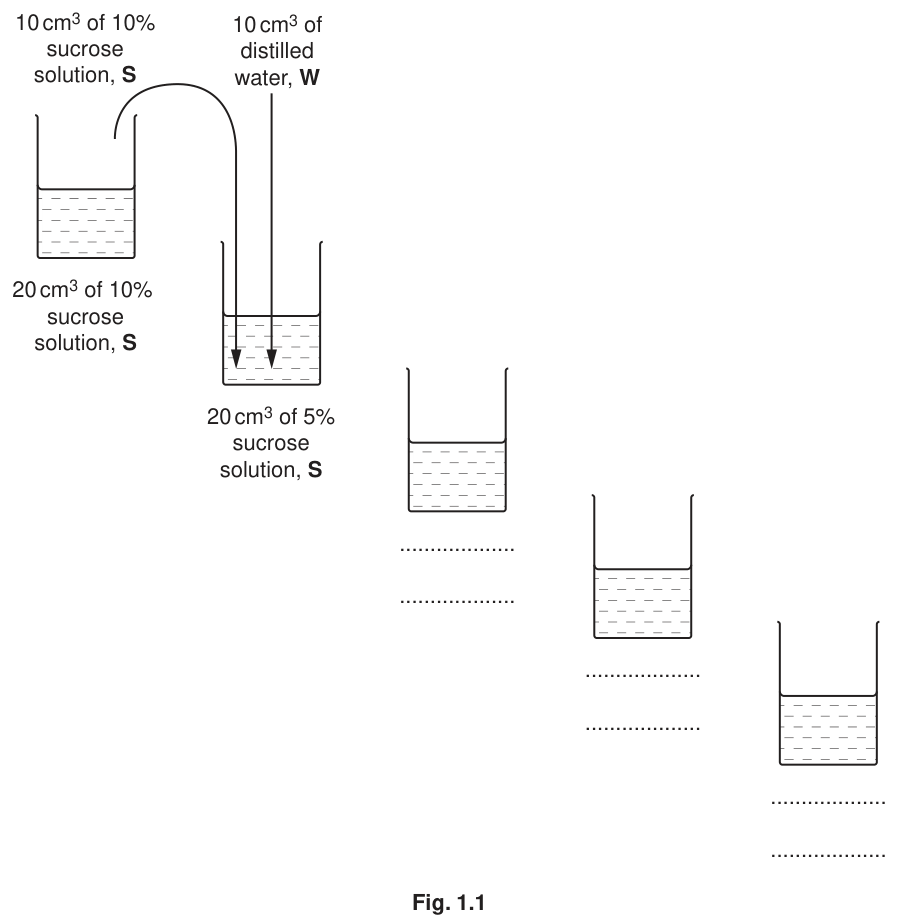
Complete Fig. 1.1 to show how you will make three further concentrations of sucrose solution, S.
As part of this investigation you are required to set up a suitable control.
Describe how you will set up this control using the apparatus provided.
You are advised to read steps 1 to 11 before proceeding.
Proceed as follows:
- Prepare the concentrations of sucrose solution as shown in Fig. 1.1, in the containers provided.
- While you are doing steps 3 to 7 you will need to be heating up the water in the beaker labelled for Benedict’s test to a temperature of more than 80 °C.
- Put 2 of the 10% sucrose solution, S into a labelled test-tube.
- Put 2 of E into the same test-tube.
- Repeat steps 3 and 4 with each of the concentrations of sucrose and U.
- Set up your control.
- Put all the test-tubes into the water-bath labelled for reaction, between 35 °C and 40 °C, for 8 minutes.
- After the test-tubes have been in the water-bath for 8 minutes, remove the test-tubes.
- Put 4 of Benedict’s solution into each test-tube.
- Put all the test-tubes into the water-bath at more than 80 °C and immediately start timing.
- Record the time for the change from blue to the first colour you see (ignore any further colour changes). If there is no colour change after 10 minutes, record ‘more than 600’.
Prepare the space below and record your results.
Using your results, complete the following statement.
The concentration of the unknown sucrose sample, U, is between ______ % sucrose solution and ______ % sucrose solution.
Suggest how you would modify this investigation to obtain a more accurate estimate of the sucrose concentration in sample U.
Peas are preserved by storing them in a freezer at low temperatures.
However, during storage peas lose some of their Vitamin C content.
The effect of temperature, on Vitamin C content, was investigated in peas at two temperatures, –12 °C and –6 °C.
The Vitamin C content of peas was measured before being placed in cold storage and then at 20 day intervals.
The results are shown in Table 1.1.
Table 1.1
| storage / days | percentage of Vitamin C content at –12 °C | percentage of Vitamin C content at –6 °C |
|---|---|---|
| 0 (before freezing) | 100 | 100 |
| 20 | 95 | 64 |
| 40 | 89 | 43 |
| 60 | 86 | 13 |
Plot a graph of the data shown in Table 1.1.
A hypothesis was suggested that:
Peas stored for 60 days at 10 °C would contain no vitamin C.
State whether you support this hypothesis and use the results to explain the reasons for your answer.
Find the difference in Vitamin C content of peas at 26 days stored at the two different temperatures.
Show on your graph where you obtained the data.
______ %
The rest of this paper
1 more questions- Q2Use of the Light Microscope · Analysis, Conclusions and Evaluation21M