Biology 9700/34 — October/November 2011
Cambridge AS Level · Advanced Practical Skills · worked solutions for every part, with the mark scheme
Topics Presentation of Data and Observations · Analysis, Conclusions and Evaluation · Manipulation, Measurement and Observation · Use of the Light Microscope
The blue-green agar blocks contain an indicator.
The investigation involves placing different sizes of agar blocks into dilute hydrochloric acid. As the acid moves (diffuses) into the agar blocks the indicator loses its blue-green colour.
You are required to investigate the independent variable, surface area to volume ratio of the agar blocks.
You are provided with:
| labelled | contents | hazard | details |
|---|---|---|---|
| H | hydrochloric acid | irritant | enough to cover the blocks in the containers provided |
| A | agar block | irritant | one block containing an indicator |
You must not touch the agar blocks with your hands. Use the blunt forceps and paper towel to handle the blocks.
If you get hydrochloric acid on your skin, wash off with cold water.
You are required to prepare four different sizes of agar blocks.
You will require three blocks of each size.
You are advised to read steps 1 to 6 before proceeding.
Proceed as follows:
- Cut the agar block provided into blocks, each . Cut the blocks on the white tile or chopping board provided.
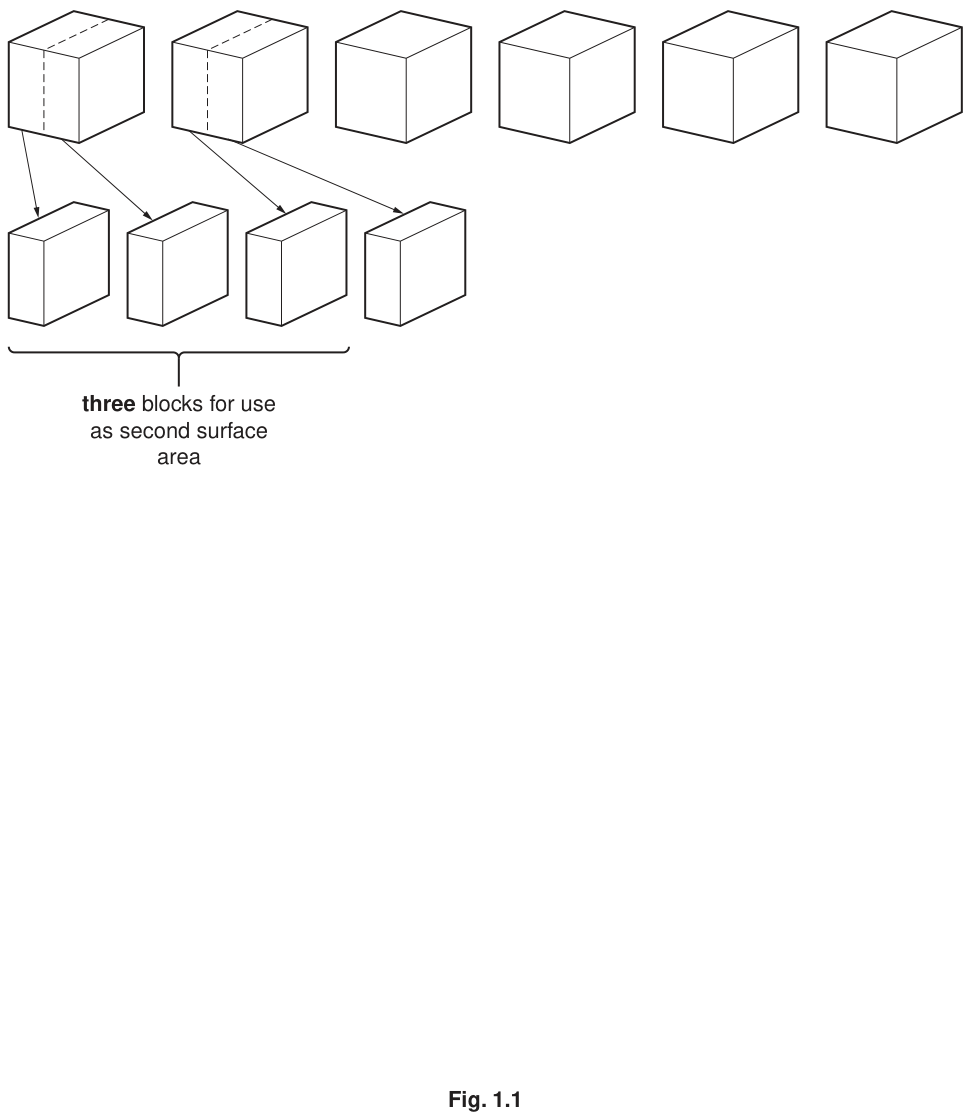
Fig. 1.1 shows how to obtain blocks with a different surface area compared with the blocks in step 1.
- Cut two of the blocks as shown in Fig. 1.1 to obtain the blocks you need for the next surface area.
You may use the space on Fig. 1.1 to work out how to cut two further sizes of blocks with different surface areas.
-
Cut two further sizes of blocks with different surface areas. You will need three blocks of each of the four sizes of block.
-
Put three of each size of block into the beaker or container using blunt forceps.
-
Put H into this beaker or container to cover the blocks and start timing.
-
Observe the blocks for the disappearance of the blue-green colour. This is the end-point of the reaction. As soon as you see the green colour disappear record the time taken for each block to reach the end-point. If any block remains blue-green at 15 minutes, record "more than 15".
The different sizes of agar blocks have different surface areas and volumes.
Complete Table 1.1.
Table 1.1
| dimensions / cm | surface area / | volume / | surface area : volume ratio |
|---|---|---|---|
| 6 | 1.0 | 6:1 | |
| 4 | 0.5 | 8:1 | |
Prepare the space below and record your results.
Identify two significant sources of error in your investigation.
A student investigated the effect of temperature on the rate of breathing in fish. Fish take water in through the mouth and force it over the gills when the mouth closes. Oxygen diffuses from the water into the gills. The gill cover opens to allow the water to leave as shown in Fig. 1.2.
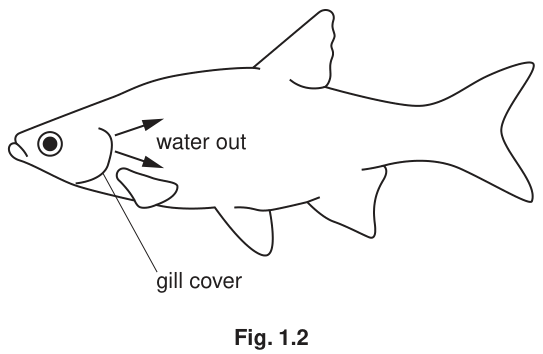
Fig. 1.2
A fish was placed in a bag partly filled with water. The bag, containing the fish, was placed in a large beaker containing water at .
The number of times the gill cover opened in one minute was recorded. The bag containing the fish was removed and the temperature of the water in the beaker was raised to .
A bag containing a different fish of the same species was then put into the beaker. The number of times the gill cover opened in one minute was counted.
This procedure was repeated using a different fish of the same species for each temperature as shown in Table 1.2. However, the student decided that the temperature would not be increased to above as this might damage the fish.
Suggest how you might control three of the variables in the student's investigation.
Table 1.2 shows the results of this investigation.
Table 1.2
| temperature / | rate of breathing / number |
|---|---|
| 5 | 4 |
| 10 | 16 |
| 15 | 24 |
| 20 | 31 |
| 25 | 39 |
Plot a graph of the data shown in Table 1.2.
Describe and explain the effect of the temperature on the rate of breathing in this species of fish.
The rest of this paper
1 more questions- Q2Use of the Light Microscope · Analysis, Conclusions and Evaluation · Presentation of Data and Observations20M