Biology 9700/33 — October/November 2011
Cambridge AS Level · Advanced Practical Skills · worked solutions for every part, with the mark scheme
Topics Presentation of Data and Observations · Manipulation, Measurement and Observation · Analysis, Conclusions and Evaluation · Use of the Light Microscope
Protein concentration may vary in samples of milk and can be measured by using potassium hydroxide solution and copper sulfate solution.
Fig. 1.1 shows the result of adding potassium hydroxide solution and copper sulfate solution to a sample of milk.
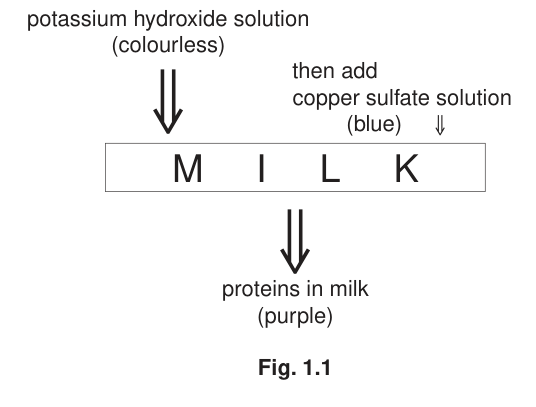
You are provided with:
| labelled | contents | hazard | percentage concentration | volume / |
|---|---|---|---|---|
| K | potassium hydroxide solution | harmful irritant corrosive | – | 20 |
| C | copper sulfate solution | harmful | – | 20 |
| M | milk for serial dilution | none | 50 | 20 |
| U | milk sample | none | unknown | 10 |
| W | distilled water | none | – | 120 |
You are advised to wear safety glasses or goggles, especially when using the potassium hydroxide, K. If potassium hydroxide, K, comes into contact with your skin then wash off with plenty of cold water.
You are required to estimate the protein concentration of a sample, U.
You are required to carry out a serial dilution of milk, M, to reduce the concentration of the milk by ten-fold between each successive dilution.
Fig. 1.2 shows how to make the first concentration of 5% of milk, M.
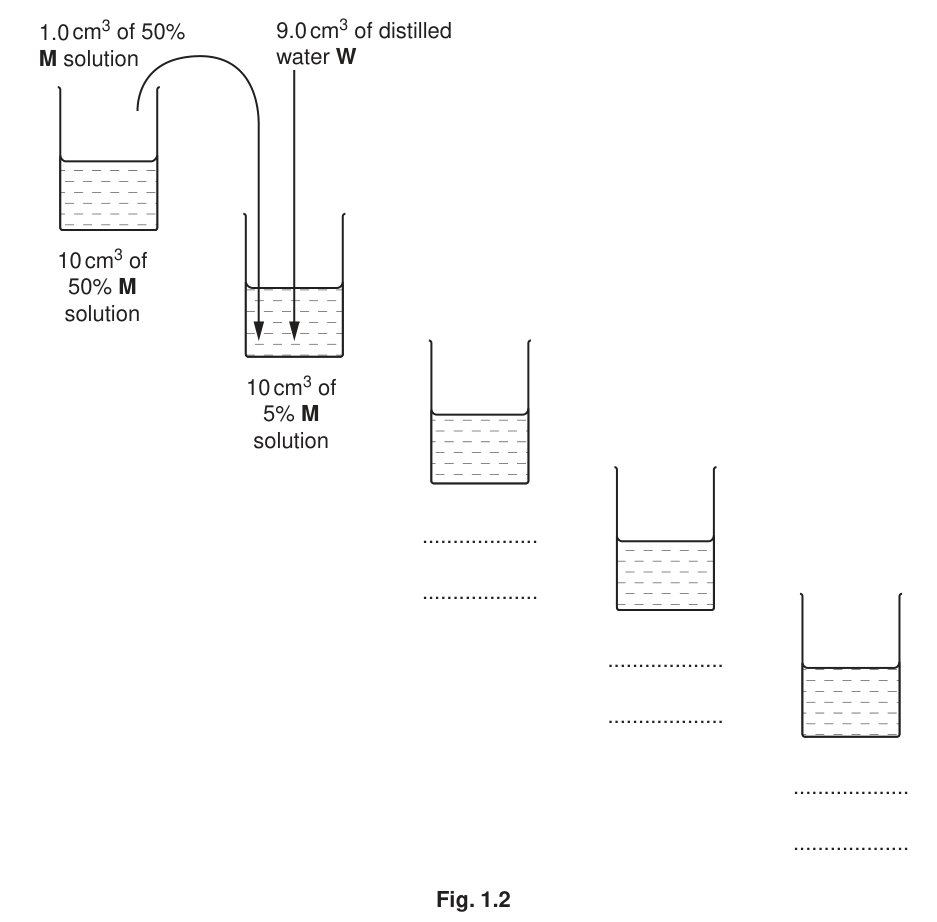
Complete Fig. 1.2 to show how you will make three further concentrations of milk, M.
A separate syringe must be used for the 50% sample of milk because it is so thick.
A second syringe must be used for the other concentrations.
Proceed as follows:
- Prepare the concentrations of milk as shown in Fig. 1.2, in the containers provided.
- Label five test-tubes with the five concentrations of milk.
- Put of each concentration into the labelled test-tubes.
- Put of U into a test-tube, labelled U.
- Put of W into a test-tube, labelled W.
- Put of K into each test-tube. Shake gently to mix.
- Put of C into each test-tube. Shake gently to mix.
- Record your observations.
- In the test-tube rack put the test-tubes in an order which will enable you to record each colour as a number using the scale below.
0 1 2 3 4 5 6 7 8 9 10
blue (no purple) -> darkest purple
Prepare the space below and record your observations and the number using the scale opposite.
Complete the diagram below to show the position of each of the concentrations of M.
Write the letter U to show where it fits in the series of concentrations.

The protein concentration of the 50% milk, M was .
Complete the following statement.
The protein concentration of the unknown milk sample, U, is between ______ and ______ .
Suggest how you would modify this investigation to obtain a more accurate estimate of the protein concentration in milk sample U.
Fig. 1.3 shows the apparatus used by a student to investigate the action of a protein digesting enzyme (protease).
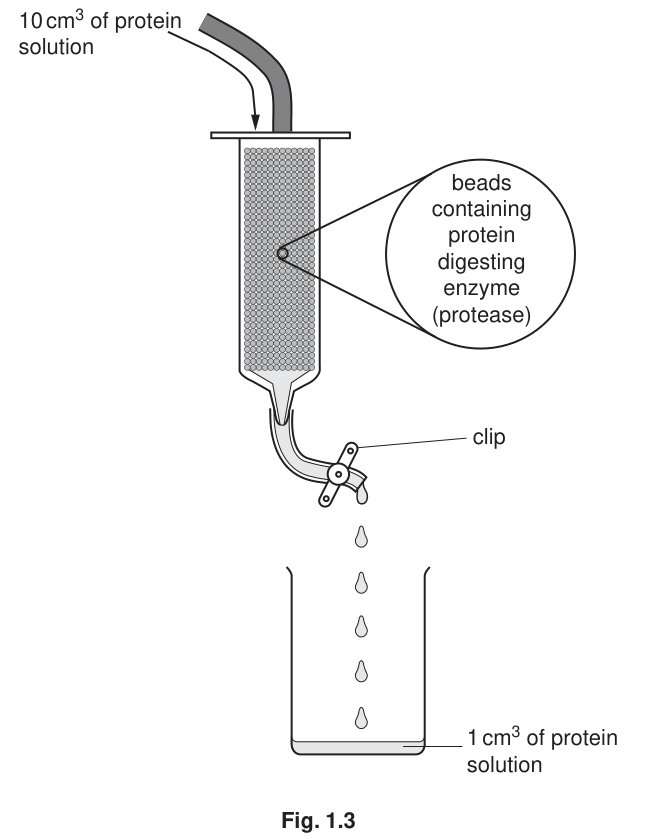
A student poured of a solution containing of protein into the syringe containing beads. The beads contain protease.
At first the clip was fully open and it took 6 seconds to collect a sample of the protein solution.
The student poured away the remaining protein solution, washed the beads and put them back into the syringe. The student repeated the procedure with fresh protein solution and slightly closed the clip so that it took 15 seconds to collect a sample of the protein solution.
This procedure was carried out three more times closing the clip more each time. The student measured the concentration of protein in each of the samples.
The results of the student’s investigations are shown in Table 1.1.
Table 1.1
| time taken to collect sample of protein solution / s | concentration of protein in sample of protein solution / |
|---|---|
| 6 | 92 |
| 15 | 70 |
| 22 | 56 |
| 31 | 38 |
| 39 | 20 |
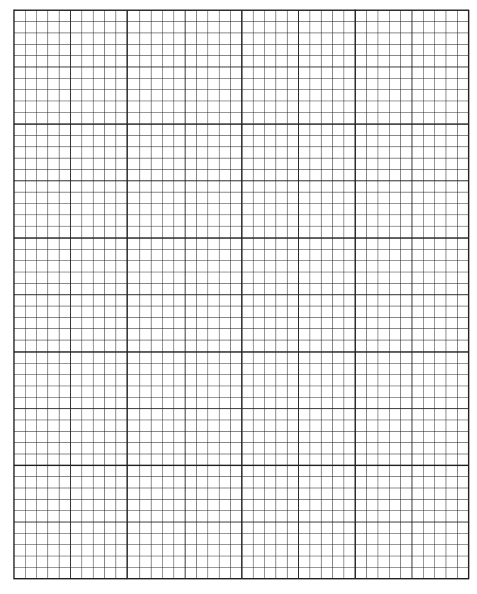
Plot a graph of the data shown in Table 1.1.
Describe and explain the trend in the results.
Fig. 1.4a and Fig. 1.4b show the start and finish times for the student’s second investigation.
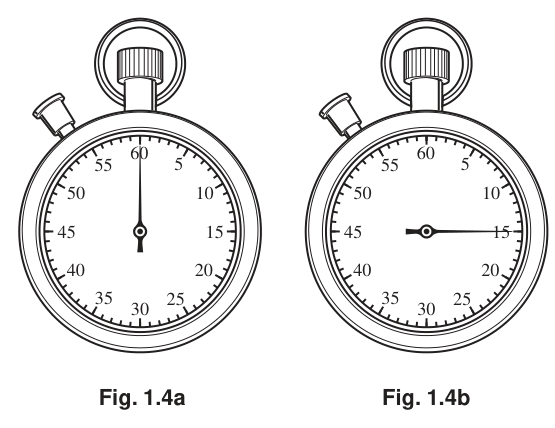
Use the information from Fig. 1.4a and Fig. 1.4b to calculate the percentage error of the time taken.
You may lose marks if you do not show your working or if you do not use appropriate units.
percentage error = ______
The rest of this paper
1 more questions- Q2Use of the Light Microscope · Presentation of Data and Observations18M