Biology 9700/31 — October/November 2011
Cambridge AS Level · Advanced Practical Skills · worked solutions for every part, with the mark scheme
Topics Analysis, Conclusions and Evaluation · Manipulation, Measurement and Observation · Presentation of Data and Observations · Use of the Light Microscope
Substrate S reacts with water as shown in the following equation:
Enzyme E catalyses this reaction.
You are provided with:
| labelled | contents | hazard | percentage concentration | volume / |
|---|---|---|---|---|
| E | enzyme | irritant | – | 20 |
| S | substrate | irritant | 0.1 | 20 |
| P | phenolphthalein solution | irritant | – | 20 |
| W | distilled water | none | – | 100 |
The product forms an alkaline solution which causes phenolphthalein to turn pink.
The first appearance of the pink colour will be used to indicate the end-point of the reaction.
You are required to investigate the independent variable, concentration of substrate solution, S.
You are required to carry out a serial dilution of the substrate solution, S, to reduce the concentration of the substrate solution by half between each successive dilution.
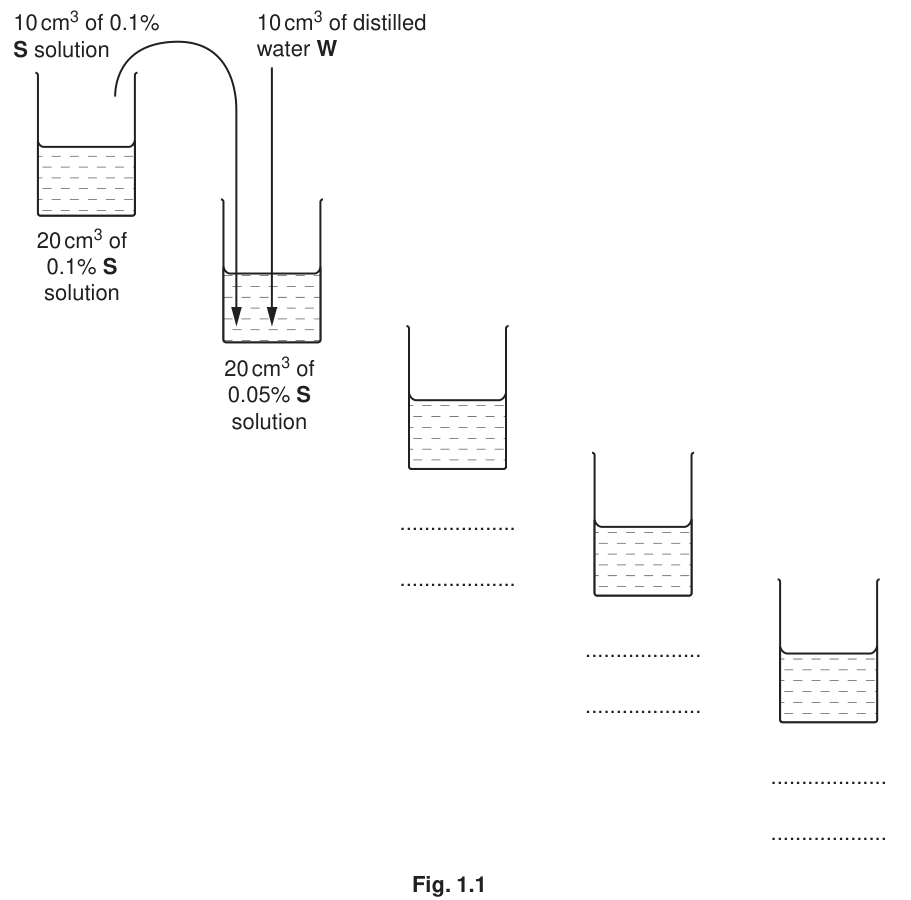
Fig. 1.1 shows how to make the first concentration of 0.05% substrate solution.
Complete Fig. 1.1 to show how you will make three further concentrations of substrate solution, S.
Proceed as follows:
- Prepare the concentrations of substrate solution as shown in Fig. 1.1, in the containers provided.
- Put of 0.1% substrate solution, S into a labelled test-tube.
- Put of phenolphthalein solution into the same test-tube.
- Put of enzyme E into the same test-tube. Mix and start timing.
- Record the time taken to reach the end-point of the reaction.
If the end-point is not reached at ten minutes, record ‘more than 600’ for that concentration.
- Repeat steps 2 to 5 with each of the concentrations of substrate solution.
Prepare the space below and record your observations.
State one variable which should have been controlled and how you could modify this procedure so that this variable would be controlled.
Describe two ways in which the accuracy of the results could be improved.
A student investigated the effect of an inhibitor on an enzyme.
A strip of agar gel containing the enzyme and its substrate was produced. The enzyme breaks down (hydrolyses) the substrate to release a product which stains black when a dye is added.
Small drops () of different concentrations of the inhibitor were put onto the surface of the agar gel strip. After 10 minutes the agar gel strip was treated with the dye.
Fig. 1.2 shows a diagram of the strip of agar gel after adding the dye. This is not to scale.
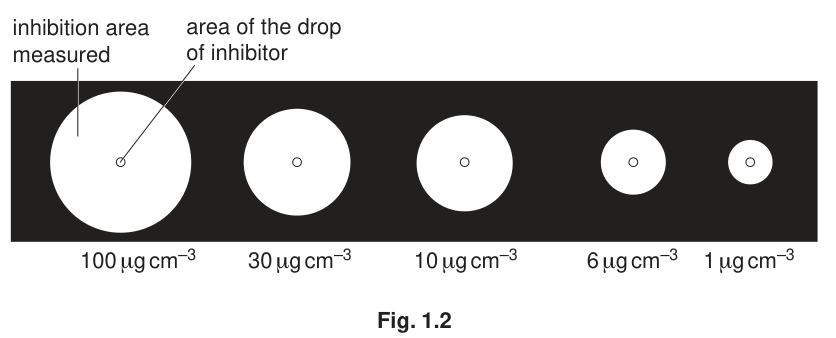
The student’s results are shown in Table 1.1.
Table 1.1
| concentration of inhibitor / | inhibition area / |
|---|---|
| 1 | 30 |
| 6 | 50 |
| 10 | 70 |
| 30 | 106 |
| 100 | 120 |
Plot a graph of the data shown in Table 1.1
Estimate the concentration of inhibitor which would produce an inhibition area of . Show on your graph where you obtained the estimate.
concentration = ______
Describe the trend shown in your graph.
Explain the effect of changing the concentration of the inhibitor.
The rest of this paper
1 more questions- Q2Use of the Light Microscope · Analysis, Conclusions and Evaluation20M