Biology 9700/33 — May/June 2011
Cambridge AS Level · Advanced Practical Skills · worked solutions for every part, with the mark scheme
Topics Analysis, Conclusions and Evaluation · Manipulation, Measurement and Observation · Presentation of Data and Observations · Use of the Light Microscope
Urea reacts with water to form ammonium carbonate.
Enzyme E catalyses this reaction.
Aqueous ammonium carbonate produces ammonium ions. This forms an alkaline solution which causes red litmus paper to turn blue. This will be used to indicate the end-point of the reaction.
Animals release urea into the soil in urine and ammonium carbonate is produced as part of the nitrogen cycle.
You are provided with:
| labelled | contents | hazard | concentration / % | volume / |
|---|---|---|---|---|
| E | urease solution | irritant | 10 | 25 |
| W | distilled water | none | – | 100 |
| U | urea solution | none | – | 25 |
| labelled | contents | hazard | details | quantity |
|---|---|---|---|---|
| red litmus paper | – | – | total length of about | 1 strip |
You are required to investigate the independent variable, enzyme E concentration on the formation of ammonium carbonate.
You are required to carry out a serial dilution of enzyme E, to reduce the concentration of the enzyme solution by half between each successive dilution.
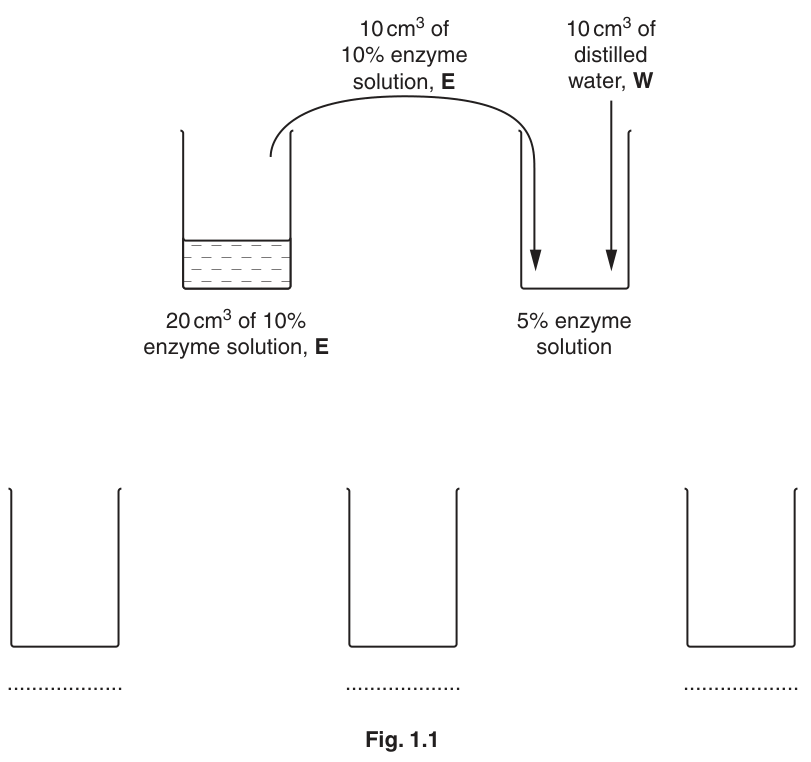
Fig. 1.1 shows how to make the first concentration of 5% enzyme E solution.
Complete Fig. 1.1 to show how you will make three further concentrations of enzyme E solution.
As part of this investigation you are required to set up a suitable control.
Describe how you will set up this control using the apparatus provided.
Proceed as follows:
- Prepare the concentrations of E as shown in Fig. 1.1 in the containers provided.
- Label test-tubes with the concentrations of E and the control.
- Cut the red litmus paper into lengths of . Add one piece of litmus paper to each test-tube.
- Put of U into each test-tube.
- Put of the lowest concentration of E into the labelled test-tube and mix well.
- Repeat step 5 with each of the other concentrations of E and the control. Immediately start timing.
- Record the time taken for the first appearance of blue colour in each piece of litmus paper. This is the end-point of the reaction.
If a piece of litmus paper does not reach the end-point in ten minutes, record 'more than 600' for that dilution as your result.
Prepare the space below and record your results.
Calculate the rate of reaction for the 10% E concentration.
rate of reaction = ______
Identify one significant error in your investigation.
Suggest how you would make two improvements to this investigation.
An investigation on global nitrogen fixation, from 1990 to 2000, studied the quantities of nitrogen fixed by different methods.
The results are shown in Table 1.1.
Table 1.1
| method of fixation | example of method | nitrogen fixed / millions tonnes of nitrogen per year |
|---|---|---|
| industrial (I) | formation of nitrogen dioxide e.g. car engines | 23 |
| agricultural (A) | fixation by leguminous plants e.g. peas and beans | 39 |
| depositional (D) | fixation by lightning | 54 |
| natural (N) | fixation in any uncultivated areas e.g. lakes, woodlands, seas | 108 |
| fertiliser production (F) | production of inorganic fertilisers e.g. ammonium nitrate | 77 |
Plot a chart of the data shown in Table 1.1.

Natural fixation in the years 1840–1850 was 123 million tonnes per year.
Natural fixation in the years 1990–2000 was 108 million tonnes per year.
Calculate the percentage decrease from 1840–1850 to 1990–2000.
You may lose marks if you do not show your working.
______ %
Suggest one reason for the difference in the natural fixation between 1840–1850 and 1990–2000.
The rest of this paper
1 more questions- Q2Use of the Light Microscope · Analysis, Conclusions and Evaluation20M