Biology 9700/32 — May/June 2011
Cambridge AS Level · Advanced Practical Skills · worked solutions for every part, with the mark scheme
Topics Presentation of Data and Observations · Analysis, Conclusions and Evaluation · Use of the Light Microscope · Manipulation, Measurement and Observation
Doctors use the analysis of urine to help diagnose some medical conditions. One such medical condition is diabetes which results in glucose being released in urine if the condition is untreated.
You are provided with:
| labelled | contents | hazard | concentration / % | volume / |
|---|---|---|---|---|
| G | glucose solution | none | 4 | 30 |
| S1 | unknown glucose concentration representing urine | none | – | 15 |
| S2 | unknown glucose concentration representing urine | none | – | 15 |
| W | distilled water | none | – | 100 |
| Benedict’s solution | Benedict’s solution | harmful irritant | – | 50 |
You are required to find the glucose concentrations of solutions S1 and S2.
You are required to carry out a serial dilution of glucose solution, G, to reduce the concentration of the glucose solution by half between each successive dilution.
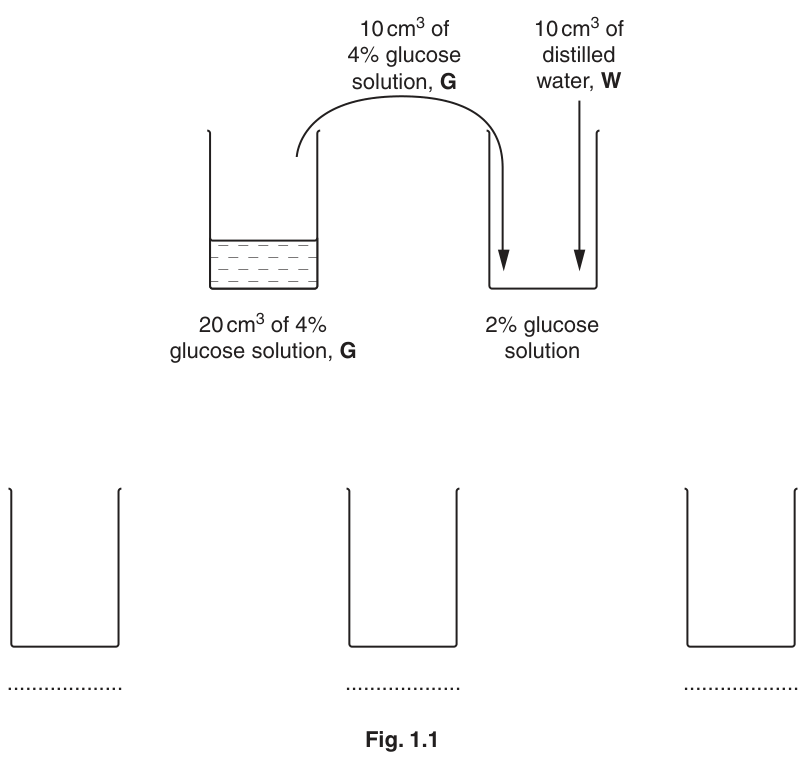
Fig. 1.1 shows how to make the first concentration of 2% glucose solution.
Complete Fig. 1.1 to show how you will make three further concentrations of glucose solution, G.
Answer
Complete Fig. 1.1 by adding the following to each of the three empty beakers:
- First beaker: arrow from the 2% glucose beaker labelled 10 cm³ of 2% glucose solution and a second arrow labelled 10 cm³ of distilled water, W. Label below: 1% glucose solution.
- Second beaker: arrow from the 1% beaker labelled 10 cm³ of 1% glucose solution and a second arrow labelled 10 cm³ of distilled water, W. Label below: 0.5% glucose solution.
- Third beaker: arrow from the 0.5% beaker labelled 10 cm³ of 0.5% glucose solution and a second arrow labelled 10 cm³ of distilled water, W. Label below: 0.25% glucose solution.
Three further beakers labelled 1%, 0.5% and 0.25% glucose, each prepared by transferring 10 cm³ of the previous concentration and adding 10 cm³ of distilled water W.
Background Concept
A serial dilution is a stepwise dilution of a solution in which the concentration is reduced by a fixed factor at each step. Here the factor is 2, because each step halves the concentration. The principle is straightforward: mixing equal volumes of a solution and a diluent (distilled water) halves the concentration of the original solute. If 10 cm³ of a 2% glucose solution is mixed with 10 cm³ of distilled water, the total volume becomes 20 cm³ but the amount of glucose is unchanged, so the new concentration is 1%.
Understanding the Question
Fig. 1.1 already shows the first step of the serial dilution: 4% glucose solution → 2% glucose solution by mixing 10 cm³ of the 4% solution with 10 cm³ of distilled water. You are required to complete Fig. 1.1 to show how to make three further concentrations of glucose solution, following the same pattern. These will be 1%, 0.5% and 0.25%.
Approach
Repeat the pattern from the original figure for each new beaker: an arrow transfers 10 cm³ of the previous concentration into the next beaker, and a second arrow adds 10 cm³ of distilled water W. Label each new beaker with its resulting concentration.
Step-by-Step Reasoning
- First new beaker: 10 cm³ of 2% glucose solution + 10 cm³ of distilled water → total 20 cm³, glucose concentration halved to 1%.
- Second new beaker: 10 cm³ of 1% glucose solution + 10 cm³ of distilled water → total 20 cm³, glucose concentration halved to 0.5%.
- Third new beaker: 10 cm³ of 0.5% glucose solution + 10 cm³ of distilled water → total 20 cm³, glucose concentration halved to 0.25%.
- Each transfer and each water addition must be drawn as an arrow with the volume clearly labelled.
- The % symbol must appear at least once in the figure (in the concentration labels) and the cm³ unit must appear at least once (in the volume labels).
Key Takeaways
- Serial dilution by halving: each step halves the concentration when equal volumes are mixed.
- The pattern of transfer + water addition must be repeated consistently at every step.
- Concentration labels must appear in the correct order under the correct beakers.
Common Mistakes
- Forgetting to add the distilled water (only transferring the solution).
- Using different volumes at each step, which would not produce a clean halving.
- Labelling the beakers in the wrong order (e.g., 0.5% then 1%).
- Omitting the % or cm³ units.
Things to Be Careful About
- Every transfer must be exactly 10 cm³.
- Every water addition must be exactly 10 cm³.
- The labels 1%, 0.5% and 0.25% must appear in the correct sequence from left to right.
- The % and cm³ units must each appear at least once on the figure.
Complete Table 1.1 to show the volumes of solutions you intend to use in your investigation.
Table 1.1
| solution | volume / |
|---|---|
| Benedict’s | |
| each concentration of G | |
| S1 | |
| S2 |
Answer
| solution | volume / cm³ |
|---|---|
| Benedict's | 2 |
| each concentration of G | 2 |
| S1 | 2 |
| S2 | 2 |
Benedict's = 2 cm³; each concentration of G = 2 cm³; S1 = 2 cm³; S2 = 2 cm³
Background Concept
The Benedict's test detects reducing sugars. Benedict's solution (blue, containing copper(II) ions in alkaline conditions) is mixed with the test solution and heated. A colour change to green, yellow, orange or red-brown indicates the presence of a reducing sugar; the speed of the change depends on the concentration. To make a fair comparison between different glucose solutions, the volume of each test solution AND the volume of Benedict's reagent must be the same across every test tube.
Understanding the Question
Table 1.1 in the question paper is partly blank. You must enter, for each row, the volume (in cm³) of (a) Benedict's solution, (b) each concentration of G, (c) S1, and (d) S2 that you will use. The marking scheme requires: a whole number of cm³ (not drops); the same volume for G, S1 and S2; this volume between 2 and 15 cm³; Benedict's solution the same as, or more than, this volume; and the combined volume of test solution plus Benedict's less than 21 cm³ (i.e. the test tube must not overflow).
Approach
Pick a small, equal volume for all test solutions. Pick the same (or slightly larger) volume of Benedict's reagent. Confirm the combined volume is well within a test tube's capacity.
Step-by-Step Reasoning
- A standard test tube holds roughly 15–20 cm³, so a total of 4–6 cm³ of liquid is comfortable.
- 2 cm³ of each test solution (G, S1, S2) is a safe, workable volume.
- 2 cm³ of Benedict's solution equals this, so the same-volume condition is satisfied and the Benedict's is in excess relative to the small amount of glucose.
- Combined volume per tube = 2 + 2 = 4 cm³, well under the 21 cm³ ceiling.
- All values are whole numbers, and the unit is cm³ (not drops).
Key Takeaways
- In a Benedict's test, the volumes of test solution and Benedict's reagent must be consistent across all tubes for a fair comparison.
- Excess Benedict's is required to react with all the glucose present.
- The total volume must fit comfortably in the test tube (combined <21 cm³).
Common Mistakes
- Using different volumes for G, S1 and S2 (the comparison would then be unfair).
- Using drops rather than cm³.
- Using a volume that overflows the test tube (combined ≥21 cm³).
- Using values that are not whole numbers.
Things to Be Careful About
- All four rows must contain a value; the mark is withheld if any of G, S1 or S2 is left blank.
- The volume for G, S1 and S2 must be identical.
- The volume for Benedict's must be the same as, or greater than, the volume used for G, S1 and S2.
Proceed as follows:
- Prepare the dilutions of G as shown in Fig. 1.1 in the containers provided.
- Label test-tubes with the concentrations of G.
- Label test-tubes S1 and S2.
- Set up a water-bath and, testing each test-tube separately, test all the concentrations of G and the solutions S1 and S2 for the presence of glucose. Start timing when the test-tube is placed into the hot water-bath. If there is no colour change after 300 seconds, record ‘more than 300’ as your result (for step 5).
- Observe the test-tube very carefully for the first sign of a colour change. This is the end-point of the reaction. As soon as you see this colour change, record the time taken for the reaction to reach the end-point.
State one variable, other than the volume of each solution, which needs to be kept the same in this investigation. Describe how you will keep this variable the same.
Answer
Temperature — keep the water-bath at boiling (or 80–100 °C) by heating it and monitoring the temperature with a thermometer, adding hot or cold water as needed.
Temperature of the water-bath; maintain at 80–100 °C (boiling) by heating and checking with a thermometer.
Background Concept
In the Benedict's test, the rate of the reaction between glucose and the copper(II) ions in Benedict's solution depends strongly on temperature. Higher temperatures give faster reactions. To compare reaction times between different glucose solutions, the temperature must be identical for every test tube; this is a control variable. The reaction is conventionally carried out in a water-bath at 80–100 °C (close to boiling), so the Benedict's test mixture reaches a high temperature quickly and uniformly.
Understanding the Question
The question asks for one variable (other than the volume of each solution) that must be kept the same, and a description of how to keep it the same. The mark scheme explicitly requires both parts: the variable AND a method to standardise it. A bare mention of a thermostat or 'electronic control' does not earn the mark, because the candidate must describe an active, hands-on method.
Approach
Identify the temperature as the control variable, then describe how to maintain it in the water-bath. A heating source plus a thermometer (with adjustments by adding hot or cold water) is a complete, mark-scheme-compliant answer.
Step-by-Step Reasoning
- The relevant control variable is temperature.
- To keep it the same: heat the water-bath (e.g., with a Bunsen burner or electric heater) and boil it, OR hold the temperature at 80–100 °C.
- Monitor with a thermometer (or temperature probe) and add hot or cold water as needed to keep the temperature steady.
- The mark scheme rejects 'temperatures below 80 °C' because the reaction is too slow to be useful; it also rejects just 'thermostatically controlled' because the candidate is not describing their own action.
Key Takeaways
- The Benedict's test must be carried out at a consistent, high temperature for the comparison of reaction times to be valid.
- A control variable must come with an explicit method of standardisation.
Common Mistakes
- Stating 'temperature' without any method of keeping it the same.
- Relying on a 'thermostat' or 'electronic control' with no description of the candidate's own action.
- Suggesting a temperature below 80 °C.
- Just saying 'use a thermometer' without saying what to do with the reading.
Things to Be Careful About
- Both the variable AND the standardisation method are required for the mark.
- The method must be active (heating, monitoring, adjusting), not passive (relying on equipment).
- The temperature range should be 80–100 °C, ideally boiling.
Prepare the space below and record your results.
Working
Set up a water-bath at boiling (≈100 °C). For each test tube, add 2 cm³ of the glucose solution (or 2 cm³ of S1 or S2) and 2 cm³ of Benedict's solution, mix, place the tube in the water-bath, and start timing. Watch the tube carefully and record the time, in whole seconds, when the first sign of a colour change appears (blue → green/yellow/orange/red). If no change occurs within 300 s, record 'more than 300'. Repeat for the four remaining G concentrations and the two unknowns.
Construct a results table with all cells ruled, two columns (or rows) headed with the quantity and its unit:
- 'percentage concentration of glucose (%)'
- 'time for first colour change / s'
Record whole seconds (<301) for the five concentrations of G and for S1 and S2. The time should get longer as the glucose concentration falls.
Answer (representative example)
| percentage concentration of glucose (%) | time for first colour change / s |
|---|---|
| 4.0 | 28 |
| 2.0 | 45 |
| 1.0 | 72 |
| 0.5 | 115 |
| 0.25 | 190 |
| S1 | 72 |
| S2 | 45 |
See working — student-dependent. Table headings: 'percentage concentration of glucose (%)' and 'time for first colour change / s'. Whole seconds (<301) for all five G concentrations and S1, S2; times increase as concentration decreases.
Background Concept
The Benedict's test relies on glucose (a reducing sugar) reducing the deep-blue copper(II) ions in alkaline Benedict's solution to a brick-red precipitate of copper(I) oxide. The higher the glucose concentration, the faster the colour change appears. The end-point of the reaction is taken as the first visible colour change (blue → greenish, yellow, orange or red-brown). The time taken to reach this end-point is therefore inversely related to the glucose concentration.
Understanding the Question
This part asks the candidate to record their own observations in a properly constructed table. The mark scheme rewards four specific things:
- The table has all cells drawn (ruled), and a heading (top or left) that names the percentage concentration (with the % symbol).
- There is a heading (for any column/row, including the mean) that gives time in seconds (s or sec(onds)).
- Whole seconds (≤300) are recorded for any five concentrations of G AND for S1 AND for S2 — that is, seven values in total.
- The highest concentration (4%) gives a shorter time than the next concentration (2%) — the expected trend is that time increases as concentration decreases.
Approach
Run the Benedict's test on every tube, time the first sign of colour change, and enter the times into a results table with the correct conventions. Use whole seconds (no decimals, no minutes), and check the trend.
Step-by-Step Reasoning
- Table structure: rule all cells; a top row (or left column) carries the headings.
- Headings: 'percentage concentration of glucose (%)' for the concentration column, and 'time for first colour change / s' for the time column. Avoid putting units inside the cells of the time column ('28 s' in every cell would lose the mark).
- Recording: write whole seconds only (e.g., 28, 45, 72…). If a tube shows no change in 300 s, write 'more than 300' (this is treated as a valid value for that tube and is the only way to exceed 300).
- Trend: the most concentrated solution (4%) reacts fastest, so its time is the shortest. Time then lengthens progressively through 2%, 1%, 0.5%, 0.25%. S1 and S2 each match one of these standards; their times fall between the standard times.
- A representative result set (above) shows: 28 < 45 < 72 < 115 < 190 s, with S1 = 72 s and S2 = 45 s. These are illustrative — the candidate's actual times will differ but must follow the same trend.
Key Takeaways
- The end-point of the Benedict's test is the first visible colour change, not the final colour.
- Higher glucose concentration → faster reaction → shorter time.
- Tables must have ruled cells, a quantity-and-unit heading for each column, and consistent units within a column.
- 'Time' must be in seconds (not minutes, not 't' or 'T').
Common Mistakes
- Using minutes or 't' for time — the mark is lost.
- Putting the unit in every cell of the time column.
- Adding extra columns for method details (volumes, temperature).
- Recording values over 300 s (the 'more than 300' convention is the only exception).
- Recording a longer time for a higher concentration than for a lower one — the trend must go the right way.
- Missing one or more of the seven required values.
Things to Be Careful About
- The four marks are awarded independently: a candidate who records a perfect table but with the wrong trend loses only the trend mark.
- Whole seconds only; no decimals.
- A 'no change' tube is 'more than 300', not '300' or '301'.
Estimate the concentration of glucose in solutions S1 and in S2.
S1 = ______
S2 = ______
Working
Compare the time recorded for S1 with the times for the five known concentrations of G in the results table from b(ii). The standard whose time is closest to S1's time gives the estimated concentration of S1. Repeat for S2.
Answer (using the representative example above)
- S1 took 72 s, matching the 1% standard → S1 = 1%.
- S2 took 45 s, matching the 2% standard → S2 = 2%.
The estimate must be given with the % symbol and must be based on the candidate's own data; 'lower than', 'higher than' or 'between X and Y' are also acceptable.
S1 = 1%; S2 = 2% (estimates depend on the candidate's own results; the % symbol must be used).
Background Concept
A standard series (here, glucose solutions at 4%, 2%, 1%, 0.5% and 0.25%) is a set of samples of known concentration. By comparing an unknown sample to the standards under identical conditions, the unknown's concentration can be estimated. In a Benedict's test, the reaction time is the property being compared: the unknown with the same reaction time as a standard has the same glucose concentration.
Understanding the Question
You are given your own times for S1 and S2 from part b(ii). You must estimate the glucose concentration of each unknown. The mark scheme allows the estimate to be 'lower than', 'higher than', 'between X and Y', or equal to one of the standards. Interpolation between two standards (e.g., '1.5%') is rejected.
Approach
For each unknown, find the standard with the closest time. That standard's concentration is the estimate for the unknown.
Step-by-Step Reasoning
- Suppose S1 took 72 s. The 1% standard also took 72 s, so S1 ≈ 1%.
- Suppose S2 took 45 s. The 2% standard also took 45 s, so S2 ≈ 2%.
- If the unknown's time falls between two standards, say between the 1% (72 s) and 2% (45 s) times, the estimate is 'between 1% and 2%' — not a value in between.
- If the unknown's time is shorter than the fastest standard, the estimate is 'higher than 4%'.
- If longer than the slowest standard, 'lower than 0.25%'.
- The % symbol must appear at least once in the answer.
Key Takeaways
- A standard series is the basis for estimating unknowns by matching the measured property.
- The estimate must be one of the standard concentrations, a range, or a 'higher/lower than' statement; not an interpolated value.
- The estimate must use the candidate's own data from b(ii) (ecf applies if the data differ).
Common Mistakes
- Calculating a value between two standards (e.g., '1.5%') — the mark scheme rejects this.
- Using a textbook value of glucose in diabetic urine rather than the candidate's own results.
- Omitting the % symbol.
- Mixing up S1 and S2.
Things to Be Careful About
- The mark is awarded only if both S1 and S2 are estimated.
- The % symbol must appear at least once in the answer.
- The estimate must be consistent with the candidate's own table from b(ii).
State which solution, S1 or S2, is most likely to be from an untreated diabetic.
untreated diabetic = ______
Answer
The unknown with the higher estimated glucose concentration is the one most likely to come from an untreated diabetic. With the representative example above (S1 = 1%, S2 = 2%), the answer is S2.
The unknown with the higher estimated glucose concentration (e.g. S2).
Background Concept
Diabetes mellitus is a condition in which blood glucose cannot be regulated normally (typically because insulin-secreting cells of the pancreas are destroyed, or because tissues become resistant to insulin). When the blood glucose concentration rises above the renal threshold, the kidneys cannot reabsorb all the glucose filtered into the nephron, and glucose appears in the urine. A higher concentration of glucose in the urine therefore indicates a more severe or untreated diabetic state. This is the basis of the historical urine glucose test for diabetes.
Understanding the Question
Using the estimates you wrote in c(i), you must identify which of S1 or S2 is most likely to be from an untreated diabetic. The mark is awarded for naming the unknown with the higher estimated glucose concentration.
Approach
Compare the two estimates from c(i). The larger one is from the untreated diabetic.
Step-by-Step Reasoning
- c(i) gave S1 = 1% and S2 = 2%.
- 2% > 1%, so S2 has the higher glucose concentration.
- S2 is therefore the most likely to come from an untreated diabetic.
- If the two estimates are equal, the mark scheme accepts 'S1 and S2', 'S1 or S2', or 'both' (with ecf).
- The mark is withheld if c(i) does not contain an estimate for both S1 and S2.
Key Takeaways
- Untreated diabetes → blood glucose above the renal threshold → glucose appears in the urine.
- Higher urinary glucose suggests more severe or untreated diabetes.
- A conclusion is drawn directly from the data in c(i).
Common Mistakes
- Picking the unknown with the lower concentration.
- Naming the unknown without referring to the estimates in c(i).
- Failing to provide an estimate for one of the unknowns in c(i), which forfeits the mark here as well.
Things to Be Careful About
- This mark is conditional on having estimates for both S1 and S2 in c(i).
- The conclusion must be consistent with the candidate's own c(i) answer (ecf applies).
The rest of this paper
2 more questions- Q2Presentation of Data and Observations · Use of the Light Microscope · Analysis, Conclusions and Evaluation16M
- Q3Use of the Light Microscope · Presentation of Data and Observations12M