Biology 9700/31 — May/June 2011
Cambridge AS Level · Advanced Practical Skills · worked solutions for every part, with the mark scheme
Topics Manipulation, Measurement and Observation · Presentation of Data and Observations · Analysis, Conclusions and Evaluation · Use of the Light Microscope
Enzyme E catalyses the hydrolysis of starch to glucose.
The end-point of the reaction can be found by measuring the time taken for all the starch to be hydrolysed.
You are required to investigate the effect of the independent variable, copper sulfate concentration, on enzyme E.
You are provided with:
| labelled | contents | hazard | concentration / % | volume / |
|---|---|---|---|---|
| E | amylase solution | irritant | 1 | 10 |
| S | starch solution | none | 1 | 50 |
| C | copper sulfate solution | harmful irritant | 0.03 | 20 |
| W | distilled water | none | – | 100 |
| iodine | iodine in potassium iodide solution | irritant | – | 50 |
Copper sulfate can inhibit enzyme E.
The extent of inhibition depends on the concentration of the copper sulfate solution. A student investigated the inhibition of enzyme E at concentrations of copper sulfate solution greater than 0.03% and found that the enzyme was completely inhibited.
The student suggested the hypothesis:
concentrations of copper sulfate solution below 0.03% will continue to inhibit the enzyme.
You are required to investigate this hypothesis by carrying out a serial dilution of copper sulfate solution which reduces the concentration by ten-fold between each successive dilution.
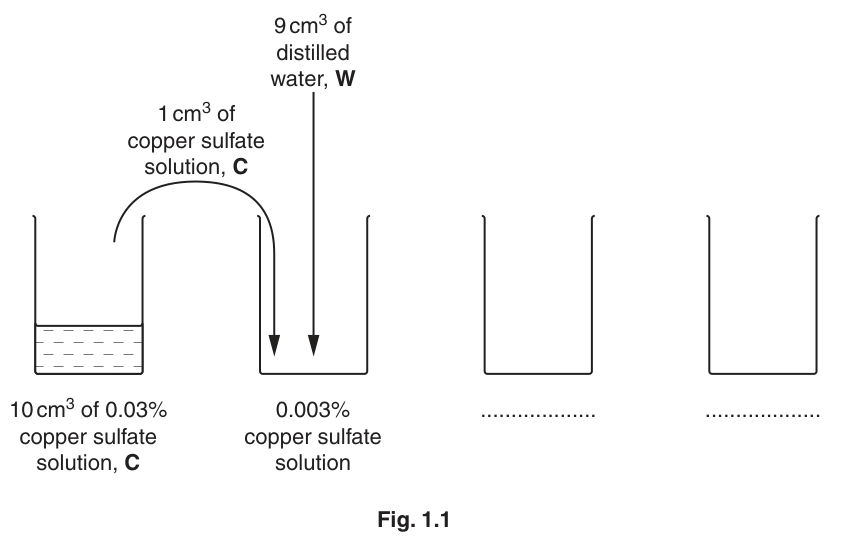
Fig. 1.1 shows how to make the first concentration of 0.003% copper sulfate solution.
Complete Fig. 1.1 to show how you will make two further concentrations of copper sulfate solution.
Proceed as follows:
- Prepare the concentrations of copper sulfate solution as shown in Fig. 1.1 in the containers provided. Use the syringe labelled ‘For copper sulfate’.
- Label test-tubes with the concentrations of copper sulfate solutions and label another test-tube W.
- Wipe the tile clean with a damp paper towel and then dry the tile. Label the tile, as shown in Fig. 1.2. The numbers indicate the sampling times in seconds.
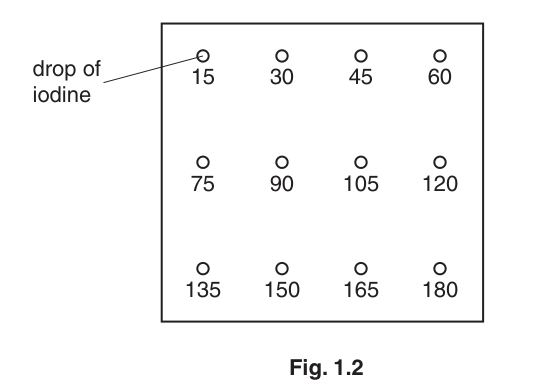
- Put one drop of iodine on the tile at each sampling time, as shown in Fig. 1.2.
- Put of W into the labelled test-tube.
- Put of S into the same test-tube. Mix well.
- Put of E into the same test-tube. Mix and start timing.
- Use a glass rod to stir the mixture.
- After 15 seconds use the glass rod to transfer a drop of the mixture to the iodine drop, labelled 15, on the tile.
- Immediately clean the glass rod with a paper towel.
- Repeat steps 8 to 10 at 15 second intervals until the iodine drop does not change colour. If the iodine drop changes colour at 180 seconds, record ‘more than 180’ as your result (for step 12).
- Record the time taken to reach the end-point.
- Repeat steps 3 to 12 replacing the of W with of the lowest concentration of copper sulfate solution.
- Repeat step 13 with the other concentrations of copper sulfate solution.
Prepare the space below and record your results.
The student’s hypothesis stated that “concentrations of copper sulfate solution below 0.03% will continue to inhibit the enzyme”.
Explain how your results provide evidence for the support or the rejection of this hypothesis.
Identify one significant source of error in your investigation.
A colorimeter could have been used to determine the end-point.
Describe three other modifications to this investigation which would improve the confidence in your results.
Table 1.1 shows the results of an investigation into the effect of the concentration of copper sulfate solution on a protein suspension. A protein suspension was mixed with different concentrations of copper sulfate solution.
After a set time, the percentage absorbance of light was measured using a colorimeter.
Table 1.1
| copper sulfate concentration / | absorbance of light by protein suspension / % | |||||
|---|---|---|---|---|---|---|
| trial 1 | trial 2 | trial 3 | trial 4 | trial 5 | mean | |
| 25.0 | 100 | 99 | 100 | 99 | 100 | 100 |
| 12.5 | 97 | 95 | 80 | 97 | 94 | 96 |
| 5.5 | 78 | 81 | 79 | 82 | 80 | 80 |
| 3.5 | 84 | 59 | 58 | 58 | 62 | |
| 1.5 | 9 | 11 | 10 | 9 | 8 | 9 |
Draw a circle around each of the anomalous results and complete the table.
Plot a graph of the data shown in Table 1.1.
Explain the effect of copper sulfate solution on the protein suspension.
The rest of this paper
1 more questions- Q2Use of the Light Microscope · Presentation of Data and Observations · Manipulation, Measurement and Observation18M