Biology 9700/36 — October/November 2010
Cambridge AS Level · Advanced Practical Skills · worked solutions for every part, with the mark scheme
Topics Manipulation, Measurement and Observation · Presentation of Data and Observations · Analysis, Conclusions and Evaluation · Use of the Light Microscope
Solution E contains an enzyme which coagulates (clots) milk.
You are required to investigate the independent variable, temperature, on the progress of this enzyme-catalysed coagulation.
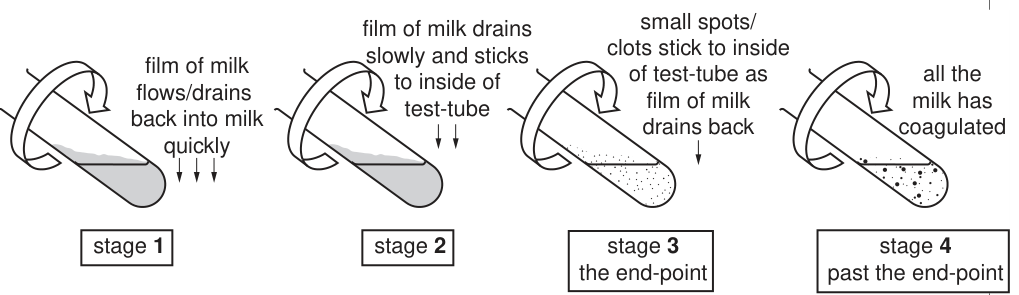
When a mixture of milk and enzyme is gently rotated the coagulation goes through the stages shown in Fig. 1.1. Stage 3 is the end-point of the enzyme-catalysed coagulation.
You are provided with
| labelled | contents | hazard | volume / |
|---|---|---|---|
| E | rennin solution | irritant | 20 |
| C | calcium chloride solution | irritant | 20 |
| M | milk | none | 100 |
Decide on the temperatures you plan to use in the range (between) to .
Record the temperatures you have chosen in the space below.
Proceed as follows:
- Label the test-tubes with the temperatures you have chosen.
- Put of M into each test-tube.
- Add of solution C to each test-tube.
- Gently shake the test-tube to mix M and solution C.
- Adjust the temperature of the water-bath you are provided with to your highest chosen temperature.
- Record the actual temperature of the water-bath.
- Put the test-tube, labelled with your highest temperature, into the water-bath and leave for three minutes.
- Remove the test-tube from the water-bath and add of solution E, so that it runs down the side of the test-tube to form a layer on the surface of the milk as shown in Fig. 1.2.
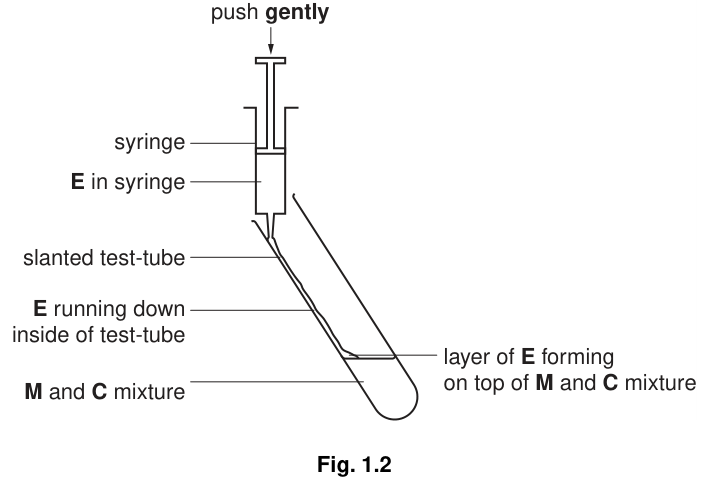
- Mix solution E with the milk by gently shaking the test-tube.
- Start timing and gently rotate the test-tube as shown in Fig. 1.1 to form a film of milk on the inside of the test-tube. Continue to rotate the test-tube and record the time to reach the end-point as shown in stage 3 in Fig. 1.1. Ignore any small bubbles on the inside of the test-tube.
- Adjust the water-bath to your next highest temperature.
- Repeat steps 4 to 11.
Prepare the space below and record your results.
From your results, state the temperature at which the activity of the enzyme was lowest.
Identify two significant sources of error in this investigation.
Describe a suitable control for this investigation.
Suggest how you could make this investigation as reliable as possible.
In a similar investigation a student studied the effect of the independent variable pH on the coagulation of milk.
The results are shown in Table 1.1.
Table 1.1
| pH of milk | activity of milk clotting enzyme / arbitrary units | |||||
|---|---|---|---|---|---|---|
| trial 1 | trial 2 | trial 3 | trial 4 | trial 5 | mean | |
| 6.02 | 8.8 | 8.7 | 8.9 | 8.2 | 8.7 | |
| 6.22 | 6.8 | 6.8 | 6.8 | 6.7 | 6.9 | 6.8 |
| 6.40 | 4.9 | 4.3 | 4.4 | 4.3 | 4.4 | 4.4 |
| 6.64 | 1.1 | 1.0 | 1.0 | 0.9 | 1.0 | 1.0 |
| 6.70 | 0.7 | 0.6 | 1.1 | 0.5 | 0.7 | 0.6 |
Three of the values in Table 1.1 are anomalous. Draw a circle around each of these values.
Complete Table 1.1 by calculating the missing value.
Plot a graph of the data shown in Table 1.1.

Explain the relationship between pH and the enzyme shown in the data.
The rest of this paper
1 more questions- Q2Use of the Light Microscope · Manipulation, Measurement and Observation · Analysis, Conclusions and Evaluation · Presentation of Data and Observations20M