Biology 9700/35 — October/November 2010
Cambridge AS Level · Advanced Practical Skills · worked solutions for every part, with the mark scheme
Topics Presentation of Data and Observations · Analysis, Conclusions and Evaluation · Manipulation, Measurement and Observation · Use of the Light Microscope
You are required to test known samples for the presence of ascorbic acid (vitamin C).
You are provided with
| labelled | contents | hazard | volume / |
|---|---|---|---|
| A | 0.1% ascorbic acid | irritant | 100 |
| W | distilled water | none | 100 |
| iodine | iodine in potassium iodide | irritant | 40 |
| S | starch | none | 20 |
| X | unknown sample | irritant | 20 |
| Y | unknown sample | irritant | 20 |
To find the concentration of ascorbic acid in A and W you are required to find the volume of iodine added to the test samples until the end-point is reached.
The drops of iodine will be added one at a time using a small syringe.
To practise releasing drops from a small syringe:
- Fill the syringe with distilled water.
- Hold the syringe over an empty test-tube as shown in Fig. 1.1 and push the plunger gently to release one drop.
- Repeat this until you can release one drop at a time.
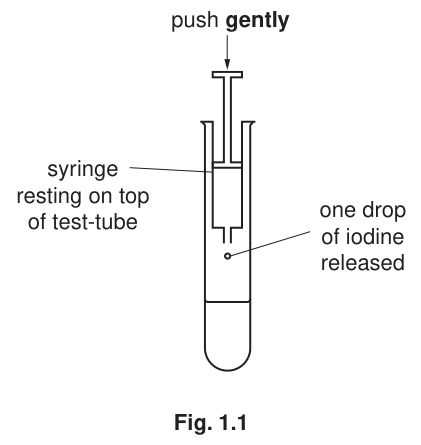
To find the concentration of ascorbic acid in A and W you will need to add drops of iodine until a blue colour appears which lasts for more than 10 seconds. This is the end-point.
You will be required to record the volume of iodine added.
Proceed as follows:
- Put of S into a test-tube.
- Add of the test sample (e.g. A) into the same test-tube.
- Shake the test-tube gently to mix the contents.
- Fill a small syringe with of iodine.
- Wipe off any iodine from the outside of the syringe with a paper towel.
- Add one drop of iodine to the mixture of S and A as shown in Fig. 1.1.
- Mix gently and if there is no colour change add another drop.
- When the blue colour first appears, wait 10 seconds to see if the end-point has been reached. If the blue colour disappears then add another drop.
- Repeat steps 9 to 11 until the mixture stays blue for at least 10 seconds.
- Record the volume of iodine added.
- Repeat steps 4 to 13 with sample W.
volume of iodine added for sample
A ..............
W .............
Proceed as follows to find the concentration of ascorbic acid in samples X and Y.
You will need to dilute the 0.10% ascorbic acid to provide a range of known concentrations.
You will need to make up of each concentration of ascorbic acid.
Table 1.1 shows how to make up two of the concentrations you should use.
Table 1.1
| volume of ascorbic acid / | volume of distilled water / | concentration of ascorbic acid / % |
|---|---|---|
| 20 | 0 | 0.10 |
| 16 | 4 | 0.08 |
Decide which other concentrations of ascorbic acid to make and complete Table 1.2, including the concentrations from Table 1.1.
Table 1.2
| tube number | volume of ascorbic acid / | volume of distilled water / | concentration of ascorbic acid / % |
|---|---|---|---|
Answer
| tube number | volume of ascorbic acid / cm³ | volume of distilled water / cm³ | concentration of ascorbic acid / % |
|---|---|---|---|
| 1 | 20 | 0 | 0.10 |
| 2 | 16 | 4 | 0.08 |
| 3 | 12 | 8 | 0.06 |
| 4 | 8 | 12 | 0.04 |
| 5 | 4 | 16 | 0.02 |
Table 1.2 completed with five concentrations (0.10, 0.08, 0.06, 0.04, 0.02 %) in descending order, each row totalling 20 cm³ with even 0.02 % intervals.
Background Concept
A serial dilution is a set of solutions prepared by repeatedly diluting a stock solution. The total volume of each dilution is kept constant while the volume of stock solution decreases by a fixed amount each step. The concentration follows directly from the dilution factor.
The mathematical relationship is:
where C₁ and V₁ are the concentration and volume of the stock solution used, and C₂ and V₂ are the concentration and total volume of the diluted solution.
Understanding the Question
Table 1.1 already gives two concentrations — 0.10 % (20 cm³ stock + 0 cm³ water) and 0.08 % (16 cm³ stock + 4 cm³ water). The candidate must add at least two more concentrations of ascorbic acid in Table 1.2, all in ascending or descending order, with volumes that total 20 cm³ in each tube, and at least three consecutive concentrations having two equal intervals between them.
Approach
Choose an even interval (e.g. 0.02 %) and fill in the concentrations from 0.10 % down to a low value (e.g. 0.02 %). For each concentration, calculate the volume of 0.10 % stock solution needed using V₁ = (C₂ × 20 cm³) / 0.10, then subtract from 20 cm³ to find the volume of distilled water needed.
Step-by-Step Reasoning
For 0.06 %: ; water = 8 cm³.
For 0.04 %: ; water = 12 cm³.
For 0.02 %: ; water = 16 cm³.
The five concentrations (0.10, 0.08, 0.06, 0.04, 0.02 %) are all in descending order, with intervals of 0.02 % (three consecutive — 0.08, 0.06, 0.04 — give two intervals of 0.02 % each).
Key Takeaways
- A serial dilution requires keeping the total volume constant while varying the stock and water volumes.
- Even intervals make subsequent graphical interpolation more reliable.
- The candidate needs at least five concentrations for a reasonable calibration graph.
Common Mistakes
- Using uneven intervals (e.g. 0.05 %, 0.07 %) which makes the graph harder to read accurately.
- Forgetting that the total must be 20 cm³ in each tube (e.g. writing 12 + 6 = 18 ✗).
- Reversing the formula: the volume of stock should be the target concentration divided by the stock concentration, multiplied by the total volume.
- Omitting the 0.10 % and 0.08 % rows already given in Table 1.1.
Things to Be Careful About
- Each row's two volumes must sum to exactly 20 cm³.
- At least three consecutive concentrations must have two equal intervals between them.
- The intervals chosen must suit the precision of the available equipment (here, 0.02 % intervals suit 1-cm³ graduations on a syringe).
Prepare the space below to show the concentration of ascorbic acid and record your results, including samples X and Y.
Answer
(Representative table — actual volumes depend on the candidate's own measurements.)
| concentration of ascorbic acid / % | volume of iodine / cm³ (1) | volume of iodine / cm³ (2) |
|---|---|---|
| 0.10 | 1.40 | 1.42 |
| 0.08 | 1.12 | 1.10 |
| 0.06 | 0.84 | 0.86 |
| 0.04 | 0.56 | 0.54 |
| 0.02 | 0.28 | 0.30 |
| X | 0.66 | 0.68 |
| Y | 0.04 | 0.04 |
Results table drawn with all cells, headings including quantity and unit, volumes to 2 decimal places, replicates for each concentration, decreasing volumes from highest to lowest concentration, and Y recording the lowest volume.
Background Concept
The iodine–ascorbic acid reaction is a 1:1 redox reaction: each molecule of iodine oxidises one molecule of ascorbic acid. Once all the ascorbic acid has been consumed, the next drop of iodine reacts with the starch indicator to form the characteristic blue-black starch–iodine complex. The volume of iodine required is therefore directly proportional to the ascorbic acid concentration.
A results table must follow established conventions to score the available marks: every cell must be drawn (no blank gaps), the column headings must state the quantity AND the unit, units must not appear in the body of the table, all readings must be quoted to the same number of decimal places, and replicates must be recorded explicitly.
Understanding the Question
The candidate has tested each of the prepared concentrations (0.10, 0.08, 0.06, 0.04, 0.02 %) plus the unknown samples X and Y using the drop-counting method described in the question. They must record all their results in a properly formatted table.
Approach
Draw a table with one row per sample (each standard concentration plus X and Y). Each row needs at least one volume entry to two decimal places; ideally two or more replicate columns. The volumes follow the expected pattern: as concentration decreases, the volume of iodine required also decreases. Y, behaving essentially as a water / 0 % ascorbic acid sample, should record the lowest volume — the dead-volume of iodine that reacts with starch even when no ascorbic acid is present.
Step-by-Step Reasoning
- Draw all cells of the table — no blank gaps.
- Headings: 'concentration of ascorbic acid / %' and 'volume of iodine / cm³' (or with replicate columns named volume (1), volume (2), etc.).
- Record each volume to 2 decimal places (e.g. 1.40, not 1.4).
- The values decrease in line with decreasing ascorbic acid concentration.
- Include the results for X and Y in the same table.
- Y records the lowest volume (it behaves like the water / 0 % control).
- Replicates (two or more per concentration) are recorded to demonstrate repeatability.
Key Takeaways
- A results table must conform to lab conventions: ruled cells, units in headings, consistent decimal places, replicate recordings.
- The titration data is linear (1:1 stoichiometry), so the highest concentration needs the most iodine.
- Replicates allow assessment of measurement precision; their spread indicates how reliable each reading is.
- Y behaves like a water control and gives the lowest (essentially zero-substance) volume.
Common Mistakes
- Repeating the unit inside the body of the table (e.g. '1.40 cm³'). Units belong only in the heading.
- Inconsistent decimal places (e.g. 1.40 in one row, 1.4 in the next).
- Recording only one reading per concentration without replicates.
- Volumes increasing rather than decreasing as concentration falls.
- Failing to draw all cells (using blank gaps).
- Recording fewer than 3 concentrations — this loses the mark for the trend.
Things to Be Careful About
- Heading format must be 'quantity / unit', e.g. 'concentration of ascorbic acid / %', not just 'concentration (%)'.
- The % symbol should not appear in the body of the table.
- Y's volume should be the lowest of all readings; if not, the test has been done incorrectly.
- The mark scheme REJECTS additional method columns such as 'volume of ascorbic acid' — only the concentration, the volume of iodine at the end-point, and the replicate column(s) belong in this table.
Plot a graph of the results.

Answer
Plot the results on the printed grid following the CIE O-S-P-L conventions:
- Orientation: x-axis = concentration of ascorbic acid / %; y-axis = volume of iodine / cm³. Both axes must be labelled with quantity AND unit (the unit cm³ must be included; the abbreviation 'v' for volume is rejected).
- Scale: x-axis — 0.02 % per 2 cm; y-axis — 0.2 cm³ per 2 cm. Both scales must use more than half of the grid in each direction. Awkward scales (e.g. 3 per 2 cm or non-round intervals) are rejected.
- Plotting: each standard concentration plotted as a clear cross (×) or dot-in-circle (⊙), with the intersection marking the data point precisely. Blobs, filled dots or dots without crosses are rejected.
- Line of best fit: a single straight ruled line drawn through the standard-concentration points (X must NOT be included in this line). The line must terminate exactly at the vertical line of the highest-concentration point and exactly at the vertical line of the lowest-concentration point — no extrapolation beyond the data.
Graph plotted on the printed grid with correctly labelled axes, scales using >50 % of the grid, each standard concentration as a cross/dot-in-circle, and a single straight line of best fit terminating at the highest and lowest plotted points.
Background Concept
A calibration graph is plotted from the standard concentrations to show the relationship between ascorbic acid concentration (independent variable, x-axis) and the volume of iodine needed to reach the end-point (dependent variable, y-axis). Because the iodine–ascorbic acid reaction is 1:1 in stoichiometry, the graph is linear and passes close to the origin (a small positive intercept is expected because of the dead-volume of iodine that reacts directly with starch).
The graph is later used to interpolate the concentrations of unknowns (sample X) by reading horizontally from their measured volume to the line of best fit, then dropping vertically to the x-axis.
CIE graph conventions award marks under four headings: Orientation (O), Scale (S), Plotting (P) and Line of best fit (L). Each is marked separately and commonly lost for the same kinds of mistakes.
Understanding the Question
The candidate has a table of volumes recorded for the standard concentrations (from part ii) and is asked to plot them on the printed 20 × 20 grid. The marks are for graph conventions, not for any particular line shape.
Approach
Apply O first — decide which variable goes on which axis. Then apply S — sensible scales using more than half the grid. Then apply P — plot the standard points with clear crosses (or dots in circles). Finally apply L — draw a single straight line of best fit through the standard points, ending at the vertical lines of the extreme data points.
Step-by-Step Reasoning
- Label the x-axis 'concentration of ascorbic acid / %' (must include the % symbol). Label the y-axis 'volume of iodine / cm³' (must NOT be abbreviated to 'v' — that loses the mark).
- Choose scales that use more than half of the grid in each direction: with a 20 × 20 grid, a sensible pair is 0.02 % per 2 cm on x (so 0 to 0.10 % uses 10 cm) and 0.2 cm³ per 2 cm on y (so 0 to 2.0 cm³ uses 20 cm). Awkward scales such as 3 cm³ per 2 cm or non-round intervals are rejected.
- Plot each standard concentration as a small cross (×) or a dot inside a circle (⊙), with the intersection marking the data point. Do NOT plot blobs or filled circles — these are rejected.
- Do NOT plot X on the line of best fit (X is the unknown to be read FROM the line in part iv, not a point that informs the line).
- Draw a single ruled straight line through the plotted points. The line of best fit should ideally have roughly equal numbers of points either side; if there is an even distribution it should pass through or near the middle of the cluster.
- The line must terminate exactly at the vertical lines above the highest and lowest data points — no extrapolation beyond.
Key Takeaways
- O-S-P-L is the standard mnemonic for CIE graph marks.
- The independent variable goes on the x-axis, the dependent on the y-axis.
- A scale that uses less than half the grid loses the S mark.
- 'Awkward' scales (e.g. 3 per 2 cm, non-round intervals) are rejected.
- A straight line is appropriate for a 1:1 stoichiometric titration; a curve is rejected here.
- X must NOT be plotted on the graph for the line of best fit to be drawn; it is read from the line in the next part.
Common Mistakes
- Using 'v' instead of 'volume' for the y-axis label.
- Omitting units on the axis labels.
- Awkward scales (e.g. 3 cm³ per 2 cm; non-round numbers per cm).
- Plotting as blobs, filled dots or just dots without crosses.
- Extrapolating the line of best fit beyond the data.
- Drawing a curve rather than a straight line.
- Including X as a point in the line of best fit — X is to be estimated FROM the line, not used to draw it.
Things to Be Careful About
- The line must be a single straight line, ruled, no thicker than the printed grid lines, and not feathery.
- Do not plot X as a regular point on the graph.
- The line of best fit must end at the vertical lines for the highest and lowest concentration points; any extrapolation beyond the data is rejected.
Use your graph to estimate the ascorbic acid concentration of sample X.
Show clearly on your graph how you obtained the ascorbic acid concentration.
concentration of ascorbic acid in sample X = ______
Answer
Using the graph:
- Locate the volume recorded for sample X on the y-axis (representative mean ≈ 0.66 cm³).
- Draw a horizontal line from this volume across the graph until it meets the line of best fit.
- From the intersection point, drop a vertical line down to the x-axis.
- Read the concentration of ascorbic acid at the point where the vertical line meets the x-axis.
Show these construction lines clearly on the graph.
concentration of ascorbic acid in sample X = _____ % (representative value ≈ 0.05 %)
concentration of ascorbic acid in sample X ≈ 0.05 % (representative; actual value depends on the student's own graph — must be quoted with the % unit and to no more than 4 decimal places or 3 significant figures).
Background Concept
Once a calibration graph is drawn from standard concentrations of known strength, the concentration of any unknown can be estimated by interpolation. Interpolation means reading off the graph within the range of the standards; extrapolation (reading beyond the data) is unreliable and is rejected by the mark scheme.
The procedure uses the line of best fit as a reference: a horizontal construction line at the unknown's measured volume is drawn from the y-axis to the line of best fit, then a vertical construction line is dropped to the x-axis to read off the corresponding concentration.
Understanding the Question
The candidate has a plotted graph of iodine volume against ascorbic acid concentration, and a measured volume for sample X. They must use the graph to estimate the concentration of X and show clearly how they did it.
Approach
Draw construction lines on the graph: a horizontal line from the volume for X on the y-axis to the line of best fit, then a vertical line down to the x-axis. Read the concentration where the vertical line meets the x-axis. The construction lines must be visible on the graph and the answer must be quoted with the % unit and to an appropriate precision.
Step-by-Step Reasoning
(Using my representative data where the line of best fit passes through (0, 0.04) and (0.10, 1.40), so slope m = (1.40 − 0.04) / 0.10 = 13.6 cm³ per %.)
For sample X with volume 0.66 cm³:
Quoted to three significant figures: ≈ 0.046 % (or 0.05 % to two sig figs).
The construction lines must be visible on the graph, the reading taken to an appropriate precision, and the unit % stated.
Key Takeaways
- A calibration graph lets you estimate unknown concentrations by interpolation.
- Show your working on the graph using construction lines.
- Quote the answer with appropriate precision (no more than 4 decimal places or 3 significant figures) and with the % unit.
Common Mistakes
- Drawing the construction lines in the wrong direction (e.g. drawing a vertical line first, then horizontal).
- Not showing the construction lines at all on the graph.
- Quoting the answer without the % unit.
- Quoting too many significant figures (e.g. 0.04569 % when only 2 or 3 are justified).
- Reading from a plotted point of X rather than from the line of best fit.
- Extrapolating beyond the data range — extrapolation is rejected.
Things to Be Careful About
- The construction lines must be visible on the graph paper — pencil lines are fine but must be clear.
- The value must be quoted to no more than 4 decimal places or 3 significant figures; if 4 decimal places are given the last figure must be 5 or 0.
- The unit % must be included with the answer.
Identify two significant sources of error when finding the concentration of ascorbic acid in sample X.
Answer
Two significant sources of error:
-
Drops stick to the inside wall of the test-tube — drops that run down the side of the tube do not mix with the bulk of the sample and so are not effectively 'counted'. This leads to an inaccurate (typically too high) reading of the volume of iodine needed, and the end-point may be missed because the iodine in the film down the side is not reacting.
-
The end-point is judged subjectively — deciding when the blue colour first persists for more than 10 seconds is difficult; different observers (or the same observer on different occasions) will judge the end-point at slightly different volumes, so the recorded volume is not reproducible.
(Alternative procedure-specific sources of error accepted: variation in drop size between successive drops of the syringe; incomplete mixing of the iodine with the sample; iodine evaporating or ascorbic acid oxidising in air, changing the concentrations; syringe sticking or different pressure applied by the candidate.)
Two procedure-specific sources of error — drops stick to tube walls (volume not counted / end-point missed) and subjective end-point judgement (colour change hard to determine).
Background Concept
A 'source of error' is something in the procedure that could materially affect the result. The mark scheme distinguishes between significant errors (those that would noticeably change the measured volume) and trivial or vague errors ('human error', 'apparatus error') that are rejected.
Errors may be random (affect precision; e.g. variation between repeated readings) or systematic (affect accuracy; e.g. drops not being counted, so every reading is biased in the same direction).
Understanding the Question
The candidate is asked to identify TWO significant sources of error when finding the concentration of ascorbic acid in sample X — specifically the procedure described in the question, not generic lab errors.
Approach
Walk through the procedure step by step and identify where things could go wrong:
- Adding iodine one drop at a time: drops can stick to the tube walls, drop size can vary, the plunger can stick.
- Judging the blue colour: subjective; depends on lighting and observer.
- Mixing: must be thorough or unreacted ascorbic acid remains.
- Time-related: iodine can evaporate, ascorbic acid can oxidise in air.
Step-by-Step Reasoning
-
Drops stick to the inside wall of the test-tube: when the syringe delivers a drop, gravity may pull it down the inside of the tube rather than into the bulk of the liquid. This drop is essentially 'lost' from the reaction but is still in the count. The end-point may be missed because the iodine in the film down the side is not reacting, and the volume recorded is therefore too high.
-
The end-point is judged subjectively: deciding when the blue colour has persisted for 10 s depends on the observer. Small differences in observation lead to small differences in the recorded volume. If two observers read the same tube they may differ by a drop.
Both errors are significant because they directly affect the volume recorded at the end-point.
Key Takeaways
- Errors must be SPECIFIC to the procedure (drops, end-point, mixing, evaporation).
- Each error must be SIGNIFICANT (materially affects the result).
- Avoid vague answers like 'human error' or 'apparatus error' — these score zero.
Common Mistakes
- 'Human error' — too vague, rejected.
- 'Apparatus error' — too vague, rejected.
- Errors unrelated to this specific procedure (e.g. light affecting the colour — possible but less direct).
- Errors that don't explain how they affect the result.
- Stating the error without saying why it matters for this experiment.
Things to Be Careful About
- Pair each error with a statement of how it affects the measurement (e.g. drops not counted → volume too high; end-point missed → volume recorded too high).
- Stick to errors that arise from the specific procedure described.
Suggest how you would make three improvements to this investigation.
Answer
Three specific improvements:
-
Use a wider range of (or smaller interval between) ascorbic acid concentrations, measured with a graduated pipette or a calibrated syringe/burette — this gives more points on the calibration graph and more reliable interpolation for X.
-
Use a burette (or other accurate drop-dispensing device) instead of a small syringe — a burette delivers smaller, more uniform drops and reads volume directly to 0.05 cm³, so the volume added is more accurately known and the count of drops is more reliable.
-
Use a colorimeter (or a known colour standard / white tile) to detect the end-point — this removes the subjective judgement of when the blue colour persists for 10 s and makes the end-point consistent between observers.
(Additional improvements accepted: replicate each concentration and average the volumes; add the drops closer to the surface of the mixture or use a smaller / wider test-tube so the colour change is easier to see.)
Three specific improvements addressing identified errors — better concentration range / measurement device (graduated pipette or burette), more accurate dispensing (burette), and objective end-point detection (colorimeter or colour standard).
Background Concept
Improvements should reduce either random error (improve precision) or systematic error (improve accuracy). Each improvement should be specific and paired with the source of error it addresses.
In a titration like this:
- Random error comes from variation in drop size and judgement of the end-point.
- Systematic error comes from drops not being counted (e.g. on the tube wall) and from any drift in the reagents (iodine evaporating, ascorbic acid oxidising).
Understanding the Question
The candidate must suggest THREE specific improvements to the investigation. Improvements must be concrete, not vague ('be more careful', 'repeat the experiment' alone), and should logically address a source of error.
Approach
For each significant source of error identified, suggest a specific counter-measure:
- Drops stick / drop size varies → use a burette (smaller, more uniform drops) or wash down the tube wall.
- End-point judgement subjective → use a colorimeter or a colour standard.
- Single readings → take replicates and average.
Step-by-Step Reasoning
-
Wider / finer range of concentrations OR more accurate volume measurement: the candidate tested only 5 standards, which limits the precision of interpolation. More standards (or smaller intervals between standards) would help. A graduated pipette or a calibrated syringe/burette is more accurate than the small syringe for measuring volumes.
-
Use a burette to deliver the iodine: a burette gives smaller, more uniform drops and reads the volume directly to 0.05 cm³, eliminating the need to count drops.
-
Use a colorimeter (or known colour standard / white tile) to detect the end-point: this removes the subjective judgement of the colour change, making the end-point consistent between observers.
Other accepted improvements: replicate each concentration (replicate / repeat / take more readings); use a smaller or wider test-tube so the colour change is easier to see; add the drops nearer to the surface of the mixture.
Key Takeaways
- Each improvement should be SPECIFIC (state what to use and why).
- Each improvement should ADDRESS an identified error.
- 'Be more careful' and 'repeat the experiment' alone are too vague.
Common Mistakes
- 'Repeat the experiment' without specifying what changes.
- 'Be more careful' — too vague.
- Improvements unrelated to the procedure (e.g. 'use a better microscope' — irrelevant to a chemical titration).
- Vague improvements that don't specify what equipment to use.
Things to Be Careful About
- State WHAT to use AND WHY it improves the result.
- Three distinct improvements, not three variations of the same idea.
- Improvements should be realistic in a school lab (e.g. a colorimeter may be available, but a spectrometer may not be).
The rest of this paper
1 more questions- Q2Use of the Light Microscope · Presentation of Data and Observations · Analysis, Conclusions and Evaluation19M