Biology 9700/34 — October/November 2010
Cambridge AS Level · Advanced Practical Skills · worked solutions for every part, with the mark scheme
Topics Presentation of Data and Observations · Analysis, Conclusions and Evaluation · Manipulation, Measurement and Observation · Use of the Light Microscope
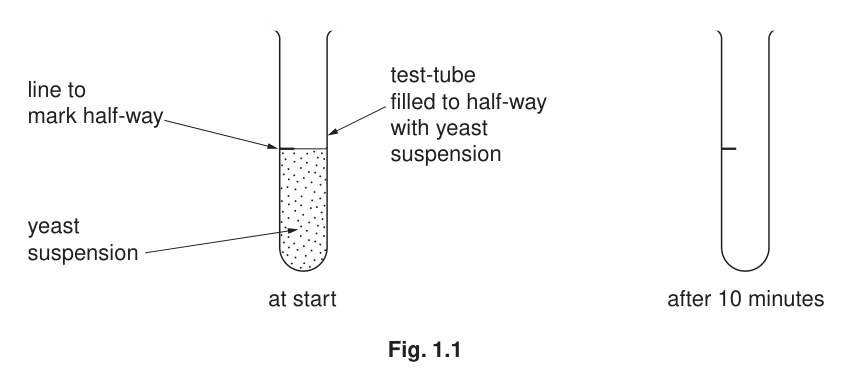
There are molecules on the surface of yeast cells which cause the cells to stick together. When a yeast suspension is placed in a test-tube some of the cells sink slowly to the bottom.
Show clearly on Fig. 1.1 what you would expect the contents of the test-tube to look like after 10 minutes. You will gain marks for clear labels.
You are required to investigate the effect of the independent variable, pH, on the sedimentation of a yeast cell suspension over a period of 10 minutes.
State the time intervals you will use and what you will use the graph paper scale to measure.
You are provided with
| labelled | contents | hazard | volume / |
|---|---|---|---|
| pH 3 | buffer solution | irritant | 30 |
| pH 4 | buffer solution | irritant | 30 |
| pH 5 | buffer solution | irritant | 30 |
| pH 6 | buffer solution | irritant | 30 |
| Y | yeast suspension | none | 60 |
| C | calcium chloride solution | irritant | 15 |
Proceed as follows:
- Label one test-tube for each pH.
- Use the marker provided to mark a line half-way along the length of each test-tube as shown in Fig. 1.1.
You will need to put of C in each test-tube and then an equal volume of Y and each buffer solution so that the mixture will fill the test-tube to the half-way mark as shown in Fig. 1.2.
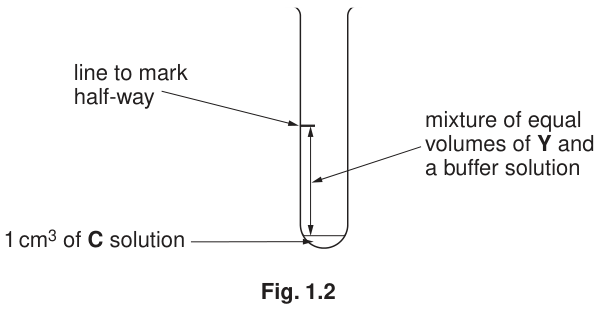
Use the test-tube labelled T and the other apparatus provided and decide on the volume of Y and the volume of each buffer solution to use.
Describe all the steps you used to work out the volumes.
State the volume of Y and the volume of each buffer solution to use.
volume of Y = ______
volume of each buffer solution = ______
- Put the volume of buffer solution labelled pH 3, stated in (iii), into the test-tube labelled pH 3.
- Put of C to the same test-tube.
- Repeat steps 3 and 4 with each of the other buffer solutions pH 4, pH 5 and pH 6.
- Stir the yeast suspension Y with a glass rod.
- Put the volume of Y, stated in (iii), into each test-tube to make the total volume up to the half-way mark.
- Put a bung or cork into the test-tube and invert the test-tube twice to mix well. Repeat with each test-tube.
- Immediately start timing. At your selected times, record your observations. You may need to lift each test-tube to eye level to take each reading. Take care not to disturb the contents of the test-tube.
Prepare the space below and record your observations.
Use your results to state the effect of pH on the yeast suspension.
Identify one significant source of error in this experiment.
State the degree of uncertainty of using the graph paper scale as a measure.
Suggest how you could make this investigation
as accurate as possible,
as reliable as possible.
A yeast cell suspension can be used to produce ethanol for use as a fuel. The yeast cells are allowed to sediment out at the end of the process so that they can be reused. It has been found that calcium chloride affects the rate of sedimentation.
Table 1.1 shows the effect of adding calcium chloride to a yeast suspension.
| calcium chloride concentration / | sedimentation time / |
|---|---|
| 0.00 | 85 |
| 0.25 | 140 |
| 0.40 | 69 |
| 0.50 | 50 |
| 0.75 | 12 |
| 1.00 | 12 |
Table 1.1
Plot a graph of the data shown in Table 1.1.

State the concentration of calcium chloride required for the yeast to sediment out at 40 minutes.
You may lose marks if you do not show your working or if you do not use appropriate units.
concentration of calcium chloride required = ______
The rest of this paper
1 more questions- Q2Use of the Light Microscope · Presentation of Data and Observations · Analysis, Conclusions and Evaluation18M