Biology 9700/31 — October/November 2010
Cambridge AS Level · Advanced Practical Skills · worked solutions for every part, with the mark scheme
Topics Presentation of Data and Observations · Analysis, Conclusions and Evaluation · Use of the Light Microscope · Manipulation, Measurement and Observation
Plant cells contain an enzyme, catalase, which catalyses the breakdown of hydrogen peroxide into oxygen and water.
When a piece of potato is dropped into hydrogen peroxide it will sink and then the production of oxygen causes the potato to rise. The more oxygen produced the less time it takes for the potato to rise.
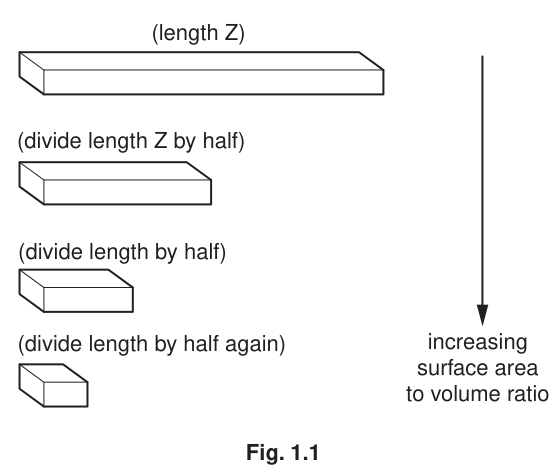
You are required to investigate the independent variable, the surface area to volume ratio of pieces of potato, on the breakdown of hydrogen peroxide. The relationship of pieces of potato of different sizes to their surface area to volume ratio is shown in Fig. 1.1.
You are provided with
| labelled | contents | hazard | volume / |
|---|---|---|---|
| H | hydrogen peroxide | irritant oxidising substance |
| labelled | contents | details | quantity |
|---|---|---|---|
| P | potato pieces | same cross-sectional area | 4 |
Proceed as follows:
- Prepare the pieces of potato as shown in Fig. 1.2.
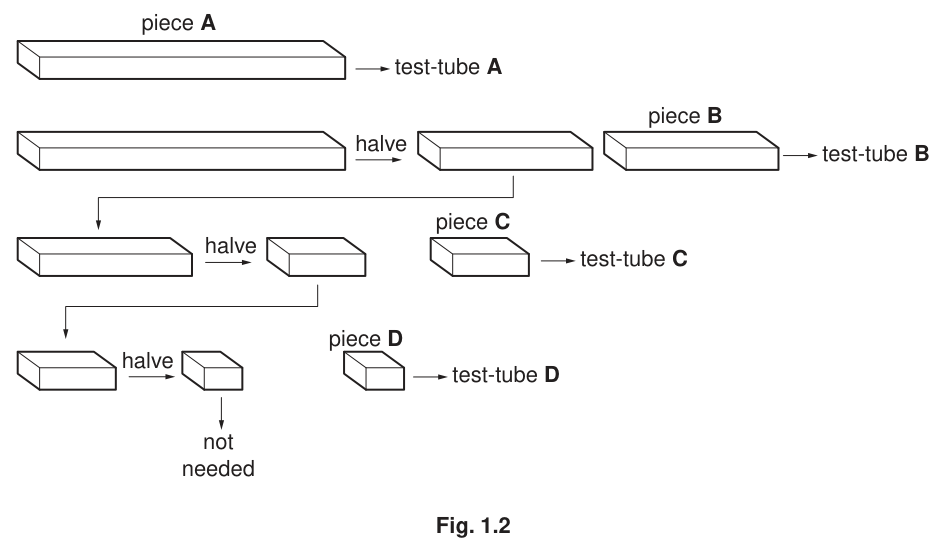
- Label four test-tubes A, B, C and D.
- Put of H into test-tube A.
- Put piece A onto a paper towel and gently remove any excess water.
- Put piece A into test-tube A. Immediately start timing.
- Record the time taken for piece A to rise to the surface.
Do not touch the test-tube after you have started timing.
If the piece of potato does not rise after 2 minutes stop timing and record ‘more than 2 minutes’. Proceed to the next test.
- Repeat steps 3 to 6 for one piece of B, one piece of C and one piece of D.
Prepare the space below and record your results.
Identify two significant sources of error in your investigation.
Suggest how you would make three improvements to this investigation.
A student investigated the effect of pH on the enzyme in potato tissue. The breakdown of hydrogen peroxide was measured by the release of oxygen. Fig. 1.3 shows the apparatus used. The student recorded the time for the oxygen released to displace of water at five different pH values.
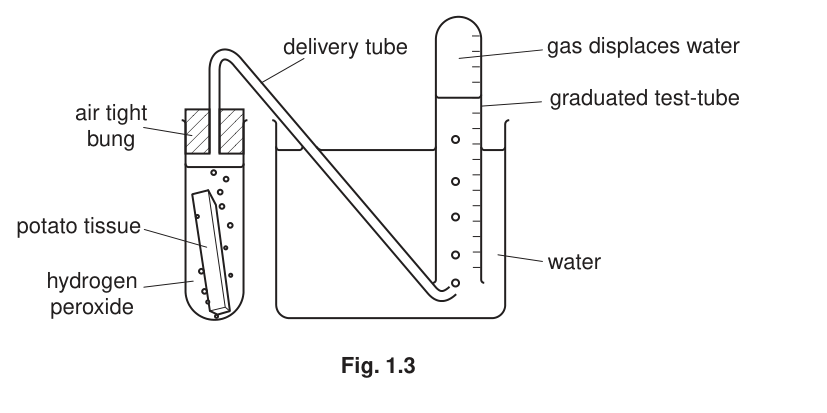
The student’s results are shown in Table 1.1.
Table 1.1
| pH | time to displace of water / s | |||||
|---|---|---|---|---|---|---|
| trial 1 | trial 2 | trial 3 | trial 4 | trial 5 | mean | |
| 5 | 17 | 14 | 16 | 14 | 15 | 15 |
| 6 | 8 | 5 | 15 | 6 | 5 | 6 |
| 7 | 2 | 10 | 3 | 3 | 4 | 3 |
| 8 | 8 | 6 | 6 | 17 | 7 | |
| 9 | 20 | 16 | 17 | 16 | 16 | 17 |
Three of the values in Table 1.1 are anomalous. Draw a circle around each of these values.
Complete Table 1.1 by calculating the missing value.
Plot a graph of the data shown in Table 1.1.

Explain the relationship between pH and the enzyme catalase shown in the data.
The rest of this paper
1 more questions- Q2Use of the Light Microscope · Manipulation, Measurement and Observation · Presentation of Data and Observations · Analysis, Conclusions and Evaluation20M