Biology 9700/35 — May/June 2010
Cambridge AS Level · Advanced Practical Skills · worked solutions for every part, with the mark scheme
Topics Manipulation, Measurement and Observation · Presentation of Data and Observations · Analysis, Conclusions and Evaluation · Use of the Light Microscope
You are required to find the water potential of two solutions, A and B.
The water potential of a plant tissue can be found by immersing the plant tissue in sucrose solutions of different water potential.
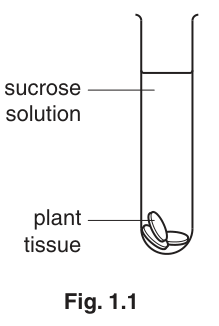
Sucrose solutions A and B are the solutions in which tissues from two different species of plant did not change in mass after immersion for 30 minutes as shown in Fig. 1.1.
Use two of the following words to complete the sentences below.
gains less loses more
If the plant tissue ........................ water then the sucrose solution will become more dilute.
This will change the solution so that it becomes ........................ dense.
Answer
If the plant tissue loses water then the sucrose solution will become more dilute.
This will change the solution so that it becomes less dense.
loses ; less
Background Concept
Osmosis is the net movement of water molecules across a partially permeable membrane from a region of higher water potential to a region of lower water potential. When plant tissue is placed in a sucrose solution, water moves out of (or into) the cells depending on the relative water potentials of the cells and the solution. Solutions of equal water potential cause no net movement and therefore no change in mass.
Density is mass per unit volume. A sucrose solution that gains water (becomes more dilute) has a lower mass of sucrose per unit volume, so it becomes less dense. The change in the tissue is the converse of the change in the surrounding solution.
Understanding the Question
The question tells you that plant tissues placed in solutions A and B did not change mass (so their water potentials matched). It then asks you to complete two gaps in sentences that describe what would happen if the tissue did lose water to the solution. The first blank is the verb (gains/loses), the second is the adjective (less/more).
Approach
Use the principle of osmosis to decide which way the water moves, then think about the consequence for the solution.
Step-by-Step Reasoning
- First gap: water moves OUT of the tissue and INTO the solution, so the tissue loses water.
- Second gap: the solution gains water, becoming more dilute; more dilute means less sucrose per unit volume, so the solution becomes less dense.
Key Takeaways
- Osmosis describes NET movement of water down a water-potential gradient.
- Adding water to a solution dilutes it and lowers its density.
- These simple principles underpin the whole of this practical investigation.
Common Mistakes
- Choosing "gains" (the opposite direction of water movement).
- Choosing "more dense" (the opposite change in density — adding water makes the solution less dense, not more).
- Confusing which side is losing and which is gaining water.
Things to Be Careful About
- The two missing words are different parts of speech: one is a verb, one an adjective.
- Read the sentence context before choosing — each gap has its own biological meaning.
A blue dye is added to the two solutions, A and B, so that they can be seen.
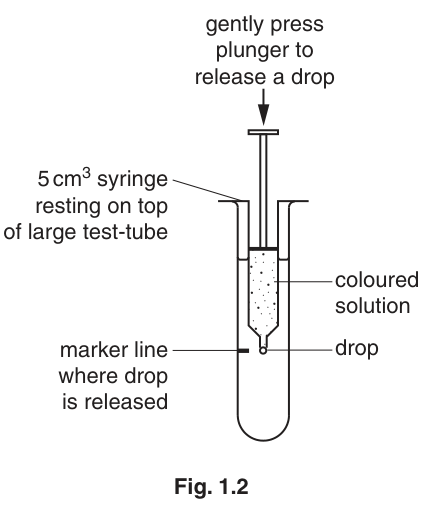
A drop of the coloured solution is placed into a known concentration of sucrose solution.
Fig. 1.2 shows how the drop is released.
Immediately the drop is released the syringe is removed.
The drop may move up, move down or remain at the same level.
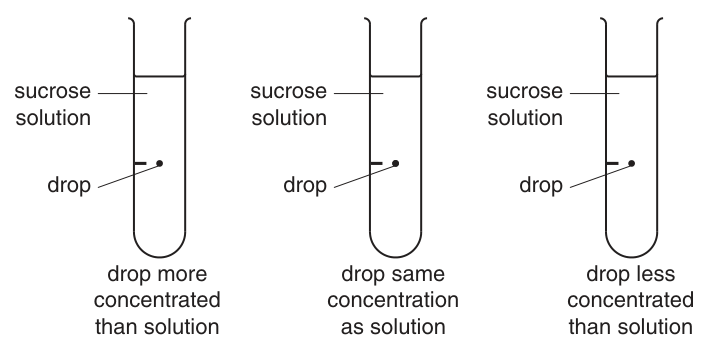
Show clearly on the diagrams below how you would expect to see the drop move.
Answer
Left tube (drop more concentrated than solution): redraw the drop below the marker line with a downward arrow ↓ (sinks / falls).
Middle tube (drop same concentration as solution): leave the drop on the marker line — no movement.
Right tube (drop less concentrated than solution): redraw the drop above the marker line with an upward arrow ↑ (rises).
middle tube: drop stays; left tube: drop sinks (↓); right tube: drop rises (↑)
Background Concept
The drop method compares the densities of two solutions. A sucrose solution of higher concentration has higher density than one of lower concentration. A small coloured drop injected into a second solution moves according to its density relative to that second solution: a denser drop sinks, a less dense drop rises, and a drop of equal density remains stationary.
Understanding the Question
Fig. 1.3 provides three printed test-tube diagrams, each showing a coloured drop at a marker line inside a sucrose solution. The three tubes are pre-labelled with the relative concentration of the drop and the surrounding solution. You must annotate each diagram to show which way the drop moves (or that it stays still).
Approach
For each tube, decide whether the drop is denser or less dense than the surrounding solution, then indicate the direction of movement with an arrow (or with no arrow if there is no movement).
Step-by-Step Reasoning
- Left tube — "drop more concentrated than solution": The drop is denser, so it sinks. Reposition the drop below the marker line with a downward arrow.
- Middle tube — "drop same concentration as solution": The drop has the same density, so it experiences no net force and stays at the marker line. Do not move it.
- Right tube — "drop less concentrated than solution": The drop is less dense, so it rises. Reposition the drop above the marker line with an upward arrow.
Key Takeaways
- Density increases with sucrose concentration.
- A denser drop sinks; a less dense drop rises; equal density drops remain stationary.
- This principle is the basis for the calibration series you will build in the next part of the question.
Common Mistakes
- Showing all three drops moving in the same direction.
- Reversing the directions (denser drop rising).
- Failing to make the no-movement case for the middle tube explicit.
- Drawing unclear or ambiguous arrows.
Things to Be Careful About
- The middle tube MUST show no movement — equal density means no net force.
- Use clear, unambiguous arrows.
- Keep the marker line visible so the examiner can see the displacement.
You are provided with
- of sucrose solution in a beaker, labelled S
- of distilled water in a beaker, labelled W
- of sucrose solutions A and B
- of methylene blue, labelled D.
If any methylene blue comes into contact with your skin wash off immediately with water.
It is recommended that you wear safety goggles/glasses.
To find the concentration of sucrose in samples A and B you will need to dilute the sucrose solution to provide a range of concentrations.
Decide on the concentrations of sucrose solution that you will prepare using the sucrose solution and distilled water.
You will need to make up of each sucrose solution.
Prepare the space below to show
- the concentrations of sucrose solution
- the volumes of sucrose solution
- the volumes of distilled water.
Answer
| sucrose concentration / | volume of sucrose solution / | volume of distilled water / |
|---|---|---|
| 0.2 | 10 | 40 |
| 0.4 | 20 | 30 |
| 0.6 | 30 | 20 |
| 0.8 | 40 | 10 |
| 1.0 | 50 | 0 |
five standard concentrations 0.2, 0.4, 0.6, 0.8, 1.0 mol dm⁻³ with stock + water volumes totalling 50 cm³ for each
Background Concept
To identify the concentration of an unknown sucrose solution using the drop method, you need a series of standards (solutions of known concentration). These are made by diluting a stock solution (here sucrose) with distilled water.
The dilution formula is , where and are the concentration and volume of the stock, and and are the concentration and volume of the diluted solution. With a stock and a target volume of , the volume of stock required is numerically equal to the desired concentration multiplied by 50, and the volume of water is minus that stock volume.
A good calibration series uses at least three (preferably five) concentrations spaced evenly across the likely range of the unknowns.
Understanding the Question
You are given of sucrose solution and of distilled water. You need to make of each standard. You must present a clear plan showing the concentrations chosen, the volume of stock needed for each, and the volume of water needed to make total.
Approach
Choose an even range of concentrations covering the expected range of the unknowns. Apply for each, then subtract the stock volume from to find the water volume. Present this as a clear table.
Step-by-Step Reasoning
- Choose five evenly spaced concentrations spanning –, e.g. (interval of ).
- For each, calculate the stock volume using :
- : stock + water
- : +
- : +
- : +
- : +
- Verify that stock + water = for each row.
Key Takeaways
- A calibration series must be evenly spaced and span the expected range of the unknowns.
- is the standard dilution equation.
- Stock + water must equal the total volume required.
Common Mistakes
- Choosing uneven intervals (e.g. 0.1, 0.3, 0.5, 0.7 — intervals of 0.2 followed by 0.4).
- Forgetting to subtract stock volume from total volume to get water volume.
- Picking only one or two concentrations — three is the minimum, but five or more gives better resolution.
- Using awkward numbers (e.g. 0.13) that are difficult to measure accurately.
Things to Be Careful About
- The stock and water volumes for each row must sum exactly to .
- The concentrations must be achievable by dilution of stock (i.e. each must be ≤ 1.0).
- Present the table with clear column headings including units.
Make up the sucrose solutions that you have chosen in the containers provided.
- Place a syringe on top of the large test-tube and use the glass marker to draw a line on the test-tube at the same height as the end of the syringe nozzle as shown in Fig. 1.2.
- Use a syringe to collect of A and place it in a Petri dish. With a pipette, add sufficient drops of D to turn the solution blue and stir.
- Use the same syringe to collect of the coloured solution A. Wipe the syringe with a paper towel and label the syringe A.
- Repeat steps 2 and 3 with sample B and label the second syringe B.
- Put of one of your sucrose solutions into the large test-tube.
- As shown in Fig. 1.2, put syringe A into the large test-tube so the end of the nozzle is level with the mark.
Hold the syringe vertically and very gently push out a drop of the coloured solution. - Immediately observe the movement of the drop.
- Record your observations.
- Repeat steps 6 to 8 with sample B in syringe B.
- Empty and wash the large test-tube.
- Repeat steps 5 to 10 with each sucrose solution that you have made and record all your observations.
Prepare the space below to record your observations.
Answer
Key: ↑ = drop rises; ↓ = drop falls (sinks); → = drop remains at marker line.
| sucrose concentration / | syringe A | syringe B |
|---|---|---|
| 0.2 | ↓ | ↓ |
| 0.4 | ↓ | ↑ |
| 0.6 | ↓ | ↑ |
| 0.8 | ↑ | ↑ |
| 1.0 | ↑ | ↑ |
(Representative results consistent with and .)
see working — student-dependent observations; representative pattern: A falls in low concentrations and rises in high ones; B falls only at 0.2 and rises elsewhere
Background Concept
Recording qualitative observations clearly is essential in practical work. The CIE Paper 3 convention is:
- Headings at the top and to the left of the table, each with a quantity and a unit.
- Ruled internal cells but no outer boundary line.
- A key for any symbols used (e.g. ↑ for rises, ↓ for sinks, → for no movement).
Understanding the Question
You have tested drops of unknown solution A and unknown solution B (each coloured blue) in your series of standard sucrose solutions and recorded whether each drop rose, fell or stayed put. You must now record those observations in a properly formatted table.
Approach
Construct a table with the sucrose concentration of each standard as the left-hand column and one column per unknown (syringe A and syringe B). In each cell record the direction of drop movement using clear symbols. Include a key explaining the symbols.
Step-by-Step Reasoning
- The table needs the column headings: "sucrose concentration / ", "syringe A", "syringe B".
- Include a key: "↑ = rises, ↓ = falls, → = no movement".
- For each standard concentration, record what happened to the A drop and the B drop.
- The expected pattern (with the unknown concentrations suggested by the mark scheme) is:
- Unknown A is about : in standards less concentrated than A (0.2, 0.4, 0.6), the drop is denser than the surroundings and sinks; in standards more concentrated (0.8, 1.0), it is less dense and rises.
- Unknown B is about : it is denser than only the 0.2 standard (where it sinks) and less dense than all the others (where it rises).
Key Takeaways
- A results table for qualitative observations needs clear headings with units, a key for symbols, ruled cells with no outer boundary.
- The trend of drop movement (falling at low concentrations, rising at high concentrations) identifies the unknown's concentration: it lies between the last "fall" and the first "rise".
Common Mistakes
- Forgetting units in the heading ().
- Drawing an outer boundary line around the whole table.
- Omitting a key.
- Recording only one drop per concentration (the mark scheme expects two observations per concentration — one for A and one for B).
Things to Be Careful About
- Use a consistent key throughout the table.
- Make sure every (concentration × syringe) combination is filled in.
- Note the boundary where the direction changes — this is where the unknown concentration lies.
Use your results to estimate the sucrose concentration of
sample A = ______
sample B = ______
Answer
sample A =
sample B =
(These are the values bracketed by the direction-change in the table — A reverses between 0.6 and 0.8, B reverses between 0.2 and 0.4.)
A = 0.7 mol dm⁻³ ; B = 0.25 mol dm⁻³
Background Concept
When the drop of unknown solution neither rises nor falls, it has the same density (and hence the same concentration and water potential) as the surrounding standard. The concentration at which the drop reverses direction therefore gives the concentration of the unknown.
Understanding the Question
Use your results from part (a)(iv) to estimate the concentrations of unknowns A and B. The answer is a single value in for each.
Approach
Locate, for each unknown, the pair of adjacent standard concentrations where the drop changes from falling to rising (or vice versa). The unknown's concentration lies between those two values; estimate it by eye.
Step-by-Step Reasoning
- For unknown A: the drop falls in standards and rises in . The reversal lies between and . Reading from the table, .
- For unknown B: the drop falls only at and rises at . The reversal lies between and . Reading from the table, .
Key Takeaways
- The drop-reversal point gives the unknown's concentration.
- If the reversal is between two standards, the unknown lies between those values; estimate the value by eye.
Common Mistakes
- Quoting a value outside the bracketing range.
- Quoting too many significant figures when the calibration spacing is — one significant figure (or at most two) is appropriate.
- Failing to include the unit .
Things to Be Careful About
- The value must be consistent with your own observations.
- Use the unit .
- If your data are slightly different, give the value supported by your own table.
In order to find the water potential of the solutions A and B a graph is required showing the relationship between sucrose concentration and water potential.
Table 1.1 shows the water potential of different sucrose concentrations.
Table 1.1
| sucrose concentration / | water potential / |
|---|---|
| 0.15 | -5.0 |
| 0.35 | -12.0 |
| 0.55 | -19.0 |
| 0.75 | -26.0 |
| 1.00 | -35.0 |
Plot a graph of the data shown in Table 1.1.
Answer
Axes:
- -axis: sucrose concentration / , scale to in steps of .
- -axis: water potential / , with at the top and going down to at least in steps of (negative values shown clearly).
Points (plot as small crosses × or dots in circles):
Line: a single thin, ruled straight line of best fit through all five points (the relationship is linear).
see working — straight-line graph of water potential (y) against sucrose concentration (x) through the five plotted points
Background Concept
A calibration graph converts one measured quantity into another. Here you will use it to convert the concentration of unknown A (which you will determine in part (a)(v)) into a water potential.
CIE plotting conventions require:
- Each axis labelled with the quantity and its unit.
- A linear, easy-to-read scale (multiples of 1, 2 or 5 per 2 cm — not 3 or 7).
- The scale using at least half the available grid in both directions.
- All points plotted with a small cross (×) or a dot in a circle (⊙), so the intersection is clear.
- A single straight line of best fit through the points (not dot-to-dot joining).
For a y-axis with negative values, the zero must be at the top, with values becoming more negative going down.
Understanding the Question
Plot the data in Table 1.1 with sucrose concentration on the -axis and water potential on the -axis, then draw the line of best fit.
Approach
- Label the axes with quantity and unit.
- Choose scales: -axis to in steps; -axis (at top) to at most in steps of .
- Plot all five data points clearly.
- Draw a single thin, ruled straight line through the points.
Step-by-Step Reasoning
- X-axis label: "sucrose concentration / ". A suitable scale is to with major gridlines every .
- Y-axis label: "water potential / ". Because the values are negative, place at the top and label each major gridline with the corresponding negative value (e.g. ).
- Plot the five points: , , , , .
- Line of best fit: the points lie almost perfectly on a straight line, so draw a single ruled straight line through all five. Do not join dot-to-dot.
Key Takeaways
- Always label both axes with quantity AND unit.
- Choose a linear scale that uses at least half the grid.
- Plot all points with a small clear cross or dot in a circle.
- A single line of best fit — not joined segments — is required when the relationship is approximately linear.
Common Mistakes
- Reversing the axes (sucrose on , water potential on ).
- Forgetting units on either axis label.
- Awkward scale intervals (e.g. 3 per 2 cm).
- Plotting a point at the wrong position.
- Drawing a thick or feathery line.
- Joining the points dot-to-dot rather than drawing a line of best fit.
- Drawing the line through only some of the points.
Things to Be Careful About
- Negative y-axis: place 0 at the top; mark each gridline with the negative value.
- The line must be ruled (not freehand-sketched) and thin.
- Each axis must use at least half the available grid.
Using your results and your graph estimate the water potential of sample A.
Show clearly on your graph how you obtained the water potential.
water potential of sample A = ______
Working
Draw a vertical construction line from up to the calibration line, then a horizontal line from that intersection across to the -axis.
Read the -value at that intersection.
Answer
water potential of sample A ≈ (i.e. about ).
approximately −24 kPa × 10² (≈ −2400 kPa), reading from the graph at A = 0.7 mol dm⁻³
Background Concept
Once a calibration graph is drawn, an unknown value can be read off by drawing a vertical line from the -value up to the calibration line, then a horizontal line from that intersection across to the -axis. The intersection must be marked clearly so the examiner can see the working.
Understanding the Question
Use your graph from part (b)(i) and the concentration you found for sample A in part (a)(v) to estimate the water potential of A. Show your construction lines on the graph.
Approach
- Vertical line from up to the calibration line.
- Horizontal line from the intersection across to the -axis.
- Read off the -value, including units.
Step-by-Step Reasoning
- For :
- Using the linear relation between the tabulated values: slope per .
- At : .
- Reading from the graph: approximately to (in units), i.e. roughly .
Key Takeaways
- A calibration graph converts between variables.
- Construction lines (vertical then horizontal) are the standard way to read off an unknown value.
- Always include units with the final reading.
Common Mistakes
- Forgetting to draw the construction lines on the graph (losing the working mark).
- Quoting the answer without units.
- Misreading the y-axis (e.g. quoting when the axis is in — it should be in those units, i.e. ).
Things to Be Careful About
- The y-axis is in ; either quote the value in those units or convert to .
- Make the construction lines obvious on the graph so the examiner can see the working.
Describe how you would improve the investigation to obtain a more accurate estimate of the water potential of sample A.
Answer
Any three of the following:
- Prepare more sucrose solutions of known concentration, especially those close to the value of A (e.g. ), so the drop-reversal concentration can be pinpointed more precisely.
- Standardise the volume of methylene blue dye added to each sample (e.g. always add exactly the same number of drops from a dropping pipette), because the dye changes the density of the sample.
- Standardise the volume of the drop released into the test solution (e.g. always release one drop of the same size from the same syringe setting) — the drop's volume affects its motion.
- Measure the time taken for the drop to rise or sink a fixed distance (e.g. ), giving a more quantitative comparison than a simple "rises / falls".
more standards near A; standardise dye volume; standardise drop volume or measure time
Background Concept
To improve the accuracy of a practical procedure, identify specific sources of error and devise ways to reduce each one. In this experiment the main limitations are: (i) the coarse spacing of the standard concentrations, (ii) variation in the amount of dye added (which slightly changes the density of the drop), and (iii) variation in the volume of the drop released.
Understanding the Question
Suggest three improvements that would give a more accurate estimate of the water potential of sample A.
Approach
Walk through each step of the procedure mentally and ask "what could be more precise here?". Focus on (a) the calibration series, (b) the preparation of the coloured drop, and (c) the way the drop is released/observed.
Step-by-Step Reasoning
- Coarse calibration series — currently five standards at intervals. Near the unknown's concentration the reversal point can only be bracketed to ±. Preparing more standards tightly clustered around (e.g. ) would narrow the bracket and give a more precise answer.
- Variable dye volume — adding more or less methylene blue slightly changes the drop's density. Use a fixed number of drops from the same pipette each time.
- Variable drop volume — the syringe is pressed by hand, so drop size varies. Fix the syringe (e.g. always use the same setting) so each released drop has the same volume.
- Qualitative observation only — "rises / falls" is binary. Measuring the time for the drop to travel a fixed distance gives a quantitative measurement that can be plotted and compared across standards.
Key Takeaways
- Improvements must address specific limitations of the procedure, not vague "be more careful".
- More standards near the reversal point improve precision.
- Standardising dye and drop volumes removes uncontrolled variation.
- Quantitative measurements (e.g. time) carry more information than qualitative observations.
Common Mistakes
- Vague suggestions ("be more careful", "repeat the experiment", "use better equipment") — these don't address specific limitations.
- Improvements that are not practical in the school lab.
- Confusing improvements with controls (e.g. "use a control" — there is no control needed here, only better resolution and standardisation).
Things to Be Careful About
- Each improvement should be specific and tied to a particular limitation.
- The mark scheme accepts up to three distinct valid improvements.
- "Repeat the experiment" alone is not credited unless it is linked to a specific source of error.
The rest of this paper
1 more questions- Q2Use of the Light Microscope · Manipulation, Measurement and Observation17M