Biology 9700/34 — May/June 2010
Cambridge AS Level · Advanced Practical Skills · worked solutions for every part, with the mark scheme
Topics Presentation of Data and Observations · Analysis, Conclusions and Evaluation · Manipulation, Measurement and Observation · Use of the Light Microscope
Plant cells contain an enzyme, catalase, which catalyses the breakdown of hydrogen peroxide into oxygen and water.
You are required
- to immobilise the catalase in sodium alginate beads
- to investigate the independent variable, hydrogen peroxide concentration.
When a bead is dropped into hydrogen peroxide it will sink and then the release of oxygen causes the bead to rise.
You are provided with
- of hydrogen peroxide solution, labelled H
- of distilled water, labelled W
- of a plant extract containing catalase, labelled P
- of sodium alginate solution, labelled S
- of calcium chloride solution, labelled C.
Proceed as follows:
- Put of C into a large test-tube.
- Put of S into a small beaker.
- Put of P into the same beaker and mix well.
- Use a syringe to collect of the mixture, S and P.
- Suspend the syringe over the large test-tube containing C as shown in Fig. 1.1.
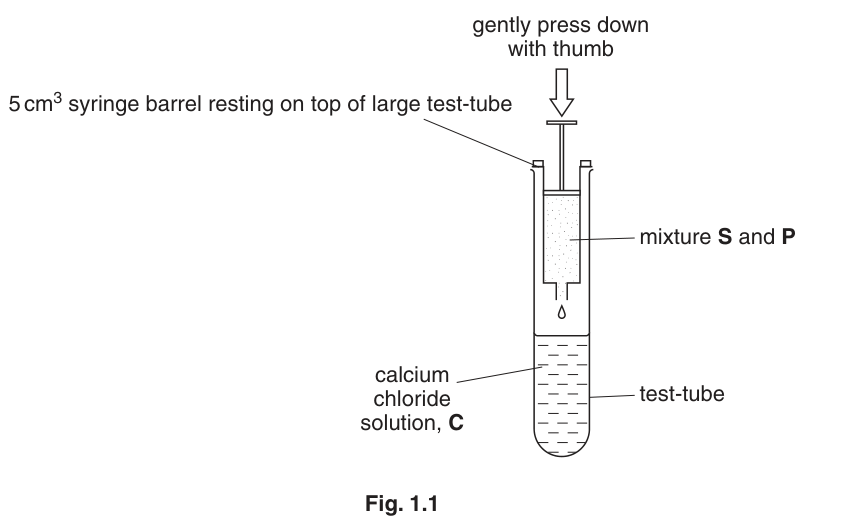
- Gently press down on the plunger of the syringe with your thumb to release a drop into solution C. The drop should form a bead.
- Repeat step 6 to make the number of beads that you think you will need.
- Tip the contents of the large test-tube into a Petri dish or shallow container.
Decide on the concentrations of hydrogen peroxide you will use in your investigation.
You will need to make up of each hydrogen peroxide concentration.
Prepare the space below to show
- the concentrations of hydrogen peroxide
- the volumes of hydrogen peroxide
- the volumes of distilled water.
Answer
| concentration of hydrogen peroxide / % | volume of H / | volume of W / |
|---|---|---|
| 10.0 | 10.0 | 0.0 |
| 5.0 | 5.0 | 5.0 |
| 2.5 | 2.5 | 7.5 |
| 1.25 | 1.25 | 8.75 |
Serial dilution: 10%, 5%, 2.5%, 1.25% — each made up to 10 cm³ total.
Background Concept
Hydrogen peroxide is broken down by the enzyme catalase into oxygen and water. The rate of this reaction depends on the concentration of substrate (H₂O₂): as the substrate concentration increases, more enzyme–substrate complexes form per unit time and the reaction rate rises, until the enzyme becomes saturated.
To investigate this, the candidate must make several different concentrations of hydrogen peroxide from the supplied 10% stock solution H. The cleanest way to obtain a spread of concentrations is a serial dilution — each successive dilution is made from the previous one (e.g. halving the concentration at each step).
Understanding the Question
The candidate has 50 cm³ of 10% hydrogen peroxide (H) and 100 cm³ of distilled water (W). They need to make 10 cm³ of each concentration they plan to test. The total volume of each solution should be 10 cm³, so volume of H + volume of W = 10 cm³ for every concentration.
Approach
- Plan at least three concentrations (more is better) spanning a useful range.
- Include 10% as the highest (to test saturation behaviour).
- Use a serial dilution so the concentrations are evenly spaced on a multiplicative scale (e.g. 10, 5, 2.5, 1.25 %).
- For each concentration, decide what volume of H and W gives 10 cm³ in total.
Step-by-Step Reasoning
- 10% (the stock): use 10 cm³ of H + 0 cm³ of W. No dilution.
- 5%: halve the concentration. Use 5 cm³ of H + 5 cm³ of W.
- 2.5%: halve again. Use 2.5 cm³ of H + 7.5 cm³ of W.
- 1.25%: halve again. Use 1.25 cm³ of H + 8.75 cm³ of W.
Each row has H + W = 10 cm³, and the four concentrations form a serial (halving) dilution including 10% as the maximum. An arithmetic (linear) range such as 10, 7.5, 5, 2.5, 1, 0 % would also be acceptable.
Key Takeaways
- Always include the original stock concentration in your range so the maximum effect is captured.
- A serial dilution gives evenly spaced concentrations with simple volumes.
- The volumes of H and W must add up to the total volume required (here, 10 cm³).
Common Mistakes
- Forgetting to include 10% as the highest concentration (the mark scheme requires it).
- Choosing unevenly spaced concentrations that waste part of the range.
- Volumes of H and W that do not add up to 10 cm³.
- Choosing only two concentrations — three or more is required.
Things to Be Careful About
- Read the bottle labels carefully — H is hydrogen peroxide, W is distilled water, S is sodium alginate, C is calcium chloride, P is plant extract. Do not confuse them.
- The stock solution is 10% — not 1%, not 100%.
- Put of H into a small test-tube in a test-tube rack.
- Pick up a bead using blunt forceps.
- Drop the bead into H and immediately start the stop clock, stop watch or note the time on a clock.
- Record the time taken for the bead to reach the surface.
- Repeat steps 9 to 12 with each concentration of H that you have chosen to use.
(A bead may sink to the bottom of the tube. If it does not rise to the surface after three minutes, stop the experiment and record minutes.)
Prepare the space below to record your results.
Answer
Representative example (the candidate's own results will differ):
| concentration of H / % | trial 1 time / s | trial 2 time / s | trial 3 time / s | mean time / s |
|---|---|---|---|---|
| 10.0 | 7 | 8 | 9 | 8 |
| 5.0 | 17 | 18 | 19 | 18 |
| 2.5 | 40 | 42 | 44 | 42 |
| 1.25 | 90 | 95 | 100 | 95 |
Example results: 10% → 8 s, 5% → 18 s, 2.5% → 42 s, 1.25% → 95 s (mean of three trials; whole seconds; time shorter at higher concentration).
Background Concept
When an alginate bead containing catalase is dropped into hydrogen peroxide, oxygen is released inside the bead. The oxygen bubbles make the bead buoyant, so it rises to the surface. The faster the reaction proceeds, the more oxygen is released per unit time, and the sooner the bead reaches the surface. Time for the bead to rise is therefore an indirect measure of the rate of reaction.
Understanding the Question
The candidate has prepared several concentrations of H and must now record the time taken for a bead to rise to the surface in each. The mark scheme rewards:
- a complete, ruled table;
- concentration as a column or row heading;
- time with units as a column or row heading (units must be in the heading, not in the body of the table);
- times recorded to whole seconds (or whole minutes if very slow);
- the trend: shorter time at higher concentration;
- repeats (more than one bead per concentration) or at least six different concentrations.
Approach
- Draw a complete table with all cells ruled.
- Headings include the quantity and unit, e.g. time / s and concentration of H / %.
- Record time to the nearest whole second.
- Repeat each concentration with at least two more beads and calculate a mean.
Step-by-Step Reasoning
- The candidate drops a bead into 10 cm³ of H in a small test-tube, starts the clock, and times how long the bead takes to reach the surface.
- Three trials per concentration and a mean give a more reliable estimate than a single trial.
- The example data above show a clear trend: as the concentration of H falls from 10% to 1.25%, the mean time for the bead to rise increases from about 8 s to about 95 s.
- This is consistent with the biology: at higher substrate concentration more enzyme–substrate complexes form per second, more O₂ is released per second, and the bead becomes buoyant sooner.
Key Takeaways
- A results table must have a quantity plus unit as a heading; never put units in the body of the table.
- Repeats and a mean are a mark-scheme expectation in CIE practical work.
- The independent variable (concentration) should be on one axis, the dependent variable (time) on the other.
Common Mistakes
- Putting units in the body of the table (e.g. writing "8 s" in a cell) — units belong in the heading.
- Failing to repeat — without repeats you cannot gain the reliability mark.
- Not recording the correct trend — the highest concentration should give the shortest time.
- Recording times with unnecessary decimal places (e.g. 8.3 s) when whole seconds are appropriate.
Things to Be Careful About
- If a bead does not rise after 3 minutes, the procedure says record ">3 minutes" and stop the experiment for that tube.
- Times should be recorded as whole seconds (or whole minutes) for consistency.
Identify three significant errors in your investigation.
Answer
Any three from:
- The beads are not all the same size / some are damaged when picked up with forceps.
- The test-tubes are not held vertically, so the distance the bead has to travel is inconsistent between trials.
- The temperature is not controlled — enzyme activity is temperature-sensitive, so any variation changes the rate.
- Beads may stick to the side of the test-tube or to other beads already in the tube, delaying or preventing them from rising.
- The test-tubes are not all the same size / diameter, so the bead has a different distance to travel in each.
- The hydrogen peroxide concentration may change during the experiment (H₂O₂ decomposes spontaneously and the stock weakens with time).
Any three significant errors, e.g. beads not all the same size, test-tubes not vertical, temperature not controlled.
Background Concept
In a fair test, only the independent variable should change; every other variable should be controlled. A significant error is one that is large enough to affect the result and cannot be ignored. Trivial errors (e.g. slight misreading of the clock) are not credited — the error must genuinely affect the outcome.
Understanding the Question
The candidate has just performed the investigation and now has to identify three significant errors. These are practical sources of uncertainty or bias that could affect the measured times.
Approach
Think about the variables in the experiment and what could vary from one trial to the next:
- the beads themselves (size, shape, damage, mass of catalase);
- the test-tubes (size, angle, cleanliness);
- the conditions (temperature, pH);
- the substrate (H concentration, freshness, contamination);
- the procedure (how the bead is added, how the time is measured).
For each candidate error, ask: is it significant? Would it noticeably affect the time? If yes, it is creditable.
Step-by-Step Reasoning
- Beads not all the same size: when the plunger is pressed, individual drops may not be identical. Larger beads contain more catalase and need more gas to lift them; smaller beads rise more easily. The "bead size" variable is therefore not controlled.
- Test-tubes not vertical: the bead travels a longer or shorter distance depending on the angle. Also, viewed from the side, it may look like the bead has reached the surface when it has not.
- Temperature not controlled: enzyme-catalysed reactions are temperature-sensitive. A few degrees of variation changes the rate appreciably.
- Beads stick to the side / to other beads: this delays or prevents the bead from rising, biasing the time upward.
- Different test-tube sizes: the bead must travel a different distance in a longer or shorter tube, and the volume of H above the bead differs.
- H₂O₂ concentration changes: hydrogen peroxide slowly decomposes, so a stock left out for a long time becomes weaker. Fresh H should be used for each test.
Key Takeaways
- Significant errors are sources of variation that can plausibly affect the result.
- Errors must be specific to this experiment — generic statements like "human error" do not score.
- Each error should describe what the source of variability is, not just say that the result is inaccurate.
Common Mistakes
- Vague answers like "human error" or "parallax error" — these are not specific to the procedure described.
- Naming a controlled variable that is in fact well controlled (e.g. "the wrong syringe was used").
- Repeating the same error in different words.
- Confusing errors with improvements — the question asks for what went wrong, not how to fix it.
Things to Be Careful About
- "Significant" means a real source of variation, not a theoretical risk that has been eliminated.
Suggest how you would make three improvements to this investigation.
Answer
Any three from:
- Beads: sieve beads through a grid of the same mesh size, or let the alginate drip from a fixed height into CaCl₂ so beads are uniform in size.
- Method: use a wider range of concentrations, or use fresh hydrogen peroxide for each trial, or wash and dry beads between trials.
- Conditions: place the test-tubes in a thermostatically controlled water bath at a constant temperature (e.g. 25 °C).
- Measuring: hold the test-tube vertically in a retort stand; use a video camera or light gate to record when the bead reaches the surface; mark a line on the tube at the surface level to give a clear end-point.
- Reliability: repeat each concentration with several beads and calculate a mean.
Any three improvements, e.g. sieve beads for uniform size, water bath at constant temperature, repeat and take a mean.
Background Concept
Improvements should address the significant errors identified in the previous part. A good improvement:
- names a specific change;
- explains how it removes or reduces the source of variability;
- is practical in a school or college laboratory.
Understanding the Question
The candidate must suggest three improvements. The mark scheme groups the improvements into categories:
- improvements to the beads (uniformity, damage);
- improvements to the method (range of H, fresh H, washed beads, same-size tube);
- improvements to the conditions (water bath);
- improvements to the measurement (vertical tube, video, light gate, marked line);
- reliability (repeats and mean).
Approach
Pick three improvements, ideally from different categories, each clearly linked to a specific problem with the original method.
Step-by-Step Reasoning
- Beads: a sieve with holes of fixed size would select beads of similar diameter; or letting the syringe drip from a fixed height produces beads of consistent volume.
- Method: a wider range of concentrations (e.g. adding 7.5%, 3.75% to the dilution series) gives a smoother rate-vs-concentration curve. Fresh H for each trial keeps the substrate concentration constant.
- Conditions: a thermostatically controlled water bath holds the H solution (and the bead, via the test-tube) at a chosen temperature throughout the experiment.
- Measuring: mounting the test-tube vertically in a retort stand fixes the distance to the surface; a video camera or light gate removes the human reaction-time element from starting and stopping the clock; a marked line on the tube at the surface level provides a clear end-point.
- Reliability: at least two or three beads per concentration, with a mean, reduces the effect of random variation in bead size or catalase loading.
Key Takeaways
- A good improvement is specific and tied to a real source of error.
- Improvements can target the apparatus, the procedure, the conditions, the measurement, or the reliability.
- "Repeat and take a mean" is a valid improvement whenever the experiment has been done only once per condition.
Common Mistakes
- Vague suggestions like "be more careful" or "use better equipment".
- Suggestions that would change the independent variable (e.g. "use a different enzyme").
- Suggesting more readings but not mentioning the mean.
- Improvements that contradict one of the controlled variables.
Things to Be Careful About
- Match the improvement to a specific problem — e.g. do not say "use a water bath" without saying what variable it controls.
- The improvement must be practically achievable; exotic equipment is unlikely to be credited.
A student investigated the evolution of oxygen during the breakdown of hydrogen peroxide. Immediately the catalase and the hydrogen peroxide were mixed, a stop clock was started and the volume of oxygen released in each minute for five minutes was recorded.
The student's results are shown in Table 1.1.
Table 1.1
| time / min | volume of oxygen collected in each minute / | |||||
|---|---|---|---|---|---|---|
| trial 1 | trial 2 | trial 3 | trial 4 | trial 5 | mean | |
| 1 | 3.0 | 2.8 | 3.0 | 2.9 | 2.8 | 2.9 |
| 2 | 0.6 | 0.8 | 0.8 | 0.7 | 0.9 | 0.8 |
| 3 | 0.4 | 0.5 | 0.6 | 0.6 | 0.7 | 0.6 |
| 4 | 0.3 | 0.3 | 0.4 | 0.5 | 0.5 | 0.4 |
| 5 | 0.1 | 0.2 | 0.2 | 0.1 | 0.3 | 0.2 |
Plot a graph of the data shown in Table 1.1.

Answer
Axes:
- x-axis: time / min, scale 1 min to 2 cm (so 0, 1, 2, 3, 4, 5 min)
- y-axis: volume / , scale 0.5 to 2 cm (so 0, 0.5, 1.0, 1.5, 2.0, 2.5, 3.0 )
Mean points to plot:
| time / min | volume / |
|---|---|
| 1 | 2.9 |
| 2 | 0.8 |
| 3 | 0.6 |
| 4 | 0.4 |
| 5 | 0.2 |
Plot each mean as a small cross (×) or dot in a circle (⊙). Draw a smooth curve through the five points — the curve falls steeply from (1, 2.9) to (2, 0.8) and then more gradually down to (5, 0.2).
See diagram — line graph of volume of oxygen (y) against time (x) with a smooth curve through the five mean points (1, 2.9), (2, 0.8), (3, 0.6), (4, 0.4), (5, 0.2).
Background Concept
A line graph is the right choice when both variables are continuous and the dependent variable (volume of oxygen) is measured repeatedly at successive values of the independent variable (time). The slope of the curve at any moment gives the instantaneous rate of oxygen production; the higher the slope, the faster the reaction at that moment.
Understanding the Question
The data in Table 1.1 are the mean volumes of oxygen collected in each one-minute interval. The candidate must plot a graph on the grid provided (Fig. 1.2). The marks are awarded for:
- Orientation: axes correctly labelled with quantity and unit;
- Scale: a non-awkward scale that uses at least half the grid;
- Plotting: each point marked with a small cross or dot in a circle;
- Line: a smooth curve through the points (or ruled straight lines joining the points).
Approach
- x-axis: time / min, because time is the independent variable.
- y-axis: volume / cm³, because the volume of oxygen released is what is being measured.
- Choose scales that are simple multiples (1 min per 2 cm, and 0.5 cm³ per 2 cm) and that use most of the grid.
- Plot the five mean values precisely.
- Draw a smooth curve — the data fall rapidly then level off, so a curve is more appropriate than straight lines.
Step-by-Step Reasoning
- Time scale: 1 min per 2 cm means each 2-cm grid square represents 1 minute. From 0 to 5 min uses 10 cm of the x-axis, which fits comfortably on the 12 cm grid.
- Volume scale: 0.5 cm³ per 2 cm means each 2-cm grid square represents 0.5 cm³. From 0 to 3 cm³ uses 12 cm of the y-axis (6 squares × 2 cm), filling the grid.
- Both scales are non-awkward (multiples of 1, 2, 5, 10 — not 3 or 7).
- The five mean points are (1, 2.9), (2, 0.8), (3, 0.6), (4, 0.4), (5, 0.2).
- (1, 2.9) lies near the top-left of the plotted area.
- (2, 0.8) is much lower, one and three-fifths small squares (0.8 cm³) up the y-axis.
- (3, 0.6), (4, 0.4), (5, 0.2) form a gentle downward slope.
- A smooth curve is the best fit because the underlying rate of oxygen release decreases continuously as the substrate is used up.
Key Takeaways
- Axes must have a quantity and a unit in the heading.
- Choose non-awkward scales that use at least half the grid in both directions.
- Plot mean values (not individual trials) when these are given.
- A smooth curve is appropriate when the data clearly do not lie on a straight line.
Common Mistakes
- Plotting individual trial values instead of the means.
- Awkward scales (e.g. 3 cm³ per 2 cm) — these make plotting harder and are rejected by the mark scheme.
- Joining points with ruled straight lines when a smooth curve is the better fit (or vice versa).
- Forgetting units on the axis labels.
- Plotting the first point at time = 0 (the first reading is for the first minute, so the x-value is 1, not 0).
Things to Be Careful About
- Use small crosses (×) or dot-in-circle (⊙) so the exact point is unambiguous; blobs are rejected by the mark scheme.
- Do not extrapolate the curve beyond the data — there is no information about the rate outside the 1–5 min range.
Describe and explain the results of the student's investigation.
Answer
- The volume of oxygen collected is largest in the first minute (mean 2.9 ) and then decreases markedly to 0.8 in the second minute; it continues to fall more slowly to 0.2 by the fifth minute. [1]
- The high initial rate is because the hydrogen peroxide substrate is in plentiful supply and fits into the active sites of catalase, forming many enzyme–substrate complexes. [1]
- The rate then decreases because the concentration of hydrogen peroxide falls as it is broken down; there is less substrate available to bind to the active sites of catalase, so fewer enzyme–substrate complexes form per unit time. [1]
Fastest in the first minute (2.9 cm³), then declining; explained by plentiful substrate forming many enzyme–substrate complexes initially, then substrate becoming limiting as it is used up.
Background Concept
Catalase is an enzyme that breaks down hydrogen peroxide (H₂O₂) into water and oxygen. Like all enzymes, it works by binding its substrate at the active site, forming an enzyme–substrate complex (ESC). The rate of reaction depends on how often these complexes form and break down to release the products.
When the substrate concentration is high, the active sites are constantly occupied and the rate is at its maximum. As the substrate is consumed, fewer substrate molecules are available per unit time, the active sites are increasingly unoccupied, and the rate falls. This is the classic substrate-depletion curve seen in any enzyme reaction run to completion in a closed system.
Understanding the Question
The candidate is given a table of mean oxygen volumes collected in successive one-minute intervals. The question asks them to describe and explain the trend. The mark scheme credits three ideas:
- a description of the trend (largest in minute 1, then decreasing);
- an explanation of the high initial rate in terms of substrate binding to active sites / forming ESCs;
- an explanation of the later decrease in terms of the substrate running out / not being at a high enough concentration.
Approach
- Read the means from Table 1.1: 2.9, 0.8, 0.6, 0.4, 0.2 cm³ at minutes 1 to 5.
- Describe: largest in the first minute, then a sharp fall, then a gradual decline.
- Explain the high first-minute rate: lots of substrate molecules, all the active sites are busy, many ESCs form per second.
- Explain the decline: the substrate is being used up, so there are fewer H₂O₂ molecules available, the active sites are less often occupied, fewer ESCs form per unit time, and less O₂ is released per minute.
Step-by-Step Reasoning
- The volume of oxygen collected in each minute is a measure of the rate of the reaction in that minute (cm³ O₂ per minute).
- In minute 1 the mean is 2.9 cm³, much higher than any later minute. The biggest single drop in the table is from 2.9 (minute 1) to 0.8 (minute 2).
- From minute 2 to minute 5 the means decline more gently: 0.8 → 0.6 → 0.4 → 0.2.
- The biological reason for the high initial rate: at the start, the concentration of H₂O₂ is at its maximum. Every catalase active site has substrate available, so a maximum number of enzyme–substrate complexes form per unit time, and a maximum amount of O₂ is released per minute.
- The biological reason for the later decline: as the reaction proceeds, the H₂O₂ is broken down into water and oxygen. The substrate concentration falls, so at any later moment there are fewer H₂O₂ molecules available, the active sites are less often occupied, fewer ESCs form per unit time, and less O₂ is released per minute.
Key Takeaways
- "Describe and explain" requires both what happens in the data AND why it happens biologically.
- The two main enzyme-rate concepts to draw on are: substrate binding at the active site, and substrate concentration / availability.
- A typical enzyme reaction run to completion shows a steeply declining rate, exactly as in this table.
Common Mistakes
- Describing only the trend without any biological explanation (loses the second and third marks).
- Giving a generic explanation like "the enzyme denatures" — there is no evidence for this; the rate falls because the substrate is used up, not because the enzyme has been damaged.
- Failing to quote a number from the data, e.g. just saying "the rate falls" without reference to 2.9, 0.8, etc.
- Confusing "the rate decreases" (which the mark scheme wants) with "the rate is high" or "the rate is fast".
Things to Be Careful About
- "Describe" needs a numerical or comparative statement; "explain" needs a mechanism in terms of enzyme–substrate interactions.
- Use the precise term "enzyme–substrate complex" (or "ESCs") rather than vague phrases like "the enzyme reacts with the substrate".
The rest of this paper
1 more questions- Q2Use of the Light Microscope · Presentation of Data and Observations · Analysis, Conclusions and Evaluation18M