Biology 9700/33 — May/June 2010
Cambridge AS Level · Advanced Practical Skills · worked solutions for every part, with the mark scheme
Topics Presentation of Data and Observations · Analysis, Conclusions and Evaluation · Manipulation, Measurement and Observation · Use of the Light Microscope
You are required to investigate how much glucose diffuses through selectively permeable Visking (dialysis) tubing in 15 minutes.
You are provided with
- of 10% glucose solution, labelled G
- about of Visking (dialysis) tubing in a container of distilled water, labelled V
- of distilled water, labelled W
- of 0.1% glucose solution, labelled S1
- of 0.2% glucose solution, labelled S2
- of 0.3% glucose solution, labelled S3
- of Benedict’s solution, labelled Benedict’s solution.
Proceed as follows:
- Tie a knot in the Visking tubing as close as possible to one end so that it seals the end.
- To open the other end, wet the Visking tubing and rub the tubing gently between your fingers.
- Use a syringe to put of G into the open end of the Visking tubing.
- Rinse the outside of the Visking tubing by dipping it into the water in the container labelled V.
- Put the Visking tubing into a large test-tube in a test-tube rack.
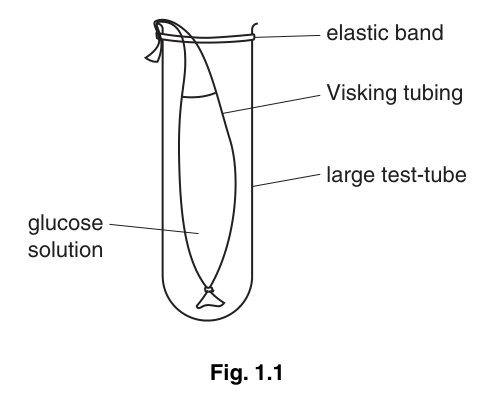
- Fold the open end of the Visking tubing over the top of the large test-tube as shown in Fig. 1.1.
- Use an elastic band to hold the Visking tubing in place.
- Use a syringe to put some of W into the large test-tube so that it surrounds the Visking tubing.
- Immediately start a stop clock, stop watch or record the time on a clock to time for 15 minutes.
Draw on Fig. 1.1 a line to show the level of water in the large test-tube.
To find out how much glucose has diffused out of the Visking tubing after 15 minutes, you are provided with solutions S1, S2 and S3.
In order to find how much glucose has diffused from inside the Visking tubing into the water you will need to test a sample of the water with Benedict’s solution.
You should record the time taken for the first appearance of any green colour.
The result will be compared with the time taken for the first appearance of any green colour obtained from testing solutions S1, S2 and S3 with Benedict’s solution.
To do this you need to use the same procedure.
State the volume of Benedict’s solution and the volume of the solutions (S1, S2 and S3) and the sample you are testing.
volume of Benedict’s solution = ______
volume of each solution (S1, S2 or S3) = ______
volume of sample = ______
State one variable, other than volume, which needs to be kept constant when you do the tests and describe how you will keep this variable constant.
- After 15 minutes, pour the water from around the Visking tubing into a beaker or container and label it sample.
- Now test all four solutions, sample, S1, S2 and S3.
Prepare the space below and record your results.
Estimate the concentration of glucose in the sample.
Suggest how you might modify this investigation to find the effect of temperature on the rate of diffusion of glucose through Visking tubing.
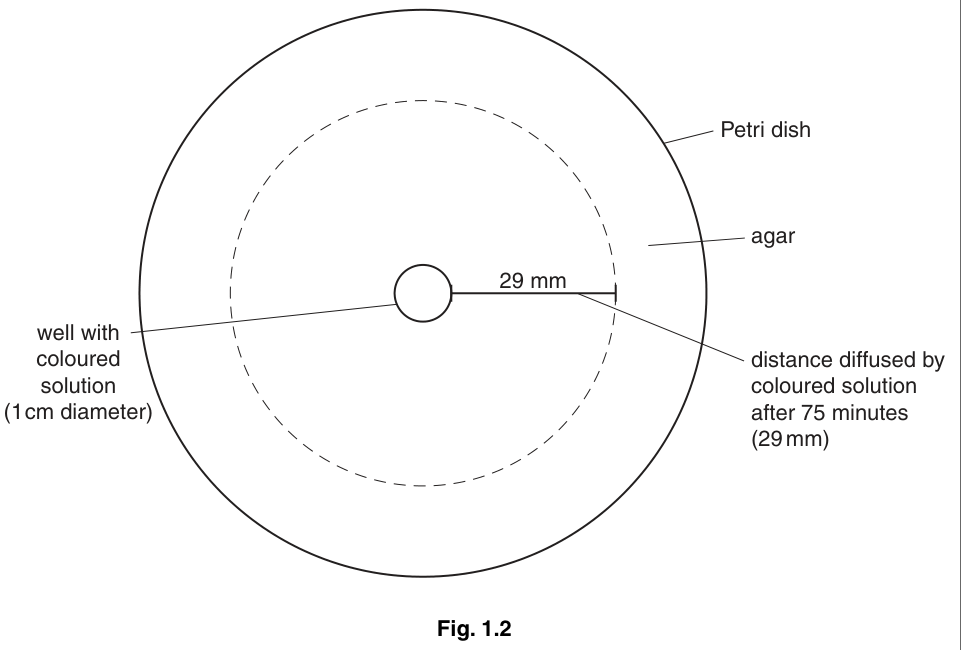
A student investigated the rate of diffusion of a coloured solution through agar. A Petri dish containing a layer of agar had a small well of diameter, cut so that 10 drops of the coloured solution could be placed in the well. The distance the coloured solution diffused from the edge of the well was measured at 15 minute intervals.
Fig. 1.2 shows the surface view of the Petri dish after 75 minutes.
The results of the student’s investigation are shown in Table 1.1.
Table 1.1
| time / min | distance diffused from well by coloured solution / mm |
|---|---|
| 0 | 0 |
| 15 | 14 |
| 30 | 22 |
| 45 | 26 |
| 60 | 28 |
| 75 | 29 |
Plot a graph to show the results in Table 1.1.
Use the graph to calculate the rate of diffusion of the solution between 10 minutes and 20 minutes.
Show on your graph where you took the readings.
Show all the steps in your calculation.
Describe and explain the trend in the rate of diffusion shown in the graph you have drawn in (e)(i).
The ruler used to measure the distances in Table 1.1 is shown in Fig. 1.3.
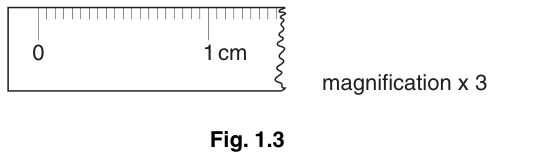
State the uncertainty of the measurements using this ruler.
The rest of this paper
1 more questions- Q2Use of the Light Microscope · Presentation of Data and Observations · Analysis, Conclusions and Evaluation18M