Biology 9700/32 — May/June 2010
Cambridge AS Level · Advanced Practical Skills · worked solutions for every part, with the mark scheme
Topics Presentation of Data and Observations · Manipulation, Measurement and Observation · Analysis, Conclusions and Evaluation · Use of the Light Microscope
Yeast cells contain enzymes which catalyse the breakdown of glucose to produce carbon dioxide and water.
The carbon dioxide reacts with water and forms a weak acid.
Bromothymol blue is a pH indicator and changes colour as shown in Table 1.1.
Table 1.1
| pH | colour of bromothymol blue |
|---|---|
| 8 | blue |
| 7 | green |
| 6 | yellow |
You are required
- to immobilise the yeast cells in sodium alginate beads
- to follow a student’s procedure to investigate the independent variable, changing the surface area of the beads.
You are provided with
- of yeast suspension, labelled Y
- of sodium alginate solution, labelled S
- of calcium chloride solution, labelled C
- of glucose solution, labelled G
- of bromothymol blue, labelled B
- of sodium hydroxide solution, labelled A
- Put of C into a large test-tube.
- Put of S into a small beaker or container.
- Collect of Y from below the froth and put it into the same container as S. Mix well.
- Use a syringe to collect of the mixture S and Y.
- Suspend the syringe over the large test-tube containing C as shown in Fig. 1.1.
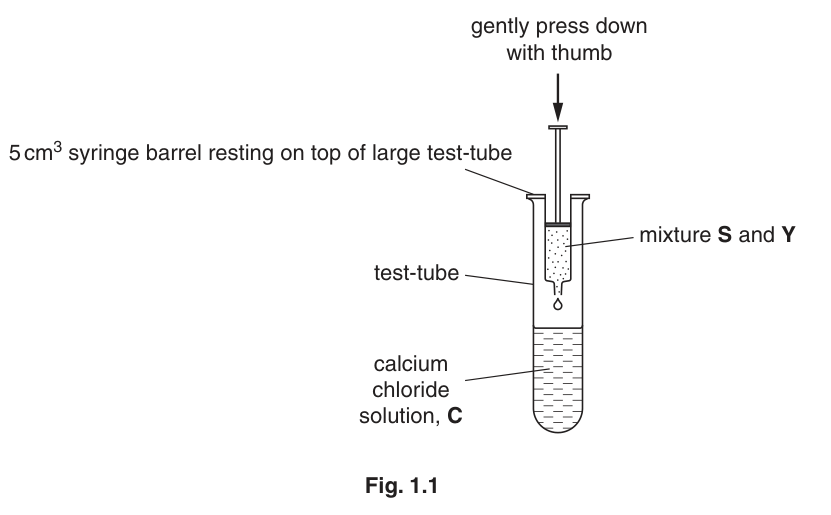
- Gently press down on the plunger of the syringe with your thumb to release a drop into solution C. The drop should form a bead.
- Repeat step 6 to make the number of beads that you think you will need.
- Tip the contents of the large test-tube into a Petri dish or shallow container.
You will need to calculate the mean surface area of the beads. Use blunt forceps to pick up the beads.
To do this
- decide on the number of beads you will measure
- use the grid to measure each bead
- calculate the surface area of each bead using the formula
- calculate the mean surface area of the beads.
Prepare the space below to show your measurements and calculations.
Show all the steps in your calculation of the mean.
mean surface area of the beads = ______
A student suggested that it was possible to investigate the independent variable, surface area, by changing the number of beads. The maximum number of beads used was 20. Decide the other numbers of beads to use and state the different number of beads you will use.
Carry out the student’s procedure.
- Label as many small test-tubes as you will need with the number of beads for each test-tube.
- Put of solution G into each test-tube.
- Put of B into each test-tube. Put the bung in each test-tube in turn and mix.
- If the contents of the test-tube are not blue, add one drop at a time of A to the contents of each test-tube to turn them all the same blue colour.
- Put the required number of beads into each test-tube.
- Put the bung in each test-tube in turn and mix contents. Mix every 2 minutes for 6 minutes.
- Record your observations after each 2 minutes, up to 6 minutes.
Prepare the space below to record your observations.
The student realised that there were two independent variables in this procedure.
State the two independent variables.
Suggest how you would make three improvements to the student’s procedure.
A student set up the apparatus as shown in Fig. 1.2 as another way to measure the carbon dioxide produced by immobilised yeast cells over a period of 75 minutes. The student measured the distance the liquid moved in the capillary tubing.
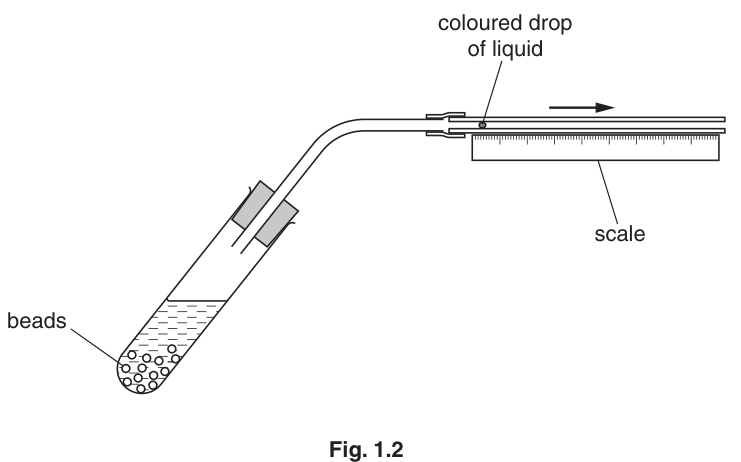
The student’s results are shown in Table 1.2.
Table 1.2
| time / min | total distance moved by the liquid in the capillary tube / mm |
|---|---|
| 0 | 0 |
| 15 | 3 |
| 30 | 10 |
| 45 | 18 |
| 60 | 19 |
| 75 | 19 |
Describe and explain the results shown in Table 1.2.
The rest of this paper
1 more questions- Q2Use of the Light Microscope · Manipulation, Measurement and Observation · Analysis, Conclusions and Evaluation · Presentation of Data and Observations21M