Biology 9700/52 — October/November 2025
Cambridge A-Level · Planning, Analysis and Evaluation · worked solutions for every part, with the mark scheme
Topics Planning · Analysis, Conclusions and Evaluation
The plantain lily, Hosta plantaginea, as shown in Fig. 1.1, is a flowering plant found in Asia.
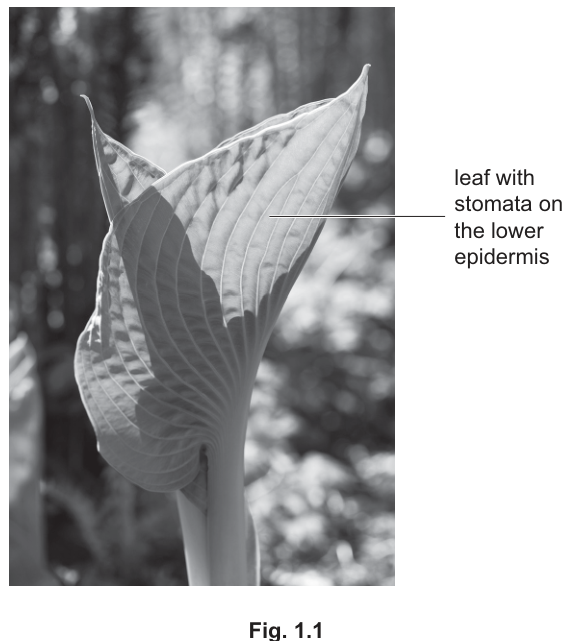
Fig. 1.1
The hydrostatic pressure increases inside guard cells when water enters the guard cells down a water potential gradient. This affects the width of the stomata.
Fig. 1.2 shows 1 open stoma from the plantain lily surrounded by 2 guard cells.
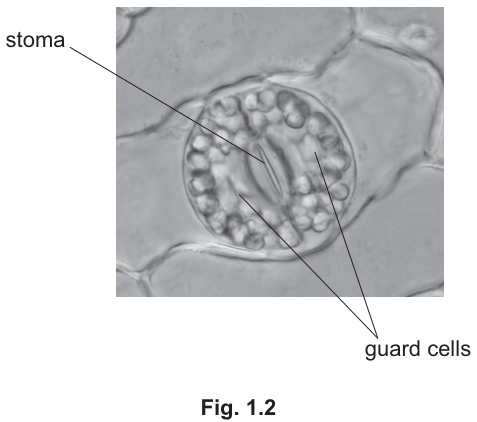
Fig. 1.2
A student investigated the effect of different sucrose solutions on the width of stomata in the leaves of plantain lily.
The student:
• prepared 5 microscope slides as shown in Table 1.1
Table 1.1
| microscope slide number | liquid added to microscope slide |
|---|---|
| 1 | large drop of distilled water |
| 2 | large drop of 2.5% sucrose solution |
| 3 | large drop of 5.0% sucrose solution |
| 4 | large drop of 10.0% sucrose solution |
| 5 | large drop of 20.0% sucrose solution |
• removed the lower epidermis from a leaf of plantain lily
• immersed 1 small piece of lower epidermis in the drop on microscope slide 1
• placed a cover slip over the piece of lower epidermis
• observed the stomata using a light microscope fitted with an eyepiece graticule
• repeated the steps for microscope slides 2, 3, 4 and 5.
State the independent and dependent variables in the investigation.
independent = ______
dependent = ______
Answer
- Independent: sucrose concentration
- Dependent: width of stomata
Independent: sucrose concentration; Dependent: width of stomata
Background Concept
In any experiment, the independent variable (IV) is the factor that is deliberately changed (or selected) by the experimenter, while the dependent variable (DV) is the factor that is measured in response. Identifying these correctly is the foundation of experimental design. All other factors that could affect the result must be kept the same; these are control variables and must not be confused with the IV or DV.
Understanding the Question
The student has set up five microscope slides, each with a different sucrose solution (Table 1.1): distilled water (0%), 2.5%, 5.0%, 10.0% and 20.0% sucrose. After adding pieces of lower epidermis, the student observes the stomata. The question asks which factor is being changed between slides and which factor is being measured.
Approach
Read Table 1.1 to identify what differs between slides — that is the IV. Look at the description of what the student observes and records under the microscope — that is the DV. Anything that is kept the same (e.g. species, microscope, immersion setup) is a control variable and should not be listed.
Step-by-Step Reasoning
- Table 1.1 shows that the sucrose concentration of the solution surrounding the epidermis is varied between slides — this is the IV.
- The student observes the stomata under the microscope and could measure their width using the calibrated eyepiece graticule — this is the DV.
- All other conditions (the species of plant, the piece of lower epidermis, the use of a microscope) are kept the same; these are control variables and must not be listed as the IV or DV.
Key Takeaways
- The IV is what the experimenter deliberately changes.
- The DV is what is measured in response to the IV.
- Control variables are kept constant and should not be confused with the IV or DV.
Common Mistakes
- Listing the wrong variable (e.g., saying the IV is the width of stomata).
- Including control variables (e.g., the type of microscope used, the plant species).
- Vague descriptions (e.g., 'amount of sucrose' instead of 'sucrose concentration').
Things to Be Careful About
- Use the precise wording 'sucrose concentration' (not 'amount of sucrose') for the IV — concentration is the variable, not the absolute amount added.
- Use 'width of stomata' (or 'stomatal width / aperture') for the DV.
The student prepared of 2.5%, 5.0% and 10.0% sucrose solutions from a 20.0% w/v stock solution.
Complete the description of the student’s dilution method for the 2.5% and 5.0% sucrose solutions by writing the correct volumes in the following sentences.
The student mixed ______ of 20.0% sucrose stock solution with ______ of distilled water to produce a 2.5% sucrose solution.
The student mixed ______ of 20.0% sucrose stock solution with ______ of distilled water to produce a 5.0% sucrose solution.
Working
Using with a total volume of :
For the 2.5% sucrose solution:
Volume of distilled water = .
For the 5.0% sucrose solution:
Volume of distilled water = .
Answer
- 2.5% sucrose solution: mix of 20.0% stock with of distilled water.
- 5.0% sucrose solution: mix of 20.0% stock with of distilled water.
2.5 cm³ stock + 17.5 cm³ water (for 2.5%); 5.0 cm³ stock + 15 cm³ water (for 5.0%)
Background Concept
A serial dilution is prepared by taking a known volume of a stock solution and diluting it with solvent (water) to a fixed total volume, reducing the concentration in a predictable way. The relationship is given by:
where and are the concentration and volume of the stock (starting) solution, and and are the concentration and volume of the diluted solution. Here, the total volume of each diluted solution is fixed at .
Understanding the Question
The student must prepare of 2.5% and 5.0% sucrose solutions by diluting the 20.0% stock solution with distilled water. We need to calculate how many of stock and how many of water to mix.
Approach
Apply with %, % (or 5.0%), and . Solve for , then subtract from to find the volume of water.
Step-by-Step Reasoning
For the 2.5% sucrose solution:
- %, %, .
- of stock.
- Volume of water = .
For the 5.0% sucrose solution:
- %, %, .
- of stock.
- Volume of water = .
Check: the two numbers in each pair must sum to — stock volume and water volume together make the total.
Key Takeaways
- is the standard dilution equation.
- Total volume = stock volume + water (solvent) volume.
- Serial dilutions allow precise preparation of intermediate concentrations from a single stock.
Common Mistakes
- Using the wrong units for concentration (e.g., treating 2.5 as 2.5 ).
- Forgetting that water must be added to bring the total volume to .
- Giving only the stock volume (the water volume is the second required mark).
Things to Be Careful About
- Express each volume in .
- The mark scheme requires BOTH numbers (stock volume AND water volume) for the mark — give both.
The student observed stomata on the microscope slides using the high-power objective lens.
Outline a method the student could use to investigate the effect of the sucrose solutions in Table 1.1 on the width of stomata in the leaves of plantain lily.
Your method should be set out in a logical order and be detailed enough to allow another person to follow it.
Details of how to prepare the microscope slides should not be included.
Answer
- Calibrate the eyepiece graticule using a stage micrometer, at the same magnification (high-power objective) that will be used for the measurements.
- View each of the five microscope slides in turn under the high-power objective lens.
- Leave the piece of lower epidermis immersed in its sucrose solution for the same length of time (e.g. 5 minutes) before taking measurements, so that osmosis has time to occur.
- Measure the width of each stoma at its widest point using the calibrated eyepiece graticule.
- Repeat the measurement for at least 3 different stomata on each slide (i.e. for each sucrose concentration).
- Calculate the mean width of the stomata for each sucrose concentration.
- Safety: a scalpel/razor blade is used to remove the lower epidermis from the leaf — hazard; cuts to skin — risk; cut away from the hand, onto a hard surface such as a tile, and dispose of used blades in a sharps/glass bin — precaution.
See working
Background Concept
To compare how sucrose concentration affects the width of stomata, the experiment must be a fair test: only the sucrose concentration should vary, and the response (width) must be measured accurately and reliably. Three cornerstones of reliable measurement in microscopy are: (i) calibrating the eyepiece graticule using a stage micrometer at the same magnification, so that graticule divisions can be converted to or ; (ii) replication — measuring several stomata per condition so that anomalies can be averaged out; and (iii) a mean calculated for each condition. A complete plan must also address safety: identify a hazard, the associated risk, and a sensible precaution.
Understanding the Question
The student has already prepared five slides (one for each sucrose concentration plus distilled water), each with a piece of lower epidermis and a cover slip in place. The question explicitly excludes slide preparation, so we describe only what is done AFTER the slides are ready: how to obtain reliable, comparable measurements of stoma width under the microscope.
Approach
Design a method that:
- Uses every sucrose concentration from Table 1.1 (so the relationship can be seen).
- Keeps all other variables the same (controlled variables) — especially the immersion time.
- Uses a calibrated eyepiece graticule so measurements have units.
- Measures the width of each stoma at its widest point (the most reproducible feature).
- Replicates each measurement (≥3 stomata per concentration).
- Calculates a mean per concentration.
- Includes a complete hazard–risk–precaution safety statement.
Step-by-Step Reasoning
- Calibration: Before measuring, calibrate the eyepiece graticule using a stage micrometer at the same magnification that will be used. This converts graticule divisions into (or ).
- Use all concentrations: View each slide (the distilled water and the four sucrose solutions) in turn so that the full concentration range in Table 1.1 is tested.
- Control time: Leave each piece of epidermis immersed in its solution for the same length of time (e.g. 5 minutes) before measuring. This ensures all stomata are exposed to their solution for an equal period, so any difference in width is due to sucrose concentration, not immersion time.
- Measure at the widest point: Use the calibrated graticule to measure the width of each stoma at its widest point — a defined, reproducible measurement.
- Replication: Measure at least 3 different stomata on each slide (i.e. for each concentration). This allows anomalies to be identified and a mean to be calculated.
- Mean: Calculate the mean stomatal width for each sucrose concentration.
- Safety: A scalpel/razor blade is used to peel the lower epidermis from the leaf. The hazard is the sharp implement; the risk is cuts; the precaution is to cut away from the hand, onto a hard tile/board, and to dispose of blades in a sharps/glass bin.
Key Takeaways
- A fair test requires controlled variables, calibration, and replication.
- Eyepiece graticule calibration converts arbitrary divisions into real units.
- Replication + mean reduces the effect of random variation.
- Safety must specify hazard AND risk AND precaution.
Common Mistakes
- Measuring just one stoma per slide (no replication).
- Measuring at an arbitrary point on the stoma (rather than the widest).
- Not calibrating the graticule, so measurements have no units.
- Not standardising immersion time.
- Stating only the hazard or only the precaution (the mark scheme requires all three: hazard + risk + precaution).
- Describing slide preparation (which the question explicitly says NOT to include).
Things to Be Careful About
- The safety mark requires hazard AND risk AND precaution — e.g., 'sharp scalpel → cuts → cut away from the hand onto a tile'. Just naming a hazard ('glass slides') without a risk or precaution scores nothing.
- Mention 'eyepiece graticule calibration' explicitly; describing only how to measure is not enough.
- 'Use all sucrose concentrations' (or 'use all five microscope slides') is a separate mark point — do not assume it is implicit.
Predict the effect of increasing the sucrose concentration from 0.0% to 20.0% on the width of stomata in the leaves of plantain lily.
Explain your prediction.
prediction = ______
explanation = ______
Answer
- Prediction: as the sucrose concentration increases from 0.0% to 20.0%, the width of stomata decreases.
- Explanation: as the sucrose concentration increases, the water potential () of the solution surrounding the guard cells becomes more negative, establishing a water potential gradient from the inside of the guard cells (higher ) to the surrounding solution (lower ). Water therefore leaves the guard cells by osmosis (down the water potential gradient, from high to low water potential), so the guard cells become less turgid and the stoma between them closes — the stomatal width decreases.
Width of stomata decreases; water leaves guard cells by osmosis down a water potential gradient
Background Concept
Osmosis is the net diffusion of water across a selectively permeable membrane from a region of higher (less negative) water potential () to a region of lower (more negative) water potential. Guard cells are kidney-shaped cells that flank each stoma; their inner walls are thicker and less elastic than the outer walls. When guard cells take in water by osmosis they become turgid and bow outward, opening the stoma. When they lose water they become flaccid and the stoma closes. Pure water has a water potential of approximately ; adding solute lowers the water potential (makes it more negative).
Understanding the Question
The sucrose concentration around the guard cells is varied from 0.0% to 20.0%. As sucrose concentration increases, the water potential of the surrounding solution decreases (becomes more negative). We must predict what this does to stomatal width and explain it in terms of osmosis in the guard cells.
Approach
- State the predicted trend (direction of change in stoma width with increasing sucrose).
- Explain using water potential: water moves from high to low , so increasing external solute concentration reverses the gradient and water leaves the guard cells.
- Link the loss of water to guard-cell turgor and therefore to stoma width.
Step-by-Step Reasoning
- Distilled water (0% sucrose) has — the highest water potential of all five solutions.
- Adding sucrose lowers . So as sucrose concentration rises from 0% → 2.5% → 5% → 10% → 20%, the surrounding becomes progressively more negative.
- Inside the guard cells, is initially higher (less negative) than outside the more concentrated sucrose solutions.
- Water therefore leaves the guard cells by osmosis, down the water potential gradient (from higher inside the guard cells to lower outside).
- As guard cells lose water, they become less turgid (flaccid).
- With reduced turgor, the guard cells no longer bow outward, so the stoma between them closes — the width of the stoma decreases.
- Prediction: as sucrose concentration increases from 0.0% to 20.0%, the width of stomata decreases.
Key Takeaways
- Increasing external solute concentration lowers external water potential.
- Water moves by osmosis from a region of higher to lower .
- Guard-cell turgor controls stomatal aperture.
- The link is: ↑ sucrose → ↓ external → water leaves guard cells → ↓ turgor → ↓ stomatal width.
Common Mistakes
- Saying 'water enters the guard cells' (wrong direction for concentrations above that of the cell sap).
- Saying the stomata 'open more' or 'widen' (opposite of correct).
- Not mentioning guard cells specifically.
- Not mentioning osmosis or a water potential gradient (these are essential terms).
- Confusing water potential with solute potential or pressure potential.
Things to Be Careful About
- The explanation must match the prediction: if you predict 'decreases', you must explain that water leaves the guard cells (or enters less), NOT that it enters more.
- Use the precise term 'osmosis' (not just 'movement of water').
- Use the precise term 'water potential gradient' (and you can add 'from high to low water potential').
Another piece of lower epidermis from a leaf of plantain lily was immersed in a large drop of distilled water on a microscope slide.
Fig. 1.3 shows the lower epidermis viewed using the low-power objective lens.
The student determined the stomatal density on the lower epidermis using Fig. 1.3 only.
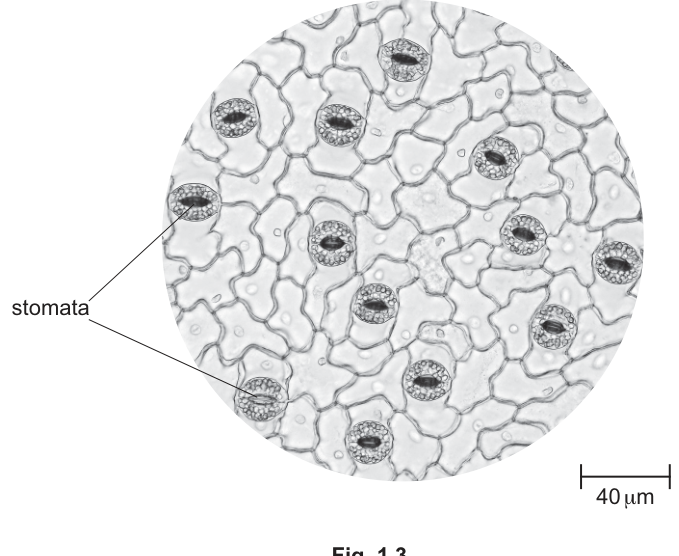
Fig. 1.3
Use Fig. 1.3 to calculate the stomatal density on the lower epidermis.
Use the equation:
Give your answer to the nearest whole number and show your working.
stomatal density = ______
Working
-
Count stomata in Fig. 1.3: 13 stomata.
-
Calibrate using the scale bar:
- Scale bar: (actual) = (image) = (image).
- Magnification:
-
Image dimensions of the field of view:
- Diameter = = .
- Radius = .
-
Convert to actual dimensions:
- Real radius = .
-
Calculate the actual area of the field of view:
-
Calculate stomatal density:
Answer
Stomatal density
367 mm⁻²
Background Concept
Stomatal density is the number of stomata per unit area of epidermis, usually expressed in . To calculate it from a micrograph, you need to (1) count the stomata in a known area and (2) determine the actual (real) area represented by the micrograph, using the scale bar to convert image measurements into real measurements.
The relationship between image size and actual size is given by the magnification:
From this, real size = image size ÷ magnification, and real area = image area ÷ magnification².
For a circle, .
Understanding the Question
Fig. 1.3 shows the lower epidermis of a plantain lily under the low-power objective, with a scale bar representing . The circular field of view has a diameter of approximately on the printed page. We must:
- Count the stomata visible in Fig. 1.3.
- Calculate the actual area of the field of view using the scale bar.
- Divide the count by the area to get stomatal density in .
The question supplies and asks for the answer to the nearest whole number.
Approach
Step 1 — Count: Count every stoma visible in the field of view.
Step 2 — Calibration: Use the scale bar ( on the page) to find the magnification, then convert the image diameter to a real diameter.
Step 3 — Area: Calculate the real area of the field of view (, in ).
Step 4 — Density: Divide the count by the real area.
Step-by-Step Reasoning
Count stomata: There are 13 stomata visible in Fig. 1.3.
Calibrate using the scale bar: The scale bar represents in reality and measures on the page. Magnification:
Convert the field-of-view diameter to real size:
Calculate real area:
Calculate stomatal density:
Alternative quick method: convert the scale bar to a conversion factor directly:
- , so on the page = in reality.
- Real diameter = actual — same answer as above.
Key Takeaways
- Stomatal density = count ÷ actual area.
- The scale bar is used to find magnification (image size ÷ actual size) so that image measurements can be converted to real measurements.
- A short cut is to use the scale bar to find a conversion factor (e.g. '1 mm on the page = 2.5 in reality') and apply it directly to the field-of-view diameter.
- Magnification is squared when going from a linear dimension to an area.
Common Mistakes
- Forgetting to convert image area into real area (using the raw image area in gives a meaningless density).
- Using the scale-bar length itself () as the diameter of the field of view.
- Mixing and (e.g. quoting the density as '0.367 ').
- Forgetting to square the magnification when converting area.
- Counting some stomata twice or missing those near the edge of the field.
- Not showing the magnification calculation (this is a separate mark point).
Things to Be Careful About
- Quote the unit as (per square millimetre) — the question asks for this specifically.
- Showing the magnification calculation explicitly earns a mark.
- The answer rounds to 367 (not 366 or 368) — make sure to round, not truncate.
Suggest how this investigation could be improved to increase confidence in your answer in (b)(i).
Answer
Use more than one field of view (or more than one microscope slide / piece of epidermis / leaf) to count stomata and calculate a mean stomatal density.
Use more than one field of view / slide / piece of epidermis / leaf and calculate a mean
Background Concept
A single measurement is not necessarily representative of the whole population — there may be variation across the leaf. Replication at a larger scale (different field of view, different piece of epidermis, different slide, or different leaf) and taking a mean averages out random variation and gives a more reliable, representative value.
Understanding the Question
The student's stomatal density in (b)(i) was calculated from just one field of view (Fig. 1.3). The question asks for a single improvement that would increase confidence in that answer.
Approach
Suggest replicating the count at a larger scale than a single field of view — e.g. several fields of view, several slides, several pieces of epidermis, or several leaves from the same plant — and then calculate a mean.
Step-by-Step Reasoning
- The density in (b)(i) is based on 13 stomata in a single field of view — a small sample from a single area of a single leaf.
- Different areas of the same leaf, and different leaves of the same plant, may have slightly different stomatal densities due to natural variation and developmental differences.
- To be more confident that the calculated value is representative, repeat the count on several fields of view (or several slides, pieces of epidermis, or leaves) and calculate a mean stomatal density.
- More repeats give a more reliable answer.
Key Takeaways
- Confidence in a result increases with the size and number of the samples measured.
- Replication can be at the level of the field of view, slide, piece of epidermis, or leaf.
- A mean should be calculated from the replicates.
Common Mistakes
- Vague answers such as 'be more careful' or 'do it again' — these don't identify what to replicate.
- Suggesting controls — irrelevant when the question is about reliability of a measurement.
- Mentioning different plants without specifying that it must be the same species.
Things to Be Careful About
- The improvement must specify WHAT is being replicated (field of view, slide, epidermis, leaf) and ideally include calculating a mean.
A different plant species had a lower stomatal density than the value calculated for plantain lily in (b)(i).
Suggest how the environmental conditions of the different plant species may vary from those of the plantain lily.
Explain your answer.
Answer
The different plant species is likely to live in conditions that would otherwise cause excessive transpiration, so it has fewer stomata to reduce water loss:
- Drier / more arid / lower water availability — fewer stomata reduce water loss by transpiration.
- Higher temperature / warmer / hotter — fewer stomata reduce water loss that would otherwise be increased by faster evaporation.
- Windy / higher wind speed — fewer stomata reduce water loss that would otherwise be increased by the removal of the humid boundary layer next to the leaf.
- Lower humidity / drier air — fewer stomata reduce water loss driven by the steeper water potential gradient from the leaf to the drier air.
(Any two of the above condition–explanation pairs earn full marks.)
Drier / higher temperature / windier / lower humidity — fewer stomata reduce water loss by transpiration
Background Concept
Stomata are pores that allow to enter the leaf for photosynthesis, but they also let water vapour escape by transpiration. The rate of transpiration is driven by the water potential gradient between the inside of the leaf and the surrounding air, and is increased by:
- higher temperature (faster evaporation),
- lower humidity (a steeper gradient to the drier air),
- higher wind speed (removing the humid boundary layer next to the leaf).
Plants that live in environments where transpiration would be very high (dry, hot, windy, low humidity) are often adapted by having fewer stomata to conserve water.
Understanding the Question
A different species has a lower stomatal density than the plantain lily. The question asks us to suggest how its environmental conditions may differ, and to explain the link.
Approach
List environmental factors that would increase transpiration (and thus select for fewer stomata), and explain the link for at least one. The mark scheme requires the condition AND the explanation for each mark — 'just listing conditions without the link to water loss scores nothing.
Step-by-Step Reasoning
- Drier / more arid / lower water availability → less water available to replace what is transpired. Fewer stomata reduce water loss.
- Higher temperature / warmer / hotter → increases the rate of evaporation from the leaf surface, increasing transpiration. Fewer stomata reduce this loss.
- Windy / higher wind speed → removes the still, humid boundary layer of air next to the leaf, steepening the water potential gradient and increasing transpiration. Fewer stomata reduce loss.
- Lower humidity / drier air → steeper water potential gradient between the leaf interior and the air, so faster transpiration. Fewer stomata reduce loss.
Each of these is a plausible environmental condition for a plant with lower stomatal density, and the explanation is the same: it reduces water loss by transpiration.
Key Takeaways
- Stomatal density is a balance between the need for uptake and the need to conserve water.
- Conditions that increase transpiration select for fewer stomata (or sunken stomata, or other adaptations such as a thicker waxy cuticle).
- The link must explicitly mention water loss / transpiration for the explanation mark.
Common Mistakes
- Listing environmental conditions that increase photosynthesis (e.g. higher light, more ) — these would predict MORE stomata, not fewer.
- Stating the condition without an explanation (the mark scheme requires the explanation link).
- Vague answers like 'different habitat' without naming the specific factor.
- Saying 'no water' or 'a desert' — extremes that few plants tolerate; 'drier / arid' is the safer wording.
Things to Be Careful About
- The question asks for the condition AND the explanation — both are needed for the marks.
- Make sure the explanation matches a lower stomatal density: the link is always 'so that less water is lost by transpiration'.
Scientists investigated the effect of abscisic acid (ABA) on reducing water loss in plants. The scientists predicted that ABA, as well as stimulating stomatal closure, also reduces water loss in plants in other ways.
The scientists used a mutant variety of thale cress, Arabidopsis thaliana, that has stomata that do not respond to ABA. When ABA is present, the stomata of the mutant variety remain open.
The scientists sprayed different concentrations of ABA on the leaves of the mutant variety and measured the transpiration rates of the plants.
The results are shown in Fig. 2.1.
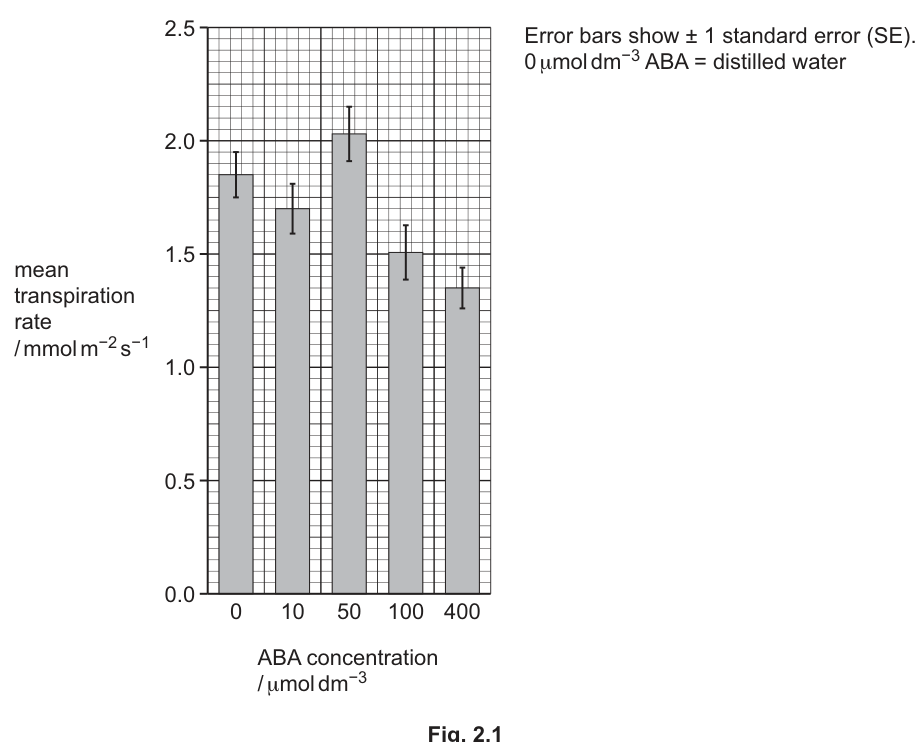
Fig. 2.1
Calculate the percentage decrease in transpiration rate from 0 to of ABA for the mutant variety.
Show your working.
percentage decrease = ______
Working
Answer
27%
27%
Background Concept
A percentage decrease expresses a fall in a quantity relative to its original (starting) value, scaled to 100. It allows fair comparison of changes that start from different baselines, and is widely used in biology to summarise experimental results (e.g. transpiration rate, enzyme activity, growth rate).
The general formula is:
For a percentage decrease, the new value is smaller than the original, so the answer is positive. Always quote the answer with appropriate significant figures — usually limited by the least precise value used in the calculation.
Understanding the Question
You are given a bar chart (Fig. 2.1) showing the mean transpiration rate of a mutant Arabidopsis thaliana variety (whose stomata do not close in response to ABA) sprayed with five different ABA concentrations: 0, 10, 50, 100 and 400 µmol dm⁻³. The 0 µmol dm⁻³ bar corresponds to distilled water (a control).
You need to find the mean transpiration rates at the two extreme ABA concentrations (0 and 400 µmol dm⁻³) from the bar chart, then calculate the percentage decrease in transpiration rate between them.
Approach
- Read the height of the bar at 0 µmol dm⁻³: mmol m⁻² s⁻¹.
- Read the height of the bar at 400 µmol dm⁻³: mmol m⁻² s⁻¹.
- Substitute into the percentage decrease formula and evaluate.
Step-by-Step Reasoning
- The bar at 0 µmol dm⁻³ reaches the 1.85 line on the y-axis.
- The bar at 400 µmol dm⁻³ reaches the 1.35 line on the y-axis (halfway between 1.0 and 1.5, with a small line above 1.5; the top sits at 1.35).
- Difference: mmol m⁻² s⁻¹.
- Divide by the original value:
- Multiply by 100: , which rounds to .
The mark scheme accepts 27 (no need for the % sign in the answer line if the unit is indicated by the heading "percentage decrease").
Key Takeaways
- Percentage decrease = (original − new)/original × 100.
- Always quote the answer to a sensible number of significant figures — the data are given to 2 or 3 sig figs, so 27% (or 27.0%) is appropriate.
- Reading bar charts accurately requires lining up the top of the bar with the gridlines on the y-axis.
Common Mistakes
- Dividing by the new value (1.35) instead of the original value (1.85), which gives ~37% — wrong because the decrease is relative to where you started.
- Forgetting the ×100 step (giving 0.27 or 0.27% instead of 27%).
- Misreading the chart — note that 50 µmol dm⁻³ actually has the highest transpiration rate, not 0; only the 0 and 400 endpoints are needed here.
Things to Be Careful About
- Use the value at 0 µmol dm⁻³ as the original, because that is the control (no ABA) and the natural starting point.
- The mark scheme awards 1 mark for correctly identifying both bar heights and 1 mark for the final answer of 27 — so the working must show both readings.
With reference to Fig. 2.1, suggest conclusions that can be made about the effect of different concentrations of ABA on the transpiration rates of the mutant variety.
State the evidence that supports your conclusions.
Answer
-
As the concentration of ABA increases from 0 to 400 µmol dm⁻³, the mean transpiration rate decreases, except at 50 µmol dm⁻³ where the rate increases above the 0 µmol dm⁻³ value.
- Evidence: 0 = 1.85, 10 = 1.70, 50 = 2.05, 100 = 1.50, 400 = 1.35 mmol m⁻² s⁻¹.
-
The error bars for ABA concentrations of 10 and 50 µmol dm⁻³ overlap with the error bar at 0 µmol dm⁻³, so there is unlikely to be a significant difference in transpiration rate between these concentrations and 0.
- Evidence: the upper/lower limits of the error bars for 10 and 50 cross the range covered by the 0 µmol dm⁻³ error bar.
-
The error bars for 100 and 400 µmol dm⁻³ do not overlap with the error bar at 0 µmol dm⁻³, so there is likely to be a significant difference in transpiration rate between these concentrations and 0.
- Evidence: the top of the 0 µmol dm⁻³ error bar (~2.0) is below the bottom of the 100 error bar (~1.4) and the 400 error bar (~1.2).
Trend decreases with concentration (except at 50); overlapping error bars indicate no significant difference for 10/50 vs 0; non-overlapping error bars for 100/400 vs 0 suggest a significant decrease.
Background Concept
When biological data are presented as bar charts with error bars, the error bar represents the uncertainty around the mean (in this question, ±1 standard error, SE). A useful rule of thumb is:
- If two error bars overlap, the difference between the two means is unlikely to be statistically significant.
- If two error bars do not overlap, the difference is likely to be statistically significant.
This is a quick visual proxy, not a formal test — a proper statistical test (e.g. t-test) is needed to confirm significance, as required in part (c) of this question. Error bars of ±1 SE are narrower than 95% confidence intervals, so non-overlap of ±1 SE is a fairly conservative indicator of significance.
Understanding the Question
You have a bar chart of mean transpiration rate vs ABA concentration for a mutant Arabidopsis thaliana whose stomata do not close in response to ABA. You need to:
- Identify the trend in transpiration rate as ABA concentration changes.
- Use the error bars (±1 SE) to judge whether the differences between concentrations are likely to be statistically significant.
- State the evidence (numbers / overlap) that supports each conclusion.
The command word "suggest conclusions" means your answer must be reasoned, not just a description — link each conclusion to specific evidence from Fig. 2.1.
Approach
- Read the heights of all five bars.
- Describe the overall trend, noting the anomaly at 50 µmol dm⁻³.
- For selected pairs of bars, decide whether their error bars overlap.
- Conclude whether the difference between those pairs is likely to be significant or not.
Step-by-Step Reasoning
Heights of the bars (approximate):
| ABA conc. (µmol dm⁻³) | Mean transpiration rate (mmol m⁻² s⁻¹) |
|---|---|
| 0 | 1.85 |
| 10 | 1.70 |
| 50 | 2.05 |
| 100 | 1.50 |
| 400 | 1.35 |
Trend: Moving from 0 → 10 → 100 → 400 µmol dm⁻³, the mean rate falls from 1.85 to 1.70 to 1.50 to 1.35. However, at 50 µmol dm⁻³ the mean is 2.05 — higher than the 0 µmol dm⁻³ control. So the general trend is a decrease, but with an anomaly at 50.
Error bar analysis (overlap of ±1 SE):
- The 0 µmol dm⁻³ error bar spans roughly 1.75 to 2.00.
- The 10 µmol dm⁻³ error bar spans roughly 1.60 to 1.80 → overlaps with 0.
- The 50 µmol dm⁻³ error bar spans roughly 1.90 to 2.20 → overlaps with 0.
- The 100 µmol dm⁻³ error bar spans roughly 1.40 to 1.60 → does not overlap with 0.
- The 400 µmol dm⁻³ error bar spans roughly 1.20 to 1.50 → does not overlap with 0.
So the differences between 0 and 10, and between 0 and 50, are not likely to be significant; the differences between 0 and 100, and between 0 and 400, are likely to be significant.
(You could also note that the 100 µmol dm⁻³ error bar overlaps slightly with that of 400 µmol dm⁻³, so the difference between 100 and 400 may not be significant — but this is the same mark-point as the overlap with 0.)
Key Takeaways
- Error bars represent variability (here ±1 SE). Overlap ⇒ likely not significant; non-overlap ⇒ likely significant.
- Always pair a conclusion with its evidence (numerical heights or error-bar positions).
- Note anomalies in a trend — here, 50 µmol dm⁻³ breaks the otherwise-decreasing pattern.
Common Mistakes
- Saying only that "ABA reduces transpiration" without acknowledging the 50 µmol dm⁻³ anomaly.
- Treating error bars as if they always indicate a significant difference (overlap can mean the difference is not significant).
- Failing to give numerical evidence to support the conclusion (e.g. just saying "the error bars overlap" without saying which ones).
- Confusing the standard error (SE) with the standard deviation (SD) — the mark scheme specifies ±1 SE.
Things to Be Careful About
- ±1 SE is the standard error, not the 95% confidence interval, so the overlap rule is a guide rather than a strict test.
- The conclusion should mention what the evidence shows, not just "ABA reduces transpiration".
- Two marks are available — at least two well-evidenced conclusions are needed for full marks.
The scientists used a mutant variety of thale cress that has stomata that do not respond to ABA.
The scientists concluded that ABA reduces water loss in thale cress by ways other than stomatal closure.
Suggest additional information that is required to increase the confidence in this conclusion.
Answer
Any three of:
-
Data for the non-mutant (wild-type) variety of Arabidopsis thaliana is needed, so the effect of ABA on transpiration can be compared between mutant and wild-type plants. (If ABA still reduces transpiration in the mutant — which it appears to do — but has no extra effect in the wild-type beyond stomatal closure, this supports the conclusion that ABA acts via additional, non-stomatal mechanisms.)
-
A statistical test (e.g. a t-test) should be carried out on the data to determine whether the differences between ABA concentrations (especially 0 vs 100 and 0 vs 400 µmol dm⁻³) are statistically significant. Error-bar overlap is only a guide.
-
Information about the standardised variables (controlled variables) used in the experiment is needed, e.g. temperature, humidity, light intensity, air movement, plant age and size, volume of solution sprayed onto leaves, time of day, soil water content. This is necessary to ensure that transpiration differences are due to ABA and not to other environmental / plant factors.
-
Confirmation that water is also lost from parts of the plant other than the stomata — e.g. the cuticle (cuticular transpiration) or through lenticels — so that the conclusion that ABA acts via a non-stomatal route is biologically plausible.
Need wild-type data for comparison; need a formal statistical test; need to know which variables were standardised; need evidence that water can be lost from non-stomatal parts of the plant (cuticle / lenticels).
Background Concept
To draw a strong, well-supported conclusion from an experiment, three things are usually required:
- An appropriate control or comparison — so that the effect observed can be attributed to the treatment and not to chance or other factors.
- A statistical test — to determine whether the observed differences are likely to be real or due to random variation.
- Standardised (controlled) variables — to ensure that only the independent variable (here, ABA concentration) is changing, so any effect on the dependent variable (transpiration rate) can be confidently attributed to it.
The scientists' conclusion ("ABA reduces water loss by ways other than stomatal closure") is a specific, mechanistic claim. To support it, the experiment must rule out other explanations and provide a logical chain of evidence.
Understanding the Question
The scientists sprayed different concentrations of ABA onto a mutant Arabidopsis thaliana whose stomata do not close in response to ABA. They found that transpiration still fell as ABA concentration increased (Fig. 2.1). They concluded that ABA reduces water loss by mechanisms other than stomatal closure.
The question asks: what additional information would increase confidence in this conclusion?
You need to think about what is missing from the experiment as described, or what would strengthen the logic of the conclusion.
Approach
Consider each part of the experimental design and ask:
- Is there a missing comparison? (Yes — there is no non-mutant / wild-type control.)
- Is the analysis rigorous enough? (No — error bars are a guide, not a formal test.)
- Are all relevant variables controlled? (We are not told, e.g. temperature, light, humidity, plant age, volume sprayed.)
- Is the conclusion biologically plausible? (Yes, but only if there is a known alternative route for water loss — cuticle, lenticels.)
Pick three points from these (or related) categories.
Step-by-Step Reasoning
1. Wild-type data:
The mutant has stomata that do not respond to ABA, so any change in transpiration must be due to a non-stomatal mechanism. However, the magnitude of the change can only be put in context by comparing it to the wild-type. For example:
- If wild-type transpiration falls more than mutant transpiration at the same ABA concentration, this supports the conclusion that part of ABA's effect is via stomatal closure and part is via another mechanism.
- If wild-type transpiration falls by the same amount as mutant transpiration, this strongly supports the conclusion that ABA's entire effect is via non-stomatal mechanisms.
Without the wild-type data, the conclusion is harder to evaluate.
2. Statistical test:
Error bars of ±1 SE can give a rough visual indication of significance, but a proper test (e.g. unpaired t-test comparing two ABA concentrations, or one-way ANOVA across all five concentrations) is needed to determine the p-value and decide whether to reject the null hypothesis. This is especially important because the 50 µmol dm⁻³ result is anomalous, and we need to know whether it is a real effect or noise.
3. Standardised variables:
Transpiration is highly sensitive to environmental conditions. If temperature, humidity, light intensity, air movement, or the volume / method of spraying differed between treatments, the differences in transpiration could be due to those factors rather than ABA. Naming any specific controlled variable earns the mark. Typical examples:
- Temperature (kept constant in a controlled-environment cabinet).
- Humidity (kept constant).
- Light intensity / photoperiod (kept constant).
- Plant age and size (same developmental stage).
- Volume of solution sprayed (same for each plant).
4. Alternative route for water loss:
For ABA to reduce water loss by a non-stomatal mechanism, water must be able to leave the plant by a route other than the stomata. The two main routes are:
- Cuticular transpiration — water diffuses directly through the waxy cuticle on the epidermis. This is usually a small fraction of total transpiration but can be significant in young leaves or where the cuticle is thin / damaged.
- Lenticels — porous regions on woody stems that allow gas exchange; small amounts of water vapour can also escape here.
If the cuticle and lenticels were sealed, or if the plant is known to lose negligible water through these routes, the scientists' conclusion would be harder to support.
Key Takeaways
- Every conclusion in biology is only as strong as the controls, statistical analysis and standardised variables behind it.
- A "suggest" question requires you to identify what is missing or weak in the design, not just to repeat what was done.
- A conclusion about a mechanism is only credible if there is a biologically plausible alternative mechanism in the system being studied.
Common Mistakes
- Saying "more data is needed" or "use more replicates" without specifying what kind of data, why it is needed, or how it would help.
- Suggesting that the experiment be repeated at different temperatures or in different seasons — these are refinements, not directly relevant to the specific conclusion about non-stomatal water loss.
- Naming a controlled variable without saying how it would be controlled (the mark scheme just requires naming one, but the explanation should clarify why it matters).
- Confusing standardisation (keeping variables constant) with randomisation or replication.
Things to Be Careful About
- This is a 3-mark question — three distinct, well-articulated points are needed for full marks.
- The mark scheme's mark-points 3 and 4 are both "reference to a named standardised variable" — so any single named controlled variable is worth one mark; a second named variable is worth a second mark.
- Mark-point 5 specifically refers to water being lost from a named part of the plant (other than stomata) — the cuticle or lenticels are the expected answers.
Seeds of the common stork’s-bill, Erodium cicutarium, are shown in Fig. 3.1.
The awn is an extension on the E. cicutarium seed. The seed uses the awn to push the seed head into the soil to allow the seed to germinate. The awn changes shape when the humidity changes.
Humidity is the concentration of water vapour in the air. The higher the humidity, the higher the concentration of water vapour in the air.
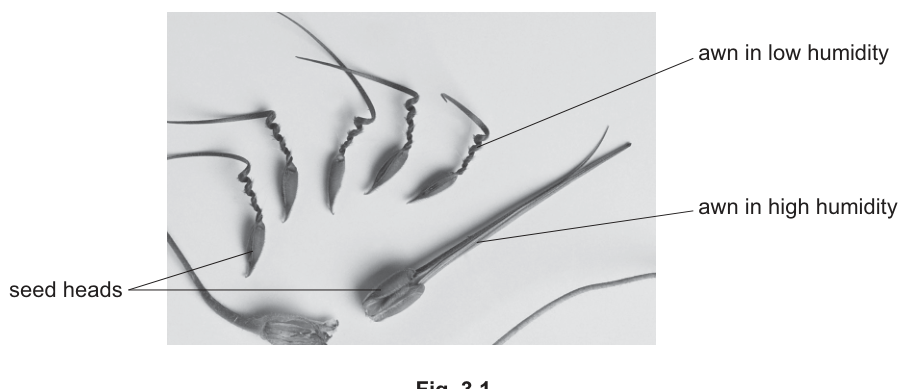
Fig. 3.1
A student investigated the effect of humidity on the appearance of the awn.
The student set up the apparatus as shown in Fig. 3.2.
Water can be added to the filter paper to change the humidity in the beaker surrounding the seed. Increasing the volume of water added to the filter paper increases the humidity.
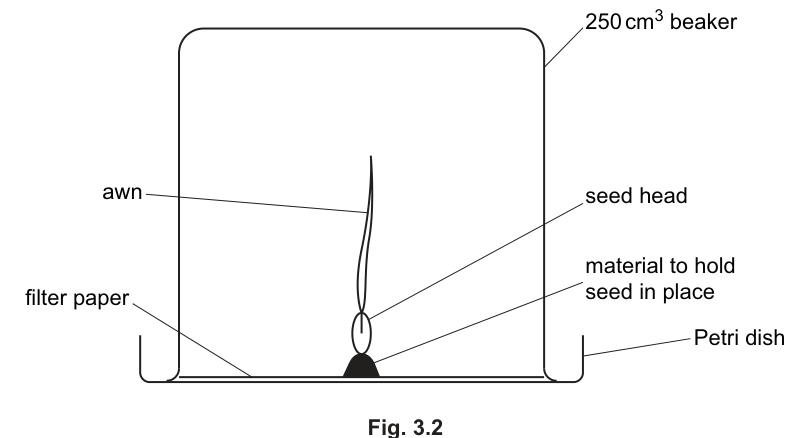
Fig. 3.2
State two variables the student would need to standardise for the investigation using the apparatus shown in Fig. 3.2.
Answer
Any two from:
- Age of the seeds
- Initial state of the awn (all straight or all coiled at the start)
- Temperature
- Light intensity (e.g. carry out in a dark room)
- Time the seeds are left in the different humidities before being measured
- Type / size / thickness / absorbency of the filter paper
Two variables, e.g. age of the seeds and temperature.
Background Concept
Erodium cicutarium (common stork's-bill) produces seeds with long, thin extensions called awns. These awns are hygroscopic — they change shape in response to humidity. In dry air the awn coils into a tight spiral; in humid air it straightens and untwists. The movement is caused by differential swelling and shrinking of cell-wall layers in the awn as they absorb or lose water. Its biological function is dispersal and self-burial: as humidity fluctuates between night and day, the coiling–uncoiling cycle acts like a ratchet that drives the sharp seed head down into the soil.
Because the awn responds to water in the air, anything else in the apparatus that affects the awn's water content — temperature, light, or how long the seed sits in a given humidity — will confound the result. A valid investigation must keep these factors the same in every trial so that any change in the awn's appearance can be attributed to humidity alone.
Understanding the Question
Part (a) asks for two variables the student must keep constant. The apparatus in Fig. 3.2 is a 250 cm³ beaker inverted over a Petri dish, with the seed held upright on a small amount of material and a piece of filter paper at the base onto which water can be added. The student is changing humidity by adding different volumes of water to the filter paper. Anything else that could affect the awn's appearance needs to be standardised.
The command word is state, so the answer only needs to name the variables — no explanation is required to earn the marks.
Approach
Look around the experiment in your head. The independent variable is the volume of water added to the filter paper (which changes humidity). The dependent variable is the appearance of the awn. Everything else in the system that could influence the awn is a candidate for standardisation. Mentally go through: the seed itself, the environment inside the beaker, the filter paper, and the time-scale of the measurement.
Step-by-Step Reasoning
- Age of the seeds — older seeds may have less responsive awns, or different starting shapes, so all seeds used should be of the same age.
- Initial state of the awn — at the start, every awn should be in the same condition (either all straight or all coiled) so that any change observed is due to the humidity, not to a different starting point.
- Temperature — temperature affects how quickly water evaporates from the filter paper (and therefore the humidity) and can also directly affect the awn's hydration, so the investigation should be carried out at a constant temperature.
- Light intensity — light (especially from a lamp) can heat the apparatus and alter humidity, so all trials should be done at the same light intensity, or in a dark room.
- Time the seeds are left in the different humidities — the awn does not change shape instantly; it needs time to respond. Leaving each seed for the same length of time before recording the appearance ensures a fair comparison.
- Type / size / absorbency of the filter paper — a thicker or more absorbent filter paper will hold more water and give a different humidity for the same volume added, so the same filter paper should be used in every trial.
Any two of these earn the two marks.
Key Takeaways
- A controlled experiment varies the independent variable and keeps everything else constant so that changes in the dependent variable can be attributed to the independent variable.
- For a hygroscopic awn the relevant confounders are anything that affects the water content of the awn: temperature, time in the humidity, and starting state, plus the seed's age.
- "Standardise" means keeping the variable the same across all trials — not necessarily the same value as in the surrounding environment, but the same value in every trial of the experiment.
Common Mistakes
- Listing the independent variable (volume of water / humidity) — this is the variable the student deliberately changes, not a variable to standardise.
- Listing the dependent variable (appearance of the awn) — this is what is measured, not what is standardised.
- Suggesting "amount of water" as a control, when the question already says the student adds different volumes of water to vary humidity.
- Naming variables that cannot be controlled in this apparatus (e.g. atmospheric pressure, wind).
Things to Be Careful About
- The mark scheme offers six alternative variables; the candidate only needs to state any two of them clearly. Writing more than two is fine provided each is a valid answer.
- "Age" must refer to the age of the seed (or the age of the plant the seed came from), not the time the seed has been in the apparatus.
- "Type of filter paper" is a standardising variable; "volume of water on the filter paper" is the independent variable.
Outline a method the student could use to measure the effect of different levels of humidity on the appearance of the awn, using the apparatus in Fig. 3.2.
Do not include standardised variables from (a) or a risk assessment.
Answer
- Add different volumes of water to the filter paper in different trials (e.g. 0, 1, 2, 3, 4, 5 cm³) to give a range of humidities.
- Leave one filter paper with no water added as a control (lowest humidity).
- After a set time, measure / record the appearance of the awn (e.g. the number of coils, or how straight / curled it is).
- Repeat the experiment at each humidity to obtain reliable results.
Vary the volume of water on the filter paper (including a no-water control), record the appearance of the awn, and repeat each humidity.
Background Concept
The awn of Erodium cicutarium responds to humidity by coiling and uncoiling. To test the effect of humidity experimentally, the student must expose the seed to a range of humidities, observe the response, and include a control and repeats.
In this set-up humidity is altered indirectly by adding different volumes of water to the filter paper lining the Petri dish. More water on the filter paper gives a higher water-vapour concentration inside the sealed beaker, and so a higher humidity. Zero water gives the lowest, baseline humidity. A control (no water) allows the appearance of the awn at "ambient" humidity to be compared with the appearance at higher humidities.
Understanding the Question
Part (b) asks the student to outline, in brief, a method for using the Fig. 3.2 apparatus to investigate the effect of humidity on the awn. The student has already been asked in (a) to state variables to standardise, so the question explicitly tells the candidate not to repeat those standardised variables in (b). The marks are for the procedural steps that vary humidity, measure the response, and ensure reliability.
The command word is outline — the answer should be a brief description of the procedure, not a fully detailed protocol. Three marks are available, so three distinct ideas should be given.
Approach
Think about the four logical components of any experimental procedure:
- Vary the independent variable — the volume of water added to the filter paper.
- Include a control — leave one filter paper with no water added.
- Measure the dependent variable — record the appearance of the awn.
- Reliability — repeat for each humidity.
These four points correspond directly to the four alternative marking points in the mark scheme, and any three will earn full marks.
Step-by-Step Reasoning
- Different volumes of water — the independent variable is changed by adding different volumes of water to the filter paper. A sensible range would span from no water up to enough to saturate the paper (for example 0, 1, 2, 3, 4, 5 cm³). This is the variation in the independent variable.
- No-water control — leaving one filter paper with no water added provides the lowest humidity in the experiment and acts as a control against which the higher-humidity treatments can be compared. Without this, the student cannot say whether the awn would have remained straight or coiled at the lowest humidity.
- Measuring the appearance of the awn — the appearance (e.g. number of coils, or a qualitative description such as "tightly coiled", "partially coiled", "straight") is the dependent variable. The student must record this after a set time so that the result can be compared between trials.
- Repeating each humidity — repeats at each humidity give several readings, allowing the student to spot anomalies and to be more confident that any pattern observed is real and not the result of chance variation between individual seeds.
Key Takeaways
- A valid experiment varies the independent variable across a range, includes a control, measures the dependent variable, and is repeated for reliability.
- In this apparatus, the independent variable is the volume of water on the filter paper, and the dependent variable is the appearance of the awn.
- A "control" does not have to be a separate experiment — leaving one of the treatments with no water added provides the control in this set-up.
- The student does not need to include standardised variables in (b) because they have already been credited in (a).
Common Mistakes
- Repeating variables from (a) (such as "keep temperature constant") — the question explicitly excludes these.
- Including a risk assessment — the question also excludes this, and there is no obvious hazard in the procedure anyway.
- Not including a control (the no-water trial) — without this, the student has no baseline for the appearance of the awn at low humidity.
- Failing to describe how the appearance is measured — "observe the awn" is too vague; the student should say what is being recorded (e.g. number of coils, photograph for later comparison).
- Using only two or three different volumes and not repeating — a single trial at each humidity does not allow the student to assess reliability.
Things to Be Careful About
- The question says "outline a method"; a long step-by-step protocol is not required. Three or four clear sentences covering the variation, the control, the measurement and the repeats are sufficient.
- "Different volumes of water" is the variation; the student should make it clear that several different volumes are used, not just one.
- "Repeat for each humidity" is the reliability point. The mark scheme does not require a specific number of repeats, but at least two repeats per humidity is the minimum for a mean.