Biology 9700/51 — October/November 2025
Cambridge A-Level · Planning, Analysis and Evaluation · worked solutions for every part, with the mark scheme
Topics Planning · Analysis, Conclusions and Evaluation
Juglone is a chemical produced by plants in the genus Juglans, which includes different species of walnut tree.
Fig. 1.1 shows a black walnut tree.
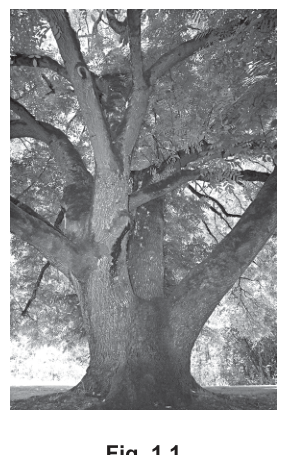
Juglone produced by a black walnut tree can diffuse into the soil surrounding the tree.
Groups of scientists have observed that juglone affects different species of plant growing close to black walnut trees.
Juglone can reduce the percentage of seeds that germinate, delay the start of germination or reduce growth. In some studies, juglone has no effect on germination or growth.
A student planned to investigate the effect of juglone on the cucumber plant, Cucumis sativus.
In the investigation, the student:
- placed some damp soil containing juglone in a tray
- added some cucumber seeds to the soil
- placed the container in a suitable environment for germination and growth.
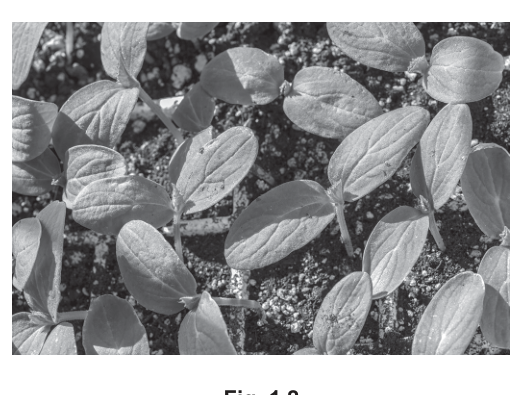
Fig. 1.2 shows cucumber seedlings (young plants) a few days after germination.
The student planned to compare the effect of exposing cucumber seeds to:
- juglone solution with a concentration of , which is a concentration that has been measured in soils surrounding black walnut trees
- a control treatment.
The student planned to determine:
- the percentage of cucumber seeds that germinated in soil
- the growth of each cucumber seedling 10 days after the appearance of the seedling above the soil.
Answer
The independent variable is the (presence of) juglone at a concentration of compared to the control (absence of juglone). AW: concentration of juglone.
(Presence of) juglone (at ) and control (absence of juglone)
Background Concept
The independent variable (IV) is the factor that an investigator deliberately changes (or sets up as different conditions) between treatment groups in order to test its effect on the dependent variable. It is distinct from the dependent variable (what is measured) and control variables (factors kept the same to ensure a fair test).
Understanding the Question
The stem describes a comparison between cucumber seeds exposed to a juglone solution at and a control treatment. The question asks the candidate to name what differs between these two groups - that is the IV.
Approach
Identify what is being deliberately changed between the two named treatments. In a valid controlled experiment only one variable should differ at a time, so the IV is simply the binary comparison: juglone vs no juglone, at the stated concentration.
Step-by-Step Reasoning
The plan names two treatments: juglone solution (at ) and a control treatment (no juglone). The presence (or absence) of juglone at the stated concentration is therefore the independent variable. The mark scheme also accepts "concentration of juglone" as equivalent wording.
Key Takeaways
- The IV is what is deliberately changed between treatment groups.
- Stating the IV clearly requires naming BOTH conditions being compared.
Common Mistakes
- Confusing the IV with a dependent variable (e.g. percentage germination or growth).
- Naming "juglone" alone without specifying the control comparison.
Things to Be Careful About
Either phrasing earns the mark: "(presence of) juglone at the stated concentration and the control (absence of juglone)" OR "concentration of juglone". Just naming "juglone" alone is not sufficient.
Juglone solutions are prepared using a mixture of solvents.
The student was provided with:
- a juglone solution with a concentration of
- the mixture of solvents.
Using the solution provided, the student prepared a juglone solution with a volume of and a concentration of .
The student carried out 1 dilution to prepare the solution using measuring cylinders.
State the volumes that the student used to carry out the dilution to produce of juglone solution.
Working
The dilution factor = .
Answer
of the juglone solution and of the solvent mixture.
of juglone and of solvent mixture
Background Concept
A dilution is calculated using , where is concentration and is volume. To make a working solution from a more concentrated stock, a small volume of stock is added to a larger volume of diluent (the solvent mixture here) so that the final volume and concentration match the target. The dilution factor () tells you the ratio of stock to total final volume.
Understanding the Question
The student has juglone stock and needs to make of juglone solution in a single dilution, using measuring cylinders. The question asks for the volumes used.
Approach
Apply :
- (stock)
- (final)
- (final volume)
Solve for . The remainder of the is solvent.
Step-by-Step Reasoning
So of the juglone stock is required, plus of the solvent mixture, to make the final volume up to at the target concentration.
Key Takeaways
- The dilution equation is the standard tool for working out dilution volumes.
- The dilution factor (here 100-fold) tells you the ratio of stock to total final volume.
- The diluent (solvent) volume = final volume − stock volume.
Common Mistakes
- Forgetting that the final volume is fixed at and adding the stock ON TOP of the solvent.
- Using the wrong dilution factor (e.g. 10-fold instead of 100-fold, because of misreading the powers of ten).
- Misplacing decimal points on the concentrations.
Things to Be Careful About
State both volumes clearly with correct units and the qualifier ( juglone / solvent mixture) so that the two volumes cannot be confused.
Outline one improvement the student could make to reduce the percentage error while carrying out the dilution.
Answer
Use a graduated / volumetric pipette, syringe, micropipette or burette (instead of a measuring cylinder) to measure the smaller volume of juglone more accurately. AW: use a volumetric flask to make up to the final volume. AW: use larger volumes of both juglone solution and solvent.
Use a (graduated) pipette / syringe / burette / volumetric flask / larger volumes
Background Concept
Percentage error is inversely related to the precision of the apparatus used. Percentage error = (absolute apparatus error ÷ measured value) × 100. Measuring cylinders typically have an absolute error of ±0.5 to ±1 cm³, whereas a graduated pipette, burette, or volumetric glassware has a much smaller absolute error. Because the same absolute error is a smaller proportion of a larger volume, simply using larger volumes also reduces the percentage error.
Understanding the Question
The stem states that the student used measuring cylinders to perform the dilution. The question asks for ONE improvement that would reduce the percentage error.
Approach
Either: switch to more precise apparatus (a graduated pipette, syringe, micropipette or burette to measure the small juglone volume; a volumetric flask to make up to the mark), OR scale up both volumes so that the apparatus error is a smaller fraction of the measured value.
Step-by-Step Reasoning
A measuring cylinder measuring 5 cm³ has a typical error of ±0.5 cm³, i.e. about 10% error. A graduated pipette or burette can measure 5 cm³ with an error of ±0.05 cm³, i.e. about 1% error. Alternatively, doubling the scale (preparing 1000 cm³ instead of 500 cm³) halves the percentage error from the apparatus.
Key Takeaways
- Smaller-volume measurements need more precise apparatus.
- Percentage error = (absolute error ÷ measured value) × 100.
- Volumetric glassware is more accurate than measuring cylinders.
Common Mistakes
- Suggesting "use a measuring cylinder" (the apparatus already used).
- Naming apparatus without any link to reducing percentage error.
- Listing several improvements when the question asks for ONE.
Things to Be Careful About
The question asks for one improvement only, not many. State it clearly and identify which stage of the dilution (measurement of stock, or making up to volume) it improves.
State a suitable control that the student could use, and explain why the student decided to include a control in the investigation.
control ______
explanation ______
Answer
Control: the same volume of the solvent mixture, with no juglone added.
Explanation: so that any effects observed (on the germination or growth of the seeds) can be attributed to the juglone, rather than to the solvent or other factors.
Solvent mixture only (no juglone); to show that any effects are due to juglone and not the solvent
Background Concept
A control is a treatment that lacks the factor under investigation but is otherwise identical to the experimental treatment. It is run alongside the experimental group so that the effect of the independent variable can be isolated from confounding factors such as the solvent, the apparatus, or the environmental conditions.
Understanding the Question
The student compares cucumber seeds in juglone solution against a "control treatment". The question asks what that control should be and why it is included.
Approach
The control must differ from the juglone treatment by ONLY the juglone. Because juglone is dissolved in a solvent mixture, the solvent mixture alone (with no juglone) is the correct control. The purpose of the control is to confirm that any difference in outcome is caused specifically by the juglone.
Step-by-Step Reasoning
Running the solvent mixture alone alongside the juglone treatment allows the student to confirm that any differences in germination percentage or seedling growth are caused by juglone and not by the solvent, the volume of liquid added, the soil, or the environmental conditions. Without this comparison, any observed difference could not be confidently attributed to juglone.
Key Takeaways
- A control must differ from the experimental treatment by ONLY the independent variable.
- The control provides the baseline against which the experimental treatment is compared.
- In this case, the correct control is the solvent mixture alone - NOT pure water, because the solvent itself could affect germination.
Common Mistakes
- Suggesting "water" or "no treatment" rather than the solvent mixture (since juglone is dissolved in a solvent mixture, the solvent alone is the correct control).
- Stating the reason vaguely as "to compare" without explaining that the control isolates juglone as the cause.
Things to Be Careful About
The control must include the same solvent mixture (without juglone), not pure water, because the solvent itself could influence germination. The control volume and conditions should also be matched to those of the juglone treatment.
Describe a method the student could use to investigate the effect of juglone on:
- the percentage of cucumber seeds that germinate
- the growth of each cucumber seedling 10 days after the appearance of the seedling above the soil.
The description of your method should be set out in a logical way and be detailed enough for another person to follow.
Answer
-
Preparing the trays. Place the same mass/volume of the same damp soil in two identical trays. To one tray add the of juglone solution; to the other add of the solvent mixture only (control).
-
Sowing the seeds. Sow the same number (e.g. 50) of cucumber seeds of the same species/variety and similar size into each tray, at the same depth and spacing.
-
Standardising conditions. Place both trays in the same location with the same temperature (e.g. in an incubator set at , or in the same room with a thermometer), the same light intensity and photoperiod (e.g. the same window or under the same lamp on the same timer), and the same watering regime (equal volume of water at fixed intervals).
-
Maintaining exposure. Reapply the same volume of the appropriate solution (juglone or solvent) to each tray at regular intervals (e.g. every 2 days) so the seedlings remain exposed to juglone after germination.
-
Measuring germination. After a fixed/stated time interval (e.g. 7 days), count the number of seeds that have germinated in each tray and calculate the percentage germination for each treatment.
-
Measuring growth. At 10 days after each seedling appears above the soil, measure the height of each seedling (from soil level to the tip of the longest leaf) using a ruler, and record the measurement in cm. Calculate the mean height for each treatment.
-
Replication. Repeat the whole investigation at least twice more with fresh seeds and fresh trays to provide replicate means and check for anomalies.
-
Safety. Juglone and the solvent mixture are irritant/toxic - wear gloves and a mask when preparing solutions; soil may contain pathogens - wear gloves when handling and wash hands afterwards.
See working
Background Concept
A valid comparison requires standardisation of all variables except the independent variable. Here there are two measurable outcomes (percentage germination and seedling growth) and the method must include replicates, controlled conditions, defined endpoints, and safety considerations for any chemical hazard.
Understanding the Question
The student needs a detailed method, set out logically and in enough detail for another person to follow, that tests the effect of juglone on (i) the percentage of cucumber seeds that germinate and (ii) the growth of each seedling 10 days after the seedling appears above the soil. Marks are available for standardisation, control of variables, replication, the measurement procedure, and a hazard/risk/precaution safety statement.
Approach
Structure the method in the order in which it would be carried out:
- Preparation of the treatment trays.
- Standardisation (same seeds, same volume/concentration of solutions, same soil mass, same conditions).
- Maintenance (reapply juglone so exposure continues).
- Measurement of germination percentage.
- Measurement of growth at 10 days.
- Replication and means.
- Safety.
Step-by-Step Reasoning
- Standardising exposure: Use the same mass/volume of the same soil in identical trays; sow the same number of cucumber seeds of the same variety and similar initial size; add the same volume () of solution to each tray. This ensures both groups start from the same baseline.
- Same seeds: Use the same species/variety, same age, same size of cucumber seeds in both trays so that any difference in outcome cannot be due to seed quality.
- Constant temperature: Place both trays in the same environment at the same temperature, ideally in an incubator or a controlled-temperature room (or at least in the same room, monitored with a thermometer).
- Constant light intensity: Place both trays under the same light source for the same photoperiod, so photosynthesis and growth are not differentially affected.
- Another standardised variable: Equal watering (same volume at the same intervals), same planting depth, same spacing of seeds.
- Reapply juglone after germination: The original will be exhausted as the plant grows. To maintain the experimental exposure, reapply the same volume of the appropriate solution (juglone to the experimental tray, solvent to the control) at stated intervals during the 10 days.
- Counting germination: After a fixed/stated time, count the number of seeds that have germinated (cotyledons visible above soil) out of the total sown in each tray, and calculate percentage germination.
- Measuring growth at 10 days: Use a ruler to measure the height of each seedling from soil level to the tip of the longest leaf, 10 days after that seedling emerged above the soil. Record measurements (cm) and calculate the mean for each treatment.
- Large sample + mean: Use a large number of seeds in each tray (e.g. 50) so that a meaningful mean can be calculated and anomalies are detectable. Repeat the whole experiment at least once more with fresh seeds to obtain replicate means.
- Safety: Juglone and the solvent mixture are irritant/toxic; wear gloves and a mask when preparing and applying solutions; soil may contain pathogens - wear gloves and wash hands afterwards.
Key Takeaways
- Standardise EVERY variable except the IV.
- Reapply treatment if exposure must be maintained across the experimental period.
- Use a large sample and a mean for both germination percentage and growth.
- Safety requires naming a hazard AND a risk AND a precaution.
Common Mistakes
- Forgetting to reapply juglone (so the treatment disappears once the seed has imbibed the initial solution).
- Saying "measure growth" without specifying how (ruler, from where to where, at what time after emergence).
- Failing to standardise light, temperature, water or seed source.
- Vague safety statements ("be careful") without naming hazard and precaution.
- Using too few seeds and not calculating a mean.
Things to Be Careful About
- The mark scheme wants BOTH a hazard AND a risk AND a precaution for the safety mark.
- Each standardisation must name WHAT is kept constant (temperature, light, water, seed source) and ideally HOW (incubator, controlled-environment chamber, equal-volume watering).
- The 10-day growth measurement is taken from the moment each individual seedling appears, not 10 days after sowing (so the seedlings in each tray may be measured at different calendar days).
Another student investigated the effect of juglone on a different species of plant called crimson clover, Trifolium incarnatum.
The student recorded the number of days required for germination of:
- 10 seeds treated with a juglone solution with a concentration of
- 10 seeds not treated with a juglone solution.
The student used the -test to analyse the results. The -test is appropriate for the number of seeds that were used.
Suggest two other reasons why the -test is an appropriate statistical test to use for this investigation.
Answer
Any two from:
- The data (time taken for seeds to germinate) is continuous.
- The test compares the means of the two groups (juglone-treated and control).
- The data (from each population of seeds) is approximately normally distributed.
- The standard deviations of the two groups are approximately equal.
Continuous data; comparing two means; approximately normal distribution; approximately equal standard deviations (any two)
Background Concept
The t-test is a parametric statistical test that compares two means. It is appropriate only when its underlying assumptions are satisfied: the data are continuous, the two samples are independent and drawn from populations that are approximately normally distributed, and the variances (and hence standard deviations) in the two groups are similar. If these conditions fail, a non-parametric alternative (e.g. the Mann-Whitney U test) should be used instead.
Understanding the Question
The investigation compares the time taken to germinate for 10 juglone-treated seeds and 10 untreated seeds. The stem has already accepted that the sample size is appropriate. The question asks for TWO other reasons why the t-test fits this investigation.
Approach
List the assumptions of the t-test that the data in this investigation meets. Any two of the four standard assumptions will earn full marks: (i) continuous data, (ii) comparison of two means, (iii) approximate normality, (iv) similar standard deviations.
Step-by-Step Reasoning
- Continuous data: Time taken for seeds to germinate is measured on a continuous scale (days, with finer subdivisions possible), which is a requirement for the t-test.
- Comparison of two means: The hypothesis concerns whether the mean germination time differs between the juglone-treated group and the control group - exactly what the t-test is designed to test.
- Approximate normality: Time-to-germination data from a population of seeds of the same species is approximately normally distributed, satisfying this assumption.
- Similar standard deviations: Because the seeds are from the same species and grown under similar conditions (apart from the juglone treatment), the variability in germination time within each group should be similar.
Key Takeaways
- t-test requirements: continuous data, two groups, approximate normality, similar variances.
- The t-test is NOT appropriate for categorical data (use chi-squared) or for comparing more than two means (use ANOVA).
- If normality is in doubt with small samples, a non-parametric test such as the Mann-Whitney U test is preferable.
Common Mistakes
- Repeating the sample-size justification already given in the stem.
- Stating vague reasons like "the data is reliable" or "there are two groups" without naming the statistical property (means, continuous, normal, variances).
- Saying the data is "categorical" or "discrete" (it is continuous).
Things to Be Careful About
"Two groups" alone is not sufficient - the test compares the two MEANS of the groups. The reasoning must refer to the statistical property, not just the experimental design.
The null hypothesis for this -test was:
There is no difference between the time taken for seeds to germinate when treated with juglone and the time taken for seeds to germinate when not treated with juglone.
The calculated value of was .
The student compared to the values in Table 1.1.
Table 1.1
| degrees of freedom | probability level () | |||
|---|---|---|---|---|
| 0.10 | 0.05 | 0.01 | 0.001 | |
| 17 | 1.740 | 2.110 | 2.898 | 3.965 |
| 18 | 1.734 | 2.101 | 2.878 | 3.922 |
| 19 | 1.729 | 2.093 | 2.861 | 3.883 |
| 20 | 1.725 | 2.086 | 2.845 | 3.850 |
| 21 | 1.721 | 2.080 | 2.831 | 3.819 |
Using Table 1.1 and the calculated value of of , state and explain what the student can conclude about the results.
Working
From Table 1.1, at 18 df and , the critical value of is .
The calculated value () is LESS than the critical value ().
Answer
The null hypothesis is accepted at . There is no significant difference (at ) between the mean time taken for juglone-treated and untreated crimson clover seeds to germinate.
Null hypothesis accepted at p = 0.05; no significant difference between mean germination times
Background Concept
For an unpaired two-sample t-test on samples of size and , the degrees of freedom is . The calculated value of is compared with a critical value from a t-table at the chosen probability level (commonly ). If the calculated value is less than the critical value, the null hypothesis is accepted at that probability level - meaning the difference observed is not statistically significant.
Understanding the Question
The stem gives a calculated and a critical-values table for df = 17 to 21. Each group has 10 seeds, so df = 18. The question asks the candidate to state and explain the conclusion.
Approach
- Calculate df.
- Look up the critical value at df = 18 and p = 0.05.
- Compare the calculated t with the critical value.
- State the conclusion about the null hypothesis and what it means biologically.
Step-by-Step Reasoning
From Table 1.1, at 18 df and , the critical value of is .
The calculated value () is LESS than the critical value ().
Therefore, the null hypothesis is accepted at : there is no significant difference (at ) between the mean time taken for juglone-treated and untreated crimson clover seeds to germinate.
Key Takeaways
- df = for an unpaired two-sample t-test.
- Calculated t must EXCEED the critical value to REJECT the null hypothesis.
- The standard probability level used is (5%).
- "Accepting" the null hypothesis is not the same as "proving" it; we can only say the data do not provide evidence of a significant difference.
Common Mistakes
- Using the wrong df (e.g. 20 or 19, or ).
- Saying "the result is significant" when the calculated value is LESS than the critical value.
- Confusing "accept" and "reject" the null hypothesis.
- Failing to mention the probability level used.
Things to Be Careful About
Wording is "accept the null hypothesis" (or "fail to reject"), not "prove the null hypothesis". At there is no significant difference; we cannot say there is definitely no effect, only that the data do not provide evidence of one at this significance level. Note that the calculated is greater than the critical value (1.734) at df = 18, so the result IS significant at but not at ; by convention the more stringent is used unless stated otherwise.
Compounds containing nitrite ions () are present in many foods eaten by humans.
Scientists tested the effect of different concentrations of nitrite ions on the population growth of 5 species of bacterium. All 5 species are pathogenic and can infect the human digestive system.
For each species of bacterium, the scientists placed suspensions of the bacteria in a microwell plate. A microwell plate is a plastic plate containing 96 wells, which are similar to small test-tubes.
In each well, the scientists added:
- a suspension of the bacterial species
- a solution containing nitrite ions
- nutrient broth.
The scientists incubated the microwell plate at for 24 hours. After 24 hours, the scientists estimated the number of bacteria in each well by measuring optical density, using a microwell plate reader.
For each species of bacterium, the scientists repeated the experiment with several different concentrations of solution containing nitrite ions.
The scientists determined the lowest nitrite concentration at which no bacterial population growth had occurred after 24 hours.
The scientists standardised temperature, pH (pH 4.8) and time in the investigation.
State two other variables that the scientists should standardise in this investigation.
1 ______
2 ______
Answer
-
Volume of (bacterial) suspension ;
-
Volume of nitrite (ion solution) ;
(Alternative accepted: concentration / volume of nutrient broth)
1 Volume of bacterial suspension; 2 Volume of nitrite ion solution
Background Concept
A fair test requires every variable that could affect the outcome — apart from the independent variable — to be kept the same in every well. The independent variable here is the concentration of nitrite ions (this is what is varied). Everything else that influences bacterial population growth after 24 hours must be standardised, otherwise differences between wells could be due to that factor rather than to the nitrite concentration. Factors that affect bacterial growth include: nutrient availability, starting population size, volume of liquid in which bacteria are suspended, temperature, pH, time of incubation, and oxygen availability.
Understanding the Question
The stem tells us temperature (37 °C), pH (4.8) and time (24 hours) have already been standardised. We need to suggest two further variables that should be standardised, given the practical setup described: each well receives (i) a bacterial suspension, (ii) a nitrite solution and (iii) nutrient broth, and is incubated. Candidates must pick measurable quantities, not vague ones.
Approach
Think about each ingredient that goes into a well. Anything that varies between wells and could affect how many bacteria are present after 24 hours must be kept constant. Look for variables that are: (a) controllable, (b) measurable, and (c) likely to influence bacterial growth.
Step-by-Step Reasoning
- Volume / number / population / optical density of the bacterial suspension. The starting number of bacteria determines how many are present after 24 hours regardless of nitrite concentration. Different starting populations would make the optical-density readings (the dependent variable) impossible to compare fairly. This is the single most important standardisation here.
- Volume of nitrite (ion) solution. Different volumes would change both the nitrite concentration delivered and the total well volume (and hence nutrient dilution), so this must be kept the same across all wells of the same nominal concentration.
- Volume / concentration of nutrient broth (alternative third option from the mark scheme). Bacteria need nutrients to multiply; wells with more nutrients would allow faster growth, confounding the result.
The mark scheme accepts any two of the three; the two given above are the most obvious.
Key Takeaways
- Controlled variables are all factors, other than the independent variable, that could influence the dependent variable.
- For microbiological assays, both the amount of inoculum and the amount of each reagent added must be standardised.
- "Standardise" means keep identical across every well — equal volumes, equal concentrations, equal starting populations.
Common Mistakes
- Suggesting variables already given as standardised (temperature, pH, time) — these earn zero because they are already controlled.
- Suggesting the independent variable (nitrite concentration) — this is what is being varied, not standardised.
- Vague answers such as "amount of bacteria" without specifying volume, number, population or optical density — the mark scheme requires a measurable quantity.
- Naming the species of bacterium (this is part of the experimental design, not a standardised variable).
Things to Be Careful About
- Give a precise, measurable variable, not a general concept.
- Each answer should be a single sentence with the quantity clearly stated.
The results of the investigation are shown in Fig. 2.1.
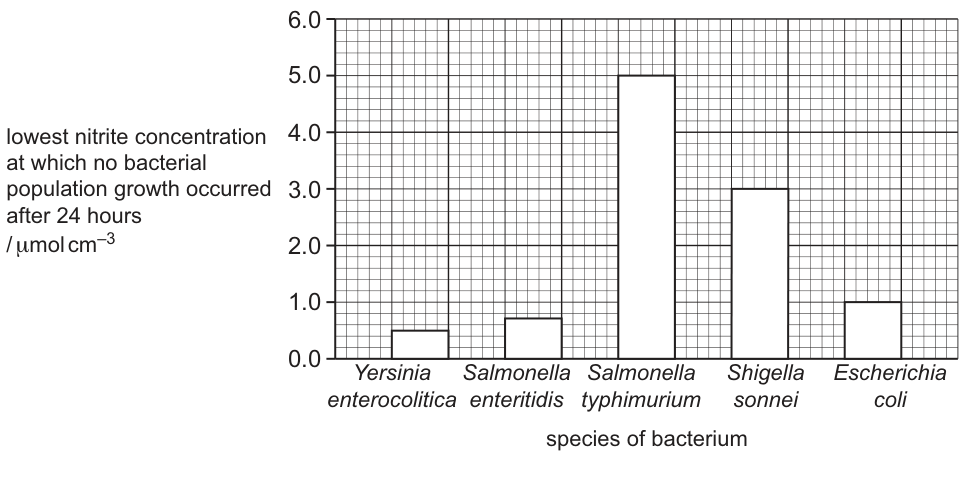
State the type of data represented by the species of bacterium and the lowest nitrite concentration in Fig. 2.1.
species of bacterium ______
lowest nitrite concentration ______
Answer
- species of bacterium: nominal ;
- lowest nitrite concentration: continuous ;
species: nominal; concentration: continuous
Background Concept
Data are classified by type because different statistical tests and graphical presentations are appropriate for each type:
- Nominal data are categories with no inherent order (e.g. species names, blood groups, eye colour).
- Ordinal data are ordered categories where the gaps between ranks are not necessarily equal (e.g. low / medium / high).
- Discrete data are countable whole numbers (e.g. number of bacteria, number of leaves).
- Continuous data are numerical values that can take any value within a range, including fractions/decimals, and are obtained by measurement (e.g. length, mass, concentration).
Understanding the Question
We have two variables displayed on Fig. 2.1: the species of bacterium on the x-axis (categorical labels) and the lowest nitrite concentration on the y-axis (numerical values in µmol cm⁻³). The question asks for the correct data type for each.
Approach
Ask: is the variable a name/label with no numerical meaning, or a measured number on a scale? That decides between nominal/ordinal and discrete/continuous. Then ask whether the numbers are restricted to whole numbers (discrete) or can take any value (continuous).
Step-by-Step Reasoning
- Species of bacterium: the names Yersinia enterocolitica, Salmonella enteritidis, etc. are simply labels. There is no numerical ordering — Escherichia coli is not "greater than" Shigella sonnei. These are categories with no rank, so the data type is nominal.
- Lowest nitrite concentration: this is a measured quantity (µmol cm⁻³) obtained from the experiment. It can take any value within a range, including non-integer values such as 0.7, 1.5, 2.85. There are no restrictions on the values it can take, so the data type is continuous.
Key Takeaways
- Names/labels without numerical order = nominal.
- Measured quantities that can take any value = continuous.
- Identifying the data type is essential for choosing the correct statistical test later (e.g. a t-test requires continuous data; a chi-squared test works on counts/frequencies).
Common Mistakes
- Writing "qualitative" or "categorical" instead of the precise term "nominal".
- Writing "quantitative" or "discrete" instead of "continuous" — discrete would imply only whole-number values, but concentrations can be non-integer.
- Confusing the bars on the chart (which represent continuous values) with the species labels (which are nominal categories).
Things to Be Careful About
- Use the exact statistical terms nominal and continuous; the mark scheme will not accept synonyms.
The 2 species of Salmonella shown in Fig. 2.1 are closely related.
Calculate the percentage difference between the results shown in Fig. 2.1 for the 2 species of Salmonella.
Show your working.
______ %
Working
From Fig. 2.1:
- Salmonella enteritidis =
- Salmonella typhimurium =
(Using the larger value as the denominator gives , which is also accepted by the mark scheme.)
Answer
614 %
614 %
Background Concept
A percentage difference expresses the size of a change between two values as a percentage of one of the values. There are two common conventions:
- Percentage change = — used when one value is clearly the reference (e.g. before vs after, smaller vs larger).
- Symmetric percentage difference = — used when neither value is privileged.
In CIE mark schemes, "percentage difference" is usually treated as a percentage change relative to one of the values, and either direction is often accepted.
Understanding the Question
We must compare the lowest nitrite concentration that prevented growth of Salmonella enteritidis with that for Salmonella typhimurium. From Fig. 2.1 we read:
- S. enteritidis bar reaches just below 1.0, at 0.7 µmol cm⁻³.
- S. typhimurium bar reaches 5.0 µmol cm⁻³.
Approach
- Read both values carefully off the bar chart (use gridlines, not rough estimates).
- Calculate the difference and divide by an appropriate base value, then multiply by 100.
- State the final answer as a percentage.
Step-by-Step Reasoning
- Read values from Fig. 2.1 (mark scheme point 1). The S. enteritidis bar is clearly below the 1.0 gridline at 0.7 µmol cm⁻³; the S. typhimurium bar is on the 5.0 gridline at 5.0 µmol cm⁻³.
- Set up the calculation (mark scheme point 2). The difference is . Using the smaller value as the denominator gives the larger percentage: .
- Evaluate and quote with the % sign (mark scheme point 3). , which rounds to 614 %.
The mark scheme also accepts 86 %, which is what you obtain by dividing the same difference by the larger value: . Both are correct because they each express the relative gap between the two results; the convention you pick determines the magnitude.
Key Takeaways
- Always read bar-chart values to the precision shown by the gridlines.
- Show your working — substitution into the formula earns a mark even if the arithmetic slips.
- The mark scheme often accepts both directions of a percentage-difference calculation.
Common Mistakes
- Reading S. enteritidis as 0.5 (the gridline below) or as some other value; the mark scheme is firm at 0.7.
- Dividing by the wrong base value without realising the answer changes.
- Forgetting the % sign on the final answer.
- Writing the difference (4.3) without converting it into a percentage.
Things to Be Careful About
- Use the gridlines to read values; do not guess.
- State the units of the readings (µmol cm⁻³) even though the final answer is a %.
- Round only at the end, not at intermediate steps.
Use Fig. 2.1 to state:
- the species of bacterium that is most affected by nitrite ions
- the species of bacterium that is least affected by nitrite ions.
most affected ______
least affected ______
Answer
- most affected: Yersinia enterocolitica ;
- least affected: Salmonella typhimurium .
most affected: Yersinia enterocolitica; least affected: Salmonella typhimurium
Background Concept
The y-axis of Fig. 2.1 shows "lowest nitrite concentration at which no bacterial population growth occurred after 24 hours". A species that needs only a tiny concentration of nitrite to stop it growing is highly sensitive (most affected); a species that needs a lot of nitrite before growth stops is resistant (least affected). So:
- The smallest bar = the most affected species.
- The tallest bar = the least affected species.
Understanding the Question
The question asks us to identify, from the bar chart, the species that is most affected by nitrite ions and the species that is least affected. The answer is obtained purely by reading the heights of the bars.
Approach
Compare the bar heights in Fig. 2.1 and identify the shortest and tallest. Convert those into the corresponding species names.
Step-by-Step Reasoning
- From Fig. 2.1, the shortest bar belongs to Yersinia enterocolitica at approximately 0.5 µmol cm⁻³ — this species is stopped from growing by the smallest amount of nitrite, so it is the most affected.
- The tallest bar belongs to Salmonella typhimurium at 5.0 µmol cm⁻³ — this species requires a much larger concentration of nitrite before its growth stops, so it is the least affected.
Key Takeaways
- In dose–response data, the species that responds at the lowest dose is the most sensitive.
- Always match the wording of the question ("most/least affected") to the corresponding numerical direction (lowest/highest dose).
Common Mistakes
- Reversing the relationship and naming S. typhimurium as most affected (it is the least affected because it is the most resistant).
- Confusing the direction of the bars — reading "most affected" as "the bar that grows the tallest" rather than "the species needing the smallest dose".
Things to Be Careful About
- Italicise the species binomial names, e.g. Yersinia enterocolitica; the mark scheme credits the correct name only.
A student looked at the results and stated:
Consuming a lot of nitrites would improve the health of people because it would help to prevent diseases in the digestive system caused by pathogenic bacteria.
Suggest four reasons why this conclusion might not be valid.
1 ______
2 ______
3 ______
4 ______
Answer
-
The investigation was carried out in a laboratory / in vitro, not in a person / in vivo ;
-
The experiment only ran for 24 hours, so it gives no information about longer-term effects (of nitrite consumption) ;
-
Only five species of (pathogenic) bacteria were tested / other species were not tested ;
-
The pH used (4.8) does not match the pH of the human digestive system / the pH varies along the digestive tract (e.g. the small intestine is around pH 7–8) ;
Any four valid reasons — e.g. in-vitro not in-vivo; only 24 h; only 5 species tested; pH 4.8 not matching the digestive system.
Background Concept
Validity means the degree to which the conclusions drawn from an experiment actually reflect what would happen in the real-world situation the question asks about. Here, the student's claim jumps from "nitrites stop some pathogenic bacteria growing in a microwell plate at pH 4.8 for 24 h" to "eating lots of nitrites will improve human health". This leap needs defending, and many features of the experimental design make the conclusion unsafe.
Understanding the Question
The student is generalising from a tightly-controlled laboratory experiment to the much messier situation of the human digestive tract. We are asked to give four reasons why that generalisation is not necessarily valid. Each reason should be a specific, identifiable weakness of either the experimental design or the biological inference.
Approach
Think about every difference between the laboratory set-up and the real human situation: where the experiment was done, how long it ran, which bacteria were tested, what the conditions were, and what else nitrites might do (besides killing pathogens).
Step-by-Step Reasoning
The mark scheme lists nine possible weaknesses; any four of them score the four marks. The four featured in the solution above are:
- In vitro vs in vivo. The bacteria were grown in plastic wells on a plate, not inside a human gut. Many factors present in the gut (other microbes, immune cells, food, mucus, hormones) are absent in the well, so bacteria might behave very differently.
- 24-hour duration. The experiment captured only an acute response. A longer exposure might reveal adaptation, resistance, recovery or harm to the host that cannot be inferred from one day of data.
- Only five species tested. The conclusion is being applied to "diseases of the digestive system", but the digestive tract harbours hundreds of pathogenic species. Results from five species cannot be extrapolated to all of them.
- pH mismatch. The well pH was 4.8, but the human digestive system has a wide pH range — strongly acidic in the stomach (~pH 1–3), but near-neutral in the small intestine (~pH 7–8). Bacteria respond differently at different pH, so the MIC values obtained at pH 4.8 may not apply elsewhere in the gut.
Other valid weaknesses (alternative answers) include:
5. Nitrites may also kill beneficial gut bacteria, disrupting the normal microbiota and potentially causing harm.
6. Nitrites could be toxic / have side-effects in humans themselves (e.g. methaemoglobinaemia, formation of nitrosamines linked to cancer).
7. No control experiment with no nitrite added — without it, you cannot be certain that the bacteria would have grown in the absence of nitrite.
8. No statistical test was performed, so the differences between species (and any effect of nitrite) cannot be said to be significant.
9. The experiment measured only whether growth occurred or not; it did not show that bacterial populations decreased, so nitrites may only be bacteriostatic, not bactericidal.
Key Takeaways
- In-vitro results cannot be assumed to translate directly to in-vivo situations — the biological context matters.
- Validity of a conclusion depends on duration, sample coverage, realistic conditions, controls and statistics.
- Always question what is being measured (growth vs death, in vitro vs in vivo, short-term vs long-term).
Common Mistakes
- Saying "human error" or "not accurate" — these are too vague and earn no credit.
- Repeating the same idea twice (e.g. mentioning pH twice).
- Confusing growth inhibition with killing — the experiment only showed "no growth", not "death".
- Suggesting improvements rather than reasons why the conclusion is invalid; the question asks for limitations.
Things to Be Careful About
- Each point must be specific and biological, not a generic statement about science.
- Italicise species names where used.
- Make sure the four points are distinct — the mark scheme penalises repeats of the same idea.