Biology 9700/44 — October/November 2025
Cambridge A-Level · A Level Structured Questions · worked solutions for every part, with the mark scheme
Topics Selection and Evolution · Inheritance · Homeostasis · Control and Coordination · Genetic Technology · Classification, Biodiversity and Conservation · +2 more
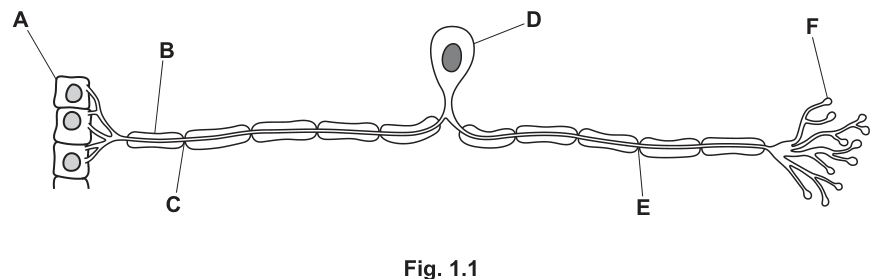
Fig. 1.1 is a diagram of a sensory neurone.
Use the letters A–F in Fig. 1.1 to identify:
a receptor cell ______
an area where dendron membrane depolarisation occurs ______
a structure that forms a synapse with an intermediate neurone ______
a structure that allows rapid transmission of impulses ______
Answer
- a receptor cell: A
- an area where dendron membrane depolarisation occurs: C
- a structure that forms a synapse with an intermediate neurone: F
- a structure that allows rapid transmission of impulses: B
A, C, F, B
Background Concept
A sensory neurone is a nerve cell that carries action potentials from a sensory receptor (e.g. in the skin, muscle or eye) towards the central nervous system. Its structure is distinct from that of a motor neurone because the cell body (soma) sits on a side branch off the main conducting fibre, rather than at one end of the cell.
The long conducting fibre of a sensory neurone is divided into two named regions:
- the dendron – the long peripheral process that carries the impulse from the receptor towards the cell body;
- the axon – the long central process that carries the impulse from the cell body onwards into the CNS.
Both regions are wrapped in a myelin sheath, formed by Schwann cells in the peripheral nervous system. The myelin sheath is interrupted at regular intervals by nodes of Ranvier, where the axonal membrane is exposed to the extracellular fluid. Because myelin is an electrical insulator, the action potential cannot be regenerated beneath it. Instead, the action potential "jumps" from one node of Ranvier to the next – this is saltatory conduction, and it dramatically increases the speed of impulse transmission.
At the end of the axon, the membrane breaks up into many fine synaptic terminals (synaptic knobs / boutons), each of which forms a synapse with the next neurone in the pathway (an intermediate / relay neurone in the CNS).
Understanding the Question
Part (a) is a label-recognition question. Fig. 1.1 shows a sensory neurone with six labelled structures (A–F), and each blank must be filled with the letter of the structure whose function best matches the description.
From the figure:
- A is at the start of the dendron, where the receptor cells are drawn.
- B is the long, myelinated conducting fibre – the dendron.
- C points to one of the small gaps in the myelin sheath – a node of Ranvier.
- D is the bulge on a side branch containing the nucleus – the cell body (soma).
- E is the fatty insulating wrapping – the myelin sheath.
- F is the branched end of the axon – the synaptic terminals.
Approach
For each blank, identify the structure whose function matches the description, by recalling the role of each part of a sensory neurone:
- Receptor cell – the very first structure in the chain, which detects the stimulus and generates the impulse.
- Area where depolarisation occurs – this must be where voltage-gated Na⁺ channels are concentrated and the membrane regenerates the action potential: the node of Ranvier (the myelin sheath elsewhere blocks ion flow across the membrane).
- Structure that synapses with an intermediate neurone – the synaptic terminals at the end of the axon.
- Structure that allows rapid transmission of impulses – the dendron, the long conducting fibre (the mark scheme awards B for this blank, with the myelin sheath that wraps it being the underlying reason for the speed).
Step-by-Step Reasoning
- Blank 1 – receptor cell: the receptor is the structure that detects the stimulus and initiates the impulse. On the diagram, this is the cluster of cells at the very start of the neurone, labelled A.
- Blank 2 – area of depolarisation: depolarisation requires voltage-gated Na⁺ channels to open and Na⁺ to rush in. These channels are concentrated at the nodes of Ranvier (the unmyelinated gaps), where the action potential is regenerated. The diagram shows this as C.
- Blank 3 – synapse with intermediate neurone: synapses are formed at the synaptic terminals (synaptic knobs) at the end of the axon. The diagram shows these as the branched endings, labelled F.
- Blank 4 – rapid transmission: the dendron is the long conducting pathway that carries the impulse from the receptor towards the cell body, and (as the axon) onwards into the CNS. On the diagram, this is B.
Key Takeaways
- A sensory neurone has the cell body on a side branch; the long fibre is the dendron (receptor → cell body) and the axon (cell body → CNS).
- Myelin sheath + nodes of Ranvier → saltatory conduction → fast transmission.
- Synaptic transmission always occurs at the synaptic terminals, never along the length of the axon.
Common Mistakes
- Confusing the dendron (B) with the axon – the dendron is the part between the receptor and the cell body, the axon is the part between the cell body and the synaptic terminals.
- Choosing the myelin sheath (E) for "structure that allows rapid transmission of impulses" instead of the dendron (B) – the mark scheme credits the conducting fibre (B), not the insulating wrapping (E).
- Confusing the cell body (D) with the receptor cells (A) – the cell body contains the nucleus and is on a side branch, whereas the receptor cells are at the start of the dendron and detect the stimulus.
Things to Be Careful About
- A sensory neurone differs from a motor neurone in that the cell body is on a side branch (not at one end) and the long fibre is split into a dendron (receptor → cell body) and an axon (cell body → CNS).
- Depolarisation of a myelinated axon occurs at the nodes of Ranvier because the voltage-gated Na⁺ channels are concentrated there – the myelin sheath insulates the membrane between nodes and prevents ion flow there.
- Synaptic transmission always occurs at the synaptic terminals, never along the length of the axon or dendron.
Opioid drugs can bind to opioid receptors in the presynaptic membrane of a cholinergic synapse.
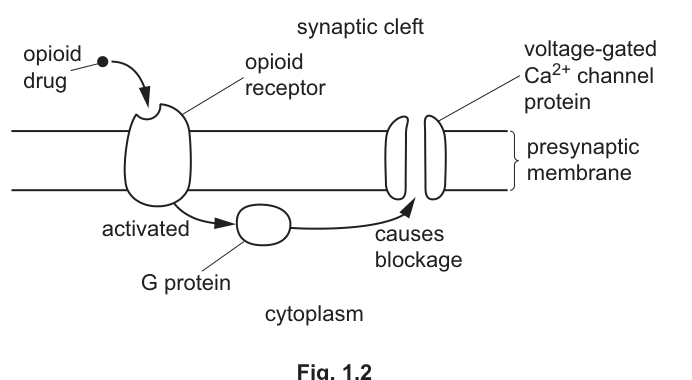
Fig. 1.2 is a diagram of a presynaptic membrane with an opioid receptor.
Opioid drugs have an effect on the normal events that occur at a cholinergic synapse.
Suggest and explain the effect that an opioid drug will have on the normal events that occur at a cholinergic synapse.
Answer
The opioid drug binds to the opioid receptor on the presynaptic membrane, activates the G protein, and (as Fig. 1.2 shows) this blocks the voltage-gated channel. As a result:
- no / less enters the synaptic knob (presynaptic neurone);
- no / less vesicles of acetylcholine move towards, fuse with, or undergo exocytosis at the presynaptic membrane (so less ACh is released into the synaptic cleft);
- no / less acetylcholine binds to receptors on the postsynaptic membrane;
- no / less enters the postsynaptic neurone, so no / less depolarisation of the postsynaptic membrane;
- no / fewer action potentials are generated in the postsynaptic neurone.
No / less Ca²⁺ entry → no / less ACh release → no / less ACh binding to postsynaptic receptors → no / less Na⁺ entry / depolarisation → no / fewer action potentials.
Background Concept
A cholinergic synapse is a synapse that uses acetylcholine (ACh) as its neurotransmitter. The normal sequence of events at the presynaptic side is:
- An action potential arrives at the synaptic knob (presynaptic membrane).
- The depolarisation opens voltage-gated channels in the presynaptic membrane.
- ions flow into the synaptic knob down their electrochemical gradient (from high concentration in the synaptic cleft to low concentration in the cytoplasm).
- The rise in intracellular causes vesicles of ACh to move to, fuse with, and undergo exocytosis at the presynaptic membrane, releasing ACh into the synaptic cleft.
- ACh diffuses across the cleft and binds to nicotinic ACh receptors on the postsynaptic membrane. These receptors are themselves ligand-gated cation channels, and their opening allows to flow into the postsynaptic neurone.
- entry depolarises the postsynaptic membrane. If the threshold is reached, a new action potential is generated in the postsynaptic neurone.
Calcium ions are therefore the crucial link between the electrical event (action potential) at the presynaptic terminal and the chemical event (neurotransmitter release). Anything that blocks the entry of into the synaptic knob will silence the synapse.
Understanding the Question
Part (b) gives Fig. 1.2, which shows an opioid drug binding to an opioid receptor on the presynaptic membrane. The binding activates a G protein in the cytoplasm, and the activated G protein blocks the voltage-gated channel. The question asks you to suggest and explain the effect of this on the normal events at a cholinergic synapse.
- "Suggest" means you may need to reason beyond what is directly stated in the figure.
- "Explain" means you must give a cause-and-effect chain, not just a one-word answer.
The key point is that the diagram itself shows the cause – the channel is blocked. You must then work through each downstream consequence in the order in which they normally occur at a cholinergic synapse.
Approach
- Start at the cause shown in the figure: channels are blocked → less enters the synaptic knob.
- Follow the cascade in the same order as the normal events at a cholinergic synapse, dropping out each step:
- less in → less vesicle movement / fusion / exocytosis
- less ACh released into the cleft → less ACh binds to postsynaptic receptors
- less ACh binding → less entry / less depolarisation of postsynaptic membrane
- less depolarisation → fewer or no action potentials in the postsynaptic neurone
- Write each step concisely, using the words "no / less" so the examiner sees you understand it is a graded effect, not necessarily a complete switch-off.
Step-by-Step Reasoning
- Cause (in figure): opioid drug binds to opioid receptor → activates G protein → G protein blocks the voltage-gated channel.
- Marking point 1: Because the channels are blocked, no / less enters the synaptic knob / presynaptic neurone.
- Marking point 2: With insufficient intracellular , the vesicles of ACh do not move towards, fuse with or undergo exocytosis at the presynaptic membrane – so less ACh is released into the synaptic cleft.
- Marking point 3: With less ACh in the cleft, less ACh binds to receptors on the postsynaptic membrane.
- Marking point 4: With fewer postsynaptic receptors activated, less enters the postsynaptic neurone, and the postsynaptic membrane is less depolarised (or not depolarised at all).
- Marking point 5: If the postsynaptic membrane does not reach threshold, no / fewer action potentials are generated in the postsynaptic neurone.
Any four of these points is enough for full marks; the more complete answers include all five.
Key Takeaways
- Calcium ions are essential coupling agents at chemical synapses – they link the electrical event (action potential) to the chemical event (neurotransmitter release).
- Any treatment that blocks voltage-gated channels (here, indirectly via a G protein after opioid-receptor binding) silences the synapse and stops transmission to the postsynaptic neurone.
- Opioid drugs are therefore inhibitory: they reduce the strength of synaptic transmission. This is why they are useful clinically as analgesics (pain-killers) – they reduce transmission in pain pathways.
Common Mistakes
- Stating only that "neurotransmitter release is reduced" without tracing the cause ( entry blocked) or the downstream consequences (less entry, fewer action potentials). Vague statements lose marks.
- Writing about "blocking the postsynaptic receptors" – the diagram shows the drug acts on the presynaptic side; the postsynaptic receptors are unaffected.
- Saying that " leaves the cell" or " is removed" – the mark scheme is looking for "no / less enters".
- Confusing the opioid receptor (a G-protein-coupled receptor) with the ACh receptor (a ligand-gated ion channel) – they are different proteins with different mechanisms.
Things to Be Careful About
- Use the precise terminology: "synaptic knob / presynaptic neurone", " channel", "exocytosis", "postsynaptic membrane".
- The mark scheme accepts either "no" or "less" for each step – both describe the inhibitory effect, but "less" is biologically more accurate (some may still enter through unblocked channels).
- The cascade must be in the correct order: channel block → less entry → less vesicle exocytosis → less ACh release → less ACh binding → less entry / depolarisation → fewer action potentials. Reversing the order loses marks.
Meiosis and cytokinesis occur in the male reproductive organs (anthers) of plants to make pollen grains. Cells which carry out meiosis are known as pollen mother cells.
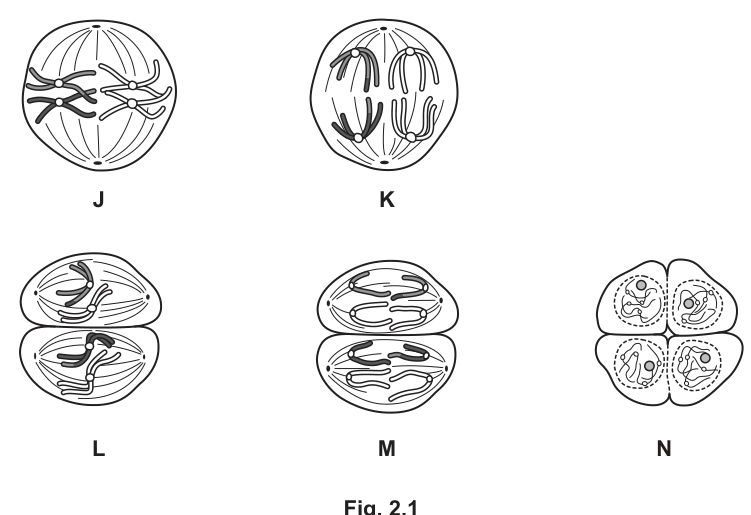
Fig. 2.1 shows five stages of meiosis in a pollen mother cell.
Use the letters J–N in Fig. 2.1 to state all the stages that show:
anaphase ______
cells containing pairs of homologous chromosomes ______
crossing over ______
haploid cells ______
Answer
- anaphase: K and M
- cells containing pairs of homologous chromosomes: J and K
- crossing over: J
- haploid cells: L and M and N
anaphase: K and M; cells containing pairs of homologous chromosomes: J and K; crossing over: J; haploid cells: L, M and N
Background Concept
Meiosis is a reduction division that converts one diploid parent cell into four haploid daughter cells. It consists of two divisions:
- Meiosis I is the reductional division, which separates the homologous chromosomes. Key events: pairing of homologs to form bivalents in prophase I, with chiasmata where non-sister chromatids exchange segments (crossing over); alignment of bivalents at the equator in metaphase I; separation of the homologs in anaphase I; and formation of two haploid cells at telophase I / cytokinesis. Each daughter cell has only one chromosome from each homologous pair, although each chromosome still consists of two sister chromatids.
- Meiosis II is the equational division, which separates the sister chromatids (mechanically similar to mitosis but on a haploid set). Prophase II condenses the chromosomes; metaphase II lines them up at the equator of each cell; anaphase II pulls sister chromatids to opposite poles; and telophase II / cytokinesis produces four genetically distinct haploid cells.
A cell is haploid once the homologs have been pulled apart at the end of meiosis I, even though the chromosomes still consist of two chromatids each. Crossing over is a defining feature of prophase I, visible as chiasmata between non-sister chromatids of a bivalent. Anaphase is the stage in which chromosomes (or chromatids) move to opposite poles of the spindle.
Understanding the Question
The question gives you a single figure (Fig. 2.1) with five diagrams (J–N) representing stages of meiosis in a pollen mother cell. You are asked to pick the diagrams that fit four different criteria: which show anaphase, which show cells containing pairs of homologous chromosomes, which show crossing over, and which show haploid cells. Each criterion is worth one mark, and you may select more than one letter per criterion.
Approach
Decide first what each diagram is showing, then check each criterion against that identification:
- J – bivalents visible, with chiasmata (X-shaped contact points) ⇒ prophase I.
- K – two sets of chromosomes being pulled towards opposite poles, each set containing one member of a homologous pair ⇒ anaphase I.
- L – two daughter cells, each containing one member of each homologous pair (still in chromatid form) ⇒ telophase I / cytokinesis.
- M – two cells, each with sister chromatids moving towards opposite poles ⇒ anaphase II.
- N – four daughter cells, each with a haploid set of chromosomes ⇒ telophase II / cytokinesis.
Now apply each criterion to these identifications.
Step-by-Step Reasoning
-
anaphase (chromosomes/chromatids moving to opposite poles): K is anaphase I (homologs moving apart); M is anaphase II (sister chromatids moving apart in each of the two cells). Both are anaphase, so the answer is K and M.
-
cells containing pairs of homologous chromosomes: J shows bivalents – each pair of homologs is held together by chiasmata, so pairs are clearly present. K shows the homologs being pulled apart, but the homologous pairs are still recognisable as they separate, so the criterion is met. L, M and N contain only one of each homolog in each cell, so they do not fit. Answer: J and K.
-
crossing over (chiasmata / exchange of segments between non-sister chromatids): This occurs in prophase I, and the only diagram showing chiasmata is J. Answer: J.
-
haploid cells (cells that contain only one of each type of chromosome): After meiosis I, each daughter cell has one of each homolog, so it is haploid. L (two haploid cells, chromosomes still as sister chromatids), M (two haploid cells with chromatids separating) and N (four haploid cells) all qualify. Answer: L and M and N.
Key Takeaways
- Meiosis I is the reductional division: it halves the chromosome number, producing haploid cells that still contain sister chromatids.
- Meiosis II is the equational division: it separates sister chromatids, similar to mitosis but on a haploid set.
- A cell is haploid from the moment meiosis I is complete, even if its chromosomes still consist of two chromatids each.
- Crossing over is restricted to prophase I and is visible as chiasmata between non-sister chromatids of a bivalent.
- "Pairs of homologous chromosomes" describes a diploid context (bivalents, or homologs being separated at anaphase I), not a haploid context.
Common Mistakes
- Confusing anaphase I with anaphase II: in K the whole homologs (each still with two chromatids) are moving apart, while in M the sister chromatids are moving apart inside each of the two cells.
- Reading M as metaphase II because the chromosomes appear near the equator. The marking scheme treats M as anaphase II (chromatids moving to the poles in two cells), so the answer must include M for anaphase.
- Excluding K from "cells containing pairs of homologous chromosomes" because the homologs are separating. The question allows cells in which the pairs are still recognisable, and during anaphase I the pairs are identifiable as they part.
- Including J in "haploid cells" – the parent pollen mother cell and the cell at prophase I are still diploid; haploidy only appears after telophase I.
- Calling L or N "anaphase" – these are telophase/cytokinesis stages, in which the chromosomes have reached the poles and the cells are dividing; the chromosomes are not in motion between poles.
Things to Be Careful About
- Use the term haploid carefully: a cell with sister chromatids that is the product of meiosis I is still haploid, because it has only one of each homolog.
- "Pairs of homologous chromosomes" implies two homologs (one maternal, one paternal) in the same cell. This cannot occur in a true haploid cell.
- In CIE mark schemes, list every letter that applies for a given criterion; do not pick a single "best" answer if more than one stage fits.
Maize plants have male and female reproductive organs on the same plant. The male anthers are located on structures known as tassels. When selective breeding is carried out to create an F1 hybrid, the tassels are removed.
Suggest why the tassels are removed when selective breeding is carried out to create an F1 hybrid.
Answer
- To prevent self-pollination / to ensure cross-pollination ;
- So the plant must be cross-pollinated with pollen from a different / selected plant / parent / individual / variety ;
- (Making the plant effectively a female parent.)
To prevent self-pollination and ensure that the plant is cross-pollinated by pollen from a selected/different parent (i.e. it acts as the female parent).
Background Concept
Maize (Zea mays) is monoecious: each individual plant carries separate male and female reproductive structures. The male flowers are borne in the tassel at the top of the plant, and the female flowers (which develop into the cobs / ears) are located lower down on the stem. Because both sexes occur on the same plant, maize can self-pollinate if left to its own devices – pollen from the tassel falls onto the silks of the same plant and fertilises its own ovules.
In an F1 hybrid breeding programme, the breeder wants every ovule on the chosen mother plant to be fertilised by pollen from a different, selected parent line (the father). To guarantee this, the breeder physically removes the tassel from the mother plant before its pollen is shed. This prevents any self-pollination, so the only pollen that can reach the silks is the pollen deliberately supplied by the breeder from the chosen father line. The plant is then acting purely as the female parent in the cross.
Understanding the Question
The question asks you to suggest why tassels are removed when producing an F1 hybrid. The command word "suggest" means you need to put the reason into your own words rather than just state a definition – explain the practical purpose of the action in the context of a controlled cross.
Approach
Link the structure of the maize plant (tassel = male flowers) to the goal of the breeding programme (a controlled cross between two specific parents). The removal of the tassel makes the plant a guaranteed female parent in the cross.
Step-by-Step Reasoning
- The tassel is the male reproductive structure of the maize plant. If it is left in place, the plant will shed its own pollen, and self-pollination will occur on the silks of the same plant.
- In F1 hybrid production, the breeder wants to force cross-pollination between two chosen parent lines. Removing the tassel prevents self-pollination, so the only pollen that can reach the silks is the pollen supplied by the breeder from a selected, different parent.
- This converts the plant effectively into a female parent in the cross. The fertilised ovules then produce seeds that are true F1 hybrids between the chosen parents.
Key Takeaways
- Maize is monoecious, so both sexes are present on a single plant and self-pollination is the default.
- In controlled cross-breeding, the male parts of the chosen mother plant must be removed to eliminate self-pollen and to ensure the cross is made with the selected father line.
- Detasselling converts a normally hermaphrodite plant into an effective female parent in a controlled cross.
Common Mistakes
- Saying only "to prevent self-pollination" without explaining the consequence – that the plant is then forced to receive pollen from a different / selected plant. The marking scheme requires the second point about receiving pollen from another plant.
- Confusing the role of tassel removal with that of bagging the female flowers (which is also done in some breeding programmes but is not the point of this question).
- Implying that the tassel removal is to sterilise the plant, which is not correct – the plant is still fertile, just functioning as a female.
Things to Be Careful About
- "Selected" is the key word in the mark scheme: the cross is not just with any different plant but with a specific chosen parent line.
- Use the term cross-pollination (not just "crossing") when explaining the result of removing the tassel.
- Note that the mother plant is normally a maize inbred line; the tassel removal makes the inbred line the seed parent of the F1 hybrid.
Outline how selective breeding is used to produce vigorous, uniform varieties of maize.
Answer
Stage 1 – inbreeding to produce two uniform, true-breeding parent lines
- Select maize plants with desirable traits (e.g. high yield, disease resistance, rapid growth) ;
- Cross the best (most desirable) offspring with each other repeatedly over many generations (inbreeding / line breeding) ;
- (Resulting parent lines are) homozygous at many loci, so the lines breed true (uniform) ;
Stage 2 – outcross the two lines to produce the F1 hybrid
- Cross / hybridise / outbreed one inbred line with a different inbred line that has different desirable traits ;
- The F1 offspring are heterozygous at many loci, giving hybrid vigour / heterosis, and are uniform because both parents are homozygous ;
- AVP ;
Repeated inbreeding and selection produces two homozygous, true-breeding parent lines with desirable traits; these two lines are then crossed to give uniform, heterozygous F1 offspring that show hybrid vigour.
Background Concept
Selective breeding (also called artificial selection) is the process by which humans choose which individuals are allowed to reproduce, in order to shift the mean phenotype of a population over generations. It depends on the presence of heritable genetic variation in the breeding population.
In maize, two specific goals are pursued:
- Uniformity – all the F1 plants in a crop should grow at the same rate, ripen at the same time and produce cobs of similar size, so the crop is easy to manage and harvest mechanically.
- Vigour – F1 plants should grow rapidly, resist disease and yield well. This is often achieved through hybrid vigour (heterosis), where the offspring of two genetically distinct inbred lines outperform either parent.
To obtain both at the same time, breeders use a two-stage programme: first they create pure (homozygous, true-breeding) lines by inbreeding and selection; then they cross two such lines to produce uniform, vigorous F1 hybrid seed.
Understanding the Question
The question asks you to outline how selective breeding is used to produce vigorous, uniform varieties of maize. "Outline" means give the main steps / features of the process without going into exhaustive detail – but four marks means you need to cover the two key stages (inbreeding and outbreeding) and link them to the goals of uniformity and vigour.
Approach
Structure the answer in two clear stages:
- Inbreeding to produce homozygous parent lines (this gives uniformity within each line and lets the breeder fix the desirable traits).
- Outbreeding the two parent lines (this gives F1 hybrid vigour and, because both parents are homozygous, the F1 is genetically uniform across all individuals).
In each stage, state the breeding method (inbreeding / line breeding, then crossing two different lines), the selection criterion (which trait is being kept) and the genetic consequence (homozygosity in stage 1; heterozygosity / heterosis in stage 2).
Step-by-Step Reasoning
Stage 1 – inbreeding to produce two pure lines
- The breeder starts with a genetically variable population of maize and identifies plants that show the desired traits (e.g. high yield, disease resistance, rapid growth).
- The selected individuals are inbred (line-bred) – the best offspring are crossed with each other (siblings or close relatives) and the most desirable progeny are again selected and crossed. This is repeated over many generations.
- With each generation of inbreeding and selection, the population becomes more homozygous at each locus, because recessive alleles are exposed and eliminated, and desirable alleles are fixed.
- After many generations, the breeder has a true-breeding, uniform inbred line in which all individuals are essentially genetically identical. The same process is repeated independently to produce a second inbred line that carries a different set of desirable traits.
Stage 2 – outbreeding the two lines to produce the F1 hybrid
- The two inbred lines are then crossed (hybridised / outcrossed) with each other. Because the two lines are genetically distinct but each is highly homozygous, the F1 offspring are heterozygous at every locus where the two parents differ.
- This heterozygosity produces hybrid vigour (heterosis) – the F1 plants grow faster, are more disease-resistant and yield more than either parent line.
- Because both parent lines are homozygous, every F1 plant receives the same combination of alleles (one from each parent), so all the F1 plants are genetically uniform – this gives the uniformity that the farmer wants in the crop.
Key Takeaways
- Selective breeding in maize uses a two-stage programme: inbreeding to fix desirable alleles into homozygous lines, then outbreeding two such lines to produce a uniform, vigorous F1 hybrid.
- Inbreeding + selection → homozygosity → true-breeding, uniform parent lines.
- Crossing two homozygous lines → heterozygous, uniform F1 offspring that display hybrid vigour.
- The farmer-sown crop is the F1 generation. The F1 plants are uniform because both parents are genetically identical (homozygous), and vigorous because they are heterozygous.
Common Mistakes
- Skipping the inbreeding stage: describing only a single cross between two unrelated plants. The mark scheme requires the two-stage process – the inbreeding stage is what produces the uniformity in the F1.
- Confusing uniformity with vigour: uniformity comes from the parents being homozygous (so every F1 seed is genetically the same); vigour comes from the F1 being heterozygous (heterosis). The two effects have different genetic explanations.
- Stating "selective breeding is choosing the best individuals" without describing the genetic mechanism (inbreeding to homozygosity, then outbreeding to heterozygosity).
- Omitting the role of the second inbred line with a different desired trait – heterosis depends on the two parents being genetically distinct.
Things to Be Careful About
- "F1 hybrid" specifically refers to the first-generation offspring of the cross between two inbred (homozygous) parent lines. Do not call subsequent generations F1 hybrids.
- The two inbred lines should have different desired traits; the F1 then combines them. If both lines were selected for the same trait, the F1 would not display heterosis.
- In modern maize breeding the inbreeding is done by self-pollination for several generations, not by crossing siblings. The mark scheme accepts "inbreeding / line breeding" as a description of the overall approach.
- AVP (any valid point) might be, for example: "the F1 seed is sold to farmers, who cannot use F1 seed for the next crop because F2 segregates" – a useful extension.
Genetic engineering is a modern method for producing crop plants with improved characteristics.
One example of a crop plant with improved characteristics is soybean, Glycine max, which has been genetically modified to make it resistant to a herbicide. This genetically modified soybean is called GM soybean.
To create GM soybean, a bacterial gene and a section of regulatory DNA were introduced into soybean cells.
Outline the roles of enzymes and a section of regulatory DNA in the creation of genetically modified organisms such as GM soybean.
Answer
- Restriction endonuclease cuts the bacterial (herbicide-resistance) gene / DNA.
- Restriction endonuclease cuts open a plasmid (vector).
- DNA ligase joins the new (bacterial / foreign) gene into the plasmid / vector.
- A promoter (regulatory sequence) is joined to the construct.
- The promoter / regulatory sequence ensures expression of the new / bacterial / foreign / prokaryotic gene in the soybean cell.
See working
Background Concept
Genetic engineering (recombinant DNA technology) involves taking a gene from one organism and inserting it into the genome of another so that the recipient expresses a new trait. To do this, the DNA must be cut, joined and delivered in a form that the host cell can read. Three molecular components make this possible:
- Restriction endonucleases (restriction enzymes) — bacterial enzymes that recognise a specific short DNA sequence (a palindrome) and cut the phosphodiester backbone at that site. Many cut with a stagger, leaving short single-stranded "sticky ends" (overhangs) that can base-pair with complementary sticky ends on any other DNA cut with the same enzyme.
- DNA ligase — the enzyme that re-forms phosphodiester bonds, sealing nicks in the sugar-phosphate backbone to join DNA fragments together permanently.
- A promoter / regulatory sequence — a non-coding DNA region upstream of a gene that recruits RNA polymerase and initiates transcription. Without a promoter recognised by the host cell, a transferred gene is simply inert DNA: it will not be transcribed and so the protein will not be made.
In plant genetic engineering, the gene of interest is usually delivered inside a plasmid vector (a small circular piece of DNA, often derived from Agrobacterium tumefaciens Ti plasmid in plant work), and a selectable marker gene is typically added so transformed cells can be identified.
Understanding the Question
Part (a) asks for an outline of the roles of enzymes AND a section of regulatory DNA in creating a GMO such as the herbicide-resistant GM soybean described in the stem. The two enzymes named in the syllabus are restriction endonuclease and DNA ligase; the regulatory DNA element that matters here is the promoter. You need five distinct creditable points from the mark scheme, which lists six possibilities, so you should aim to cover at least one cut, the ligase join, the promoter addition, and the promoter's function.
Approach
- Identify each molecular tool named in the mark scheme and state what it acts on and what it does.
- Keep the points short and atomic — each ";" in the mark scheme is one mark.
- Use precise CIE wording: "restriction endonuclease", not "restriction enzyme" alone (mark scheme wording), "plasmid" rather than "vector" alone, and "promoter" rather than "regulatory DNA" by itself.
Step-by-Step Reasoning
- Restriction endonuclease cuts the foreign gene — the herbicide-resistance gene is part of a DNA fragment from another organism. The enzyme must cut the DNA of that fragment so the gene can be excised. Same sticky ends are generated as on the plasmid so the two can anneal.
- Restriction endonuclease cuts the plasmid (vector) — the same enzyme is used to open the circular plasmid, producing compatible sticky ends. This is what allows the gene to be spliced in.
- DNA ligase joins gene to plasmid — once the gene's sticky ends base-pair with the plasmid's sticky ends, ligase seals the sugar-phosphate backbone, producing a stable recombinant plasmid.
- Promoter is joined into the construct — because the bacterial gene has its own (prokaryotic) promoter that soybean cells would not recognise, a plant-compatible promoter is inserted upstream of the gene as part of the construct.
- Promoter ensures expression of the new gene — by binding transcription factors and RNA polymerase in the soybean cell, the promoter allows the herbicide-resistance gene to be transcribed and translated, giving the plant its new phenotype.
Any five of these six mark-scheme points earn full marks.
Key Takeaways
- Restriction endonuclease and DNA ligase are the two enzyme tools of recombinant DNA technology: one cuts, one joins.
- A promoter (regulatory DNA) is essential because it is what enables the host cell to read a foreign gene — without it, the gene is silent.
- A plasmid acts as a vector to carry the recombinant construct into the host cell.
Common Mistakes
- Writing "restriction enzyme" instead of "restriction endonuclease" — the mark scheme requires the full term; "restriction enzyme" is a common but uncredited shorthand.
- Stating that DNA ligase "attaches" the gene without specifying it joins the gene to the plasmid/vector.
- Saying the promoter "controls" the gene without saying it ensures expression — "controls" is too vague to credit.
- Forgetting to mention the cut of the plasmid as a separate point — the cut of the foreign gene and the cut of the plasmid are two distinct marks.
- Confusing promoters with marker genes — a marker gene is for selection, not for expression of the gene of interest.
Things to Be Careful About
- Five marks, five points — do not write one long paragraph and assume it covers everything; mark the points off as you go.
- The "section of regulatory DNA" in the question is the promoter, not the marker gene or the terminator.
- Use the precise term restriction endonuclease for full credit.
In 2018, an area of 123.5 million hectares was used to grow soybean crops worldwide.
GM soybean was grown in 73% of this area.
In 2018, soybeans accounted for 50% of the total GM crop area worldwide.
Calculate the total area used to grow GM crops worldwide in 2018.
Show your working.
______
Working
Area of GM soybean in 2018:
Soybean = 50% of total GM crop area, so total GM crop area = GM soybean area × 2:
Answer
million hectares ($180\ 310\ 000$ hectares)
180.31 million hectares
Background Concept
This is a two-step percentage problem disguised as a biology question. Two facts from the stem must be combined:
- 73% of the 123.5 million hectares used for soybean was planted with GM soybean.
- GM soybean accounted for 50% of the total GM crop area worldwide.
So the total GM crop area is twice the GM soybean area.
Understanding the Question
The stem gives:
- Total soybean area = 123.5 million hectares.
- 73% of that is GM soybean.
- GM soybean = 50% of all GM crops.
You need to find total GM crop area. Show all working because each step is a separate marking point.
Approach
- Calculate the GM soybean area (73% of 123.5 million).
- Recognise that GM soybean is 50% (i.e. half) of the total GM crop area, so divide by 0.5 (or multiply by 2).
- Quote the answer in million hectares, to two decimal places as the data warrants.
Step-by-Step Reasoning
Step 1 — GM soybean area:
Step 2 — Total GM crop area:
Since 90.155 million = 50% of total, total = 90.155 ÷ 0.5 = 90.155 × 2.
The mark scheme accepts hectares.
Key Takeaways
- Read percentage wording carefully: "X accounts for Y% of Z" means .
- When something is half of a total, doubling the half gives the total.
- Always show both steps in a multi-step calculation — each is a marking point.
Common Mistakes
- Stopping after step 1 and giving 90.155 million hectares as the answer — this is the GM soybean area, not the total GM crop area. The question asks for all GM crops.
- Dividing 90.155 by 50 instead of by 0.5, or dividing 123.5 by 50% directly without working through 73% first.
- Quoting 180.31 without the unit "million hectares".
Things to Be Careful About
- The mark scheme awards one mark for the intermediate 90.155 and one for the final 180.31; missing the first loses a mark even if the second is correct via error carried forward.
- Keep the unit consistent — "million hectares" throughout avoids the need to write out 180 310 000 in full, though both are acceptable.
Answer
Positive implications:
- Higher yield per hectare / more food produced, helping to feed growing populations.
- Less insecticide / pesticide needed, benefiting farmer health and reducing environmental contamination.
- Cheaper food for consumers due to higher yields and lower input costs.
- Less land needed for crops, leaving more for biodiversity / conservation.
- Improved nutritional value of food (e.g. fortified crops such as Golden Rice).
Negative implications:
- Possible new food allergies triggered by novel proteins in GM food.
- Greater quantity of herbicide residue on food, with uncertain long-term effects on consumers.
- Evolution of resistance in insects / weeds / fungi / pests, eventually reducing the benefit of the modification.
- Pollen drift to, or cross-breeding with, organic / non-GM / conventional crops, contaminating their harvests.
- GM crops may themselves become invasive weeds outside cultivated fields.
- Consumer mistrust of GM food, requiring clear labelling and potentially reducing uptake.
See working
Background Concept
A "social implication" is an effect on people, communities or society — distinct from a purely environmental or economic effect (although these can overlap). For GM crops the social issues fall into two camps:
- Positive: increased food supply, lower production costs, reduced pesticide exposure for farm workers, possible nutritional enhancement, and reduced pressure on wild land.
- Negative: potential allergenicity, herbicide residues on food, evolution of resistance in pests and weeds, gene flow to non-GM/organic crops, invasiveness of the GM crop itself, and public concern about safety and "right to choose" (labelling).
CIE expects a balanced discussion: you should be able to give examples from both sides, not just list the obvious "GM = bad" or "GM = good" line.
Understanding the Question
The command word is discuss — this is an open-ended, discursive question worth 4 marks. The mark scheme allows 11 distinct creditworthy points, of which you only need any 4. The instruction "social implications" rules out purely biological effects (e.g. "Bt toxin kills caterpillars") and economic-only effects (e.g. "farmers' profits rise") unless the effect is clearly linked to people or society.
Approach
- Brainstorm both positive and negative social points before writing.
- Choose the 3–4 strongest points you can express precisely with the mark-scheme key terms (e.g. "pollen drift", "consumer mistrust", "food allergies").
- Avoid vague statements such as "GM is good for the economy" — be specific about who benefits and how.
- You do not need both sides; four points all from one side will still earn the marks. A balanced answer is, however, safer.
Step-by-Step Reasoning
The mark scheme credits the following points (and any reasonable equivalent wording):
Positive:
- More food / higher yield per hectare → helps feed growing populations, addresses food security.
- Less insecticide / pesticide used → benefits farmer health, reduces chemical run-off.
- Cheaper food prices for consumers because of higher yields and lower inputs.
- Less land needed for agriculture, leaving more for biodiversity / nature reserves.
- Improved nutritional value (e.g. vitamin-enriched rice, omega-3 oils).
Negative:
6. Food allergies from novel proteins produced by the inserted gene.
7. Greater herbicide residue on food crops (especially relevant for herbicide-resistant GM crops like the soybean in part (a)).
8. Resistance evolving in insects / weeds / fungi / pests, eventually making the modification useless.
9. Pollen drift / cross-breeding with organic or non-GM crops, contaminating their produce and costing organic farmers their premium.
10. GM crops may become invasive weeds outside cultivation.
11. Consumer mistrust of GM food, requiring mandatory labelling.
A strong answer selects 4 of these (or close equivalents) and expresses each one as a self-contained social point.
Key Takeaways
- "Discuss" requires breadth, not depth — several different points rather than a long discussion of one.
- Social implications concern people: health, choice, livelihoods, prices, land use.
- Both positive and negative implications exist; the best answers cover at least one from each side.
Common Mistakes
- Confusing social implications with environmental implications — "harming insects" is ecological; "pesticide residues on food that consumers eat" is social.
- Writing only positives or only negatives — the question does not require both, but a one-sided answer is more vulnerable to forgetting a creditable point.
- Vague statements such as "GM crops are bad for health" without naming the specific mechanism (allergenicity, herbicide residue).
- Repeating the same idea in different words and counting it as two points — the mark scheme gives one mark per distinct point.
Things to Be Careful About
- Each marking point is independent, so write them as a short bullet list rather than as flowing prose; the examiner can then award marks line by line.
- "Resistance" in the negative column refers to the evolution of resistance in pests/weeds, not to the GM plant being resistant — read the mark scheme carefully.
- "Pollen drift" or "cross-breeding with organic crops" is the precise wording — generic "it will spread to other plants" is too vague.
- Four marks, four points; do not waste time on a fifth.
Alleles are alternative forms of a gene. For example, there may be a dominant allele, T, and a recessive allele, t, at the same gene locus.
The relative frequency of each allele of a gene in a population can change over time due to factors such as selection, genetic drift and the bottleneck effect.
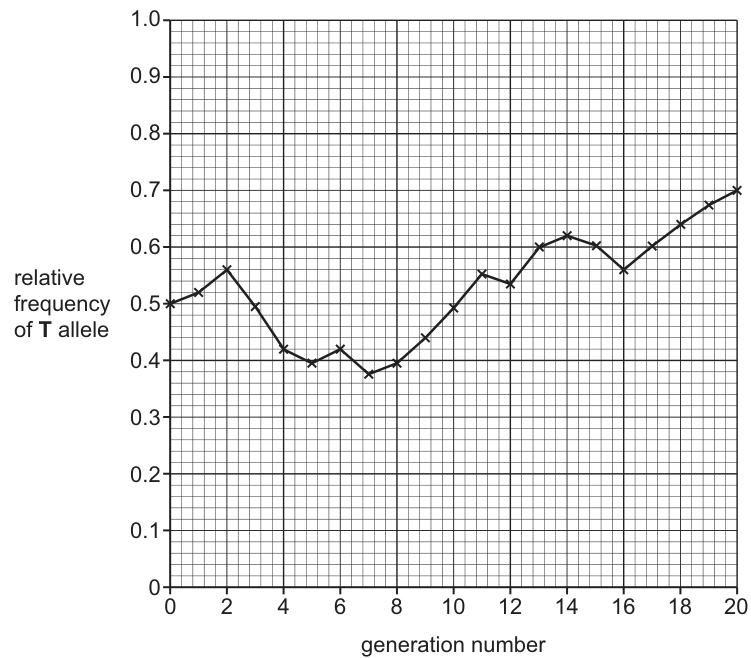
Fig. 4.1 shows the relative frequency of the T allele in a population of 50 individuals over 20 generations.
At generation 0, the number of T alleles and the number of t alleles in the population was equal, so the relative frequency of each allele was 0.5. The relative frequencies of the two alleles of the gene add up to 1.
With reference to Fig. 4.1, state the relative frequency of the t allele after 20 generations.
Answer
0.3
0.3
Background Concept
For any gene locus with two alleles, the relative frequencies of those alleles must add up to 1, because every copy of the locus in the population carries one allele or the other. If the relative frequency of T is and of t is , then . This is the same relationship that sits at the heart of the Hardy–Weinberg equations.
Understanding the Question
The question asks for the relative frequency of the t allele at generation 20. The stem tells us that at generation 0 the frequencies of T and t were both , and that the two frequencies sum to . Fig. 4.1 plots the relative frequency of T over 20 generations. The command word is "state", so a single numerical value is all that is needed.
Approach
Read the value of the T curve at generation 20, then use to find the t frequency.
Step-by-Step Reasoning
- From Fig. 4.1, at generation 20 the curve reaches on the y-axis, so the relative frequency of T is .
- Because the two allele frequencies must sum to , the relative frequency of t is .
Key Takeaways
Allele frequencies at a single locus are complementary; once one is known, the other follows directly from .
Common Mistakes
Reading the value of T at the wrong generation (e.g. confusing generation 20 with generation 14) gives the wrong answer. Some candidates forget the unit "relative frequency" and just write a number without context, although the mark here rewards the value.
Things to Be Careful About
Make sure you read the y-axis (relative frequency of T) and not the x-axis. At generation 20 the point is clearly at , not of the way along the x-axis.
Suggest possible explanations for the change in the relative frequency of the T allele between generation 0 and generation 13.
Answer
- Genetic drift: the frequency of T fluctuates between generations 0 and 13, decreasing and increasing rather than changing steadily in one direction.
- Directional selection: between generations 2 and 7, T decreases as T is selected against; from generation 7 to 13, T increases as T is selected for.
- Stabilising selection / selection for heterozygotes: this would keep the relative allele frequencies roughly the same around 0.5.
See working.
Background Concept
Allele frequencies in a population can change over time under the influence of natural selection, genetic drift, the founder effect, the bottleneck effect, mutation, and migration. Genetic drift is the random fluctuation of allele frequencies from one generation to the next, most pronounced in small populations. Natural selection is non-random: it consistently favours certain phenotypes, producing directional change (directional selection), a peak at an intermediate phenotype (stabilising selection), or two peaks (disruptive selection).
Understanding the Question
Fig. 4.1 shows the relative frequency of the T allele in a population of 50 individuals over 20 generations. The candidate is asked to suggest explanations for the change between generation 0 and generation 13. The "suggest" command word is important: the candidate is free to propose credible mechanisms, and several may apply simultaneously.
The shape of the curve between generations 0 and 13 is informative:
- Generation 0–2: a small rise to about .
- Generation 2–7: a fall to about (a trough).
- Generation 7–13: a rise to about .
- Throughout, there are small fluctuations rather than a smooth trend.
Approach
Identify the kinds of evolutionary mechanism that can produce (a) irregular fluctuations, (b) a sustained fall then sustained rise, and (c) a tendency to hover near . Match each to a credible mechanism from the syllabus.
Step-by-Step Reasoning
- The non-monotonic, up-and-down pattern (with no single sustained direction) is characteristic of genetic drift: allele frequencies drift randomly, especially in a population that is not infinitely large. The mark scheme credits both the term "genetic drift" and the description that the frequency fluctuates, decreasing and increasing rather than changing in just one direction.
- The general trend from generation 2 to generation 7 is downward (from about down to ), and then from generation 7 to generation 13 it is upward (up to about ). A sustained shift in one direction is the signature of directional selection. The candidate should say that, between generations 2 and 7, T decreased because T was being selected against, and that between generations 7 and 13, T increased because T was being selected for.
- The fact that the frequency never moves very far from for most of this window is consistent with stabilising selection (or selection favouring heterozygotes, since heterozygotes carry both alleles and so tend to keep both present at moderate frequency). Selection that favours an intermediate phenotype keeps allele frequencies close to their starting values.
Any four of these ideas earn full marks.
Key Takeaways
- A fluctuating, non-directional graph of allele frequency is a hallmark of genetic drift.
- A sustained directional shift is the signature of directional selection.
- Stabilising selection / heterozygote advantage keeps allele frequencies near their starting values.
- Real data often show a mixture of mechanisms acting at once.
Common Mistakes
- Saying only that "natural selection" occurred, without specifying directional vs stabilising.
- Describing the graph in detail without naming any mechanism.
- Inventing a single explanation (e.g. "only drift") when more than one mechanism is clearly at work.
- Mixing up directional and stabilising selection: directional selection shifts the mean phenotype (and so shifts allele frequencies in one direction); stabilising selection does not.
Things to Be Careful About
The mark scheme rewards four distinct points from a list of six possibilities. Candidates should aim to cover as many as possible, naming each mechanism and briefly describing the part of the curve it explains. Be precise about the generation numbers you refer to (e.g. "between generation 2 and 7, not "at the start").
The relative frequency of the T allele in a population of only 10 individuals was determined over 20 generations. The environmental conditions remained the same throughout the experiment.
Fig. 4.2 shows the results.
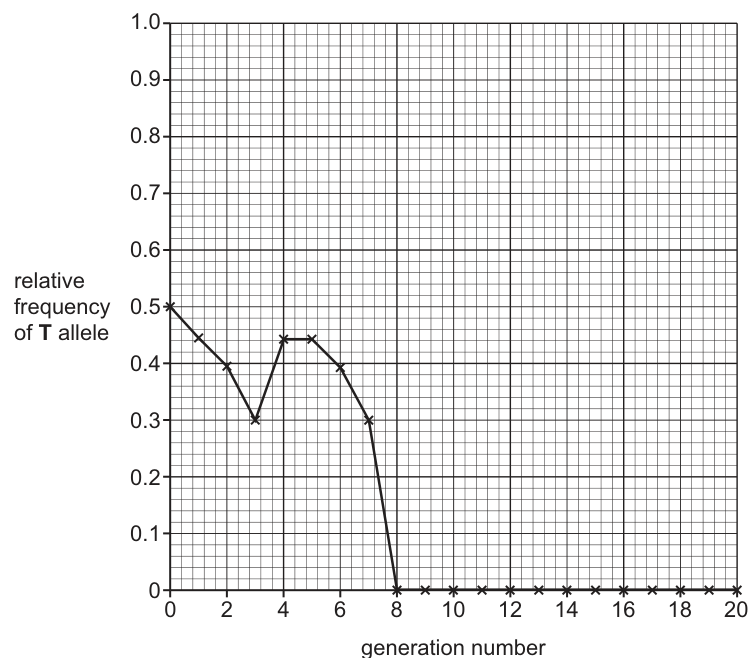
Explain why Fig. 4.2 shows a different result from Fig. 4.1.
Answer
- The population in Fig. 4.2 is much smaller (10 individuals) than that in Fig. 4.1 (50 individuals).
- In a small population, chance events have a greater relative effect on allele frequency, so genetic drift is stronger and can produce a (genetic) bottleneck effect.
- It is more likely that one allele replaces the other, goes extinct or becomes fixed; in Fig. 4.2, by chance, T-bearing organisms failed to mate / pass on the T allele, so the T allele was lost from the population by generation 8 and remained at a frequency of 0.
See working.
Background Concept
Genetic drift is the random change in allele frequencies from one generation to the next, caused by sampling error when gametes are drawn to form the next generation. Its magnitude is inversely related to population size: the smaller the population, the larger the random fluctuations. When one allele reaches a frequency of 1 (or 0) it is said to be fixed (or lost). The bottleneck effect is a sharp reduction in population size (e.g. after a natural disaster) followed by recovery; the surviving population's gene pool may differ from the original by chance alone.
Understanding the Question
Two populations were followed over 20 generations under the same environmental conditions. The first (Fig. 4.1) contained 50 individuals and retained both alleles throughout, with T ending at . The second (Fig. 4.2) contained only 10 individuals and lost the T allele entirely by generation 8. The candidate must explain why the smaller population gives such a different outcome, even though selection pressures were identical.
Approach
Recognise that the only variable changed between the two experiments is population size. Then connect small population size to the strength of genetic drift and the probability of allele loss or fixation, and finish by giving a concrete chance event that explains the extinction of T in Fig. 4.2.
Step-by-Step Reasoning
- Population size. The Fig. 4.2 population has 10 individuals versus 50 in Fig. 4.1. This is a fivefold reduction, and a population of 10 is small enough that each individual's contribution to the next generation's gene pool is very significant.
- Genetic drift and the bottleneck effect. In a small population, random (chance) events — which individuals happen to mate, which offspring survive — have a much greater relative effect on allele frequency than in a large population. This is genetic drift; the mark scheme also credits the term "bottleneck effect" because the small population behaves like a bottlenecked gene pool.
- Allele loss/fixation. Because drift is so strong, it is much more likely that one allele will replace the other or that an allele will go extinct or become fixed. In Fig. 4.2, T reached a frequency of 0 (loss) by generation 8 and remained there.
- Specific chance event. The mark scheme accepts a concrete statement such as "by chance, T organisms did not mate / pass on the T allele" or "by chance, offspring carrying T died". This explains exactly why the extinction happened.
Key Takeaways
- Smaller populations experience much stronger genetic drift.
- In very small populations, alleles can be lost or fixed within only a few generations.
- The bottleneck effect is one form of this: a small surviving population's gene pool is a non-representative sample of the original.
- Identical selection pressures can therefore produce very different evolutionary outcomes depending on population size.
Common Mistakes
- Stating only that the population is smaller without explaining why this matters biologically.
- Saying "natural selection acted differently" — the question explicitly states that environmental conditions were the same.
- Confusing the bottleneck effect (a reduction in population size) with the founder effect (a small group founding a new population); both involve drift but the scenarios are different.
- Failing to name a concrete chance event that explains the loss of T in Fig. 4.2.
Things to Be Careful About
This question is about random processes, not selection. Do not invoke selection unless you also acknowledge that the environment did not change between the two experiments. A clean answer ties the difference in outcome directly to the difference in population size through drift and the chance extinction of an allele.
State the name of the principle that can be used to calculate relative frequencies of two alleles by counting the numbers of organisms in the population showing dominant and recessive phenotypes.
Answer
Hardy–Weinberg (principle)
Hardy–Weinberg (principle)
Background Concept
The Hardy–Weinberg principle states that, in a large, randomly mating population with no mutation, no migration and no selection, the relative frequencies of alleles and genotypes remain constant from one generation to the next. Under these conditions, if is the frequency of the dominant allele and the frequency of the recessive allele, then and the genotype frequencies are . The principle is used to estimate allele frequencies from phenotype counts.
Understanding the Question
The stem asks for the name of the principle that uses phenotype counts (dominant and recessive phenotypes) to calculate allele frequencies. The "state" command word means a single named principle is required.
Approach
Recall the named principle that links phenotype counts to allele frequencies.
Step-by-Step Reasoning
- Counting the number of organisms showing the recessive phenotype gives (since only homozygous recessives show the recessive phenotype).
- Counting those showing the dominant phenotype gives (homozygous dominants plus heterozygotes).
- The principle that relates these phenotype counts to allele frequencies, and under which they would remain constant, is the Hardy–Weinberg principle.
Key Takeaways
- The Hardy–Weinberg principle is the bridge between observable phenotype ratios and underlying allele frequencies.
- It assumes an ideal, non-evolving population; deviations from its predictions are evidence that evolution is occurring.
Common Mistakes
- Confusing it with Mendel's laws (which describe inheritance within a cross) rather than population-level allele frequencies.
- Spelling it as "Hardy-Weinburg" or similar variants; spelling is not strictly assessed at A-level but the correct form is "Hardy–Weinberg".
Things to Be Careful About
The question awards a single mark, so the named principle is all that is required. There is no need to write the equations, although knowing them helps in later questions where you might be asked to apply the principle.
The fruit fly, Drosophila melanogaster, feeds on sugars found in damaged fruits.
A fruit fly with normal features is described as wild type. It has a grey body and its wings are longer than its abdomen. The genes for body colour and wing length are located on different chromosomes.
A fruit fly with mutations in these two genes has a black body and short wings.
Fig. 5.1 shows a wild type fruit fly and a mutant fruit fly.
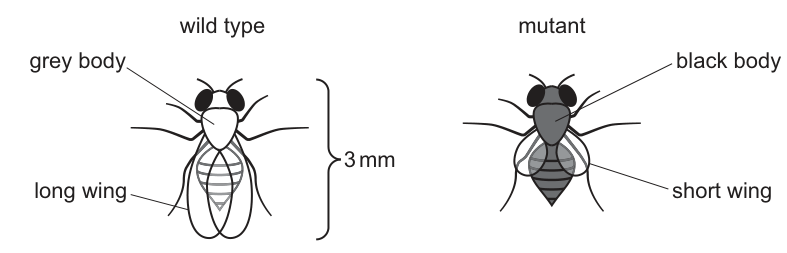
Fruit flies were first used for genetic crosses by Thomas Morgan in 1908. They are one of the most studied animals in current genetic research.
- Male fruit flies are easily distinguished from female fruit flies.
- Fruit flies have a short life cycle and a female can lay hundreds of eggs in a few days.
- Some genes for development and cell signalling in fruit flies are similar to those of humans.
Suggest why fruit flies are still used in genetic crosses.
Answer
Any three from:
- small so can be kept in a small space / at low cost / with low maintenance ;
- parents can be selected for, mating / cross-breeding / particular crosses ;
- many, offspring / generations, in a short time ;
- can be used to research, cancer / (named) neurodegenerative diseases / AVP.
Any three valid points, e.g. small/cheap to keep, many offspring and short generation time, genes similar to humans so useful in disease research.
Background Concept
Drosophila melanogaster has been the workhorse of genetics since Thomas Hunt Morgan first bred them in his famous "Fly Room" at Columbia University in the early 20th century. A model organism is a species that is easy to study in the laboratory and whose biology is sufficiently representative that findings can be extrapolated to other species. Fruit flies combine several practical and biological advantages that few other organisms can match. They are tiny (about 3 mm long), have a generation time of around 10–14 days at 25 °C, can lay hundreds of eggs after a single mating, and show clear sexual dimorphism, which means males and females can be separated without dissection. Their four pairs of chromosomes include easily identifiable polytene chromosomes in the salivary glands — a cytological feature that made possible many of the early discoveries of gene location and recombination. Importantly, many of the genes controlling body-plan development, cell signalling, neurobiology and even some disease-related pathways are conserved between flies and humans, so discoveries in flies can illuminate equivalent processes in mammals.
Understanding the Question
This is a "Suggest why..." question worth 3 marks. The stem has already given you the most important biological reasons (small, short life cycle, easy to sex, similar genes to humans); the mark scheme is checking that you can turn those bullet-point facts into a coherent justification for using Drosophila in current research. You only need any three creditable ideas, and each must be a distinct point — repeating the same idea in different words scores once.
Approach
Treat each property mentioned in the stem as a starting point and ask "what does this property let me do that I could not easily do with a mouse, a fish or a plant?" Smallness, cheapness, ease of sexing, fast generation turnover, controlled mating and human-gene similarity are all the examiner is after. The trap is to restate the property without saying what it enables.
Step-by-Step Reasoning
- Small size and low cost — Drosophila adults are only about 3 mm long. They can therefore be housed in small vials, requiring little bench space and minimal food. This keeps maintenance cheap, so a lab can keep tens of thousands of flies simultaneously. Award: 1 mark.
- Easy to sex and to set up controlled crosses — males and females can be distinguished visually (males have a darker, more rounded abdomen and sex combs on the forelegs), so the experimenter can select parents for mating without dissection. This is essential for controlled Mendelian crosses. Award: 1 mark.
- Many offspring and short life cycle — a single pair can produce hundreds of offspring and the generation time is only about 10 days, so several generations can be studied in a few weeks. Statistically meaningful numbers of progeny are easy to obtain, allowing Mendelian ratios and linkage distances to be calculated. Award: 1 mark.
- Conserved genes relevant to human disease — many developmental, cell-signalling and disease-related genes have homologues in humans, so findings about gene function in Drosophila can be extrapolated to human biology, including research into cancer and named neurodegenerative diseases such as Parkinson's or Alzheimer's. Award: 1 mark (alternative to point 3 if already credited).
- AVP — other credit-worthy points include: the giant polytene chromosomes in the salivary glands, ethical acceptability compared with vertebrate models, well-mapped genome since 2000, abundant balancer chromosomes, ease of EMS mutagenesis.
Key Takeaways
- A good "model organism" answer turns a list of facts into a list of research advantages — what each property lets the scientist actually do.
- Drosophila is the classical dihybrid-cross organism: any one credit-worthy answer should mention the generation of large offspring numbers in a short time.
- Linking flies to human disease research is a high-yield credit point on current Cambridge A-level mark schemes.
Common Mistakes
- Restating a property without saying what it enables (e.g. just writing "they are small" without saying "so they can be kept in large numbers cheaply").
- Saying "they have similar genes to humans" alone without a research consequence (must link to disease research or a specific function).
- Treating any one bullet as if it were worth all three marks — each independent point earns only 1 mark.
- Quoting only the bullet from the stem and not converting it into a research advantage.
Things to Be Careful About
- Three marks means three independent creditable points; repeating one idea in different words scores once.
- AVP means a valid additional point that the mark scheme has not anticipated — but it must still be biologically correct.
- The question is worth 3 marks, so do not write more than three or four separate ideas; quality over quantity.
When a wild type fruit fly was crossed with a mutant fruit fly with a black body and short wings, all the F1 offspring had grey bodies and long wings.
Using appropriate symbols, complete Fig. 5.2 to show the expected results of a cross between two of these F1 fruit flies.
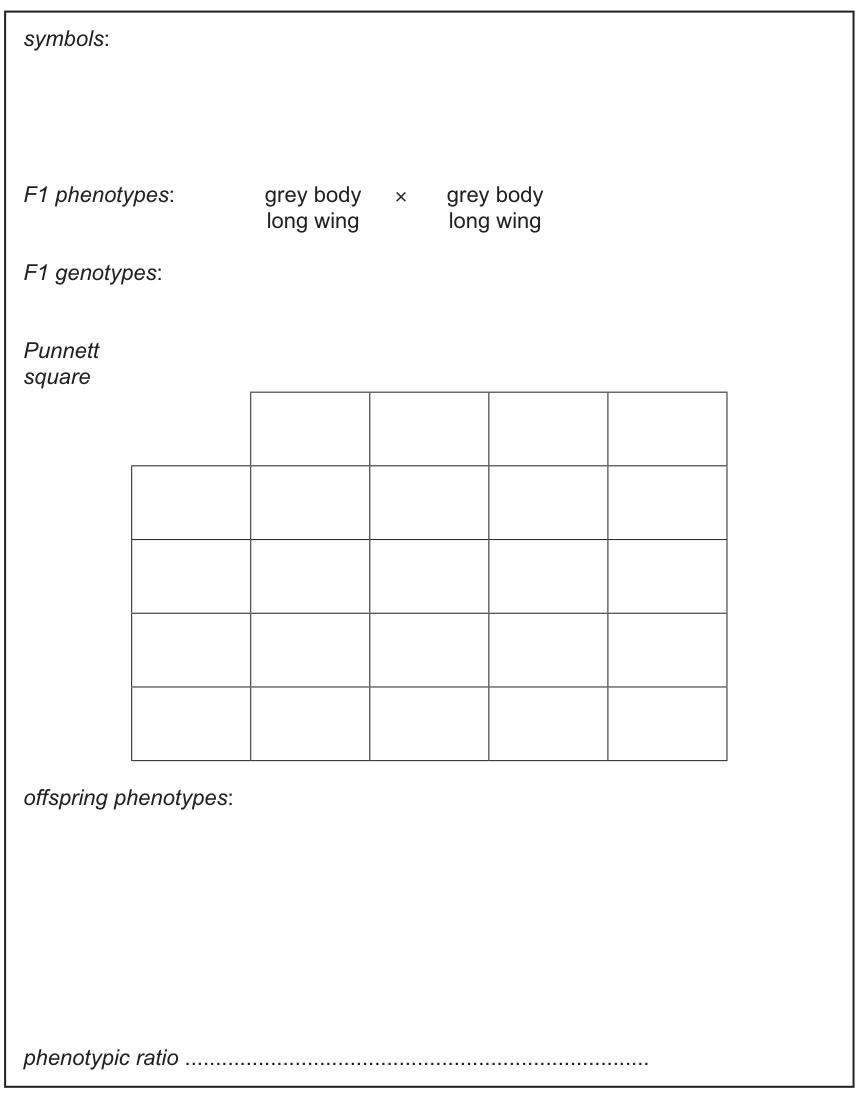
Working
Symbols
- = grey body, = black body
- = long wing, = short wing
F1 phenotypes: grey body, long wing grey body, long wing
F1 genotypes:
Gametes (each F1 parent): , , ,
Punnett square (completed in Fig. 5.2):
| AABB | AABb | AaBB | AaBb | |
| AABb | AAbb | AaBb | Aabb | |
| AaBB | AaBb | aaBB | aaBb | |
| AaBb | Aabb | aaBb | aabb |
F2 offspring phenotypes (with count out of 16)
- 9 grey body, long wing
- 3 grey body, short wing
- 3 black body, long wing
- 1 black body, short wing
Answer
Phenotypic ratio (grey body, long wing : grey body, short wing : black body, long wing : black body, short wing).
9:3:3:1 (grey long : grey short : black long : black short)
Background Concept
A dihybrid cross follows the inheritance of two different genes simultaneously. When the two genes are on different chromosomes (as the stem states for body colour and wing length in Drosophila), the alleles assort independently at meiosis I, so a heterozygote produces four equally frequent gamete types: , , and , each at a frequency of . The expected offspring phenotypic ratio from a dihybrid cross between two double heterozygotes is therefore when both genes show simple complete dominance. The 9 represents the double-dominant class, the two 3s are the two single-recessive classes, and the 1 is the double-recessive class.
Understanding the Question
The stem tells you that the parental (P) cross — wild type (grey, long) mutant (black, short) — gave F1 offspring that are ALL grey-bodied and long-winged. This means both mutant traits are recessive to the wild-type traits. So the F1 are all heterozygous at both loci (), and the question asks you to complete the Punnett square for an F1 F1 cross and read off the F2 phenotypic ratio. The 4x4 grid is already printed in Fig. 5.2; you must fill in the gametes and the sixteen offspring genotypes.
Approach
- Define the symbols for the two gene pairs (one letter per gene, upper case for dominant, lower case for recessive).
- State the F1 genotypes (both are because each F1 received and from the wild-type parent and and from the mutant parent).
- List the four gamete types each F1 parent can produce by independent assortment.
- Fill in the 4x4 Punnett square by combining the row and column gametes (one from each parent).
- Group the 16 offspring by phenotype and read off the ratio.
Step-by-Step Reasoning
1. Symbols (1 mark) — Use the conventional letter: dominant allele in upper case, recessive in lower case, with the same letter for alleles of the same gene. Cambridge examiners accept for body colour and for wing length (or any consistent pair), as long as the same letter is not reused for both genes.
2. F1 genotypes (1 mark) — The P cross was (homozygous dominant homozygous recessive). The F1 are therefore at both loci. Both parents in this question are F1, so write .
3. Gametes — Independent assortment means each F1 makes the four gametes , , , in equal proportions (Mendel's second law). The same four gametes appear along the top and along the left of the Punnett square.
4. Punnett square (2–3 marks) — Each of the 16 cells is the fusion of one gamete from each parent:
| AB | Ab | aB | ab | |
|---|---|---|---|---|
| AB | AABB | AABb | AaBB | AaBb |
| Ab | AABb | AAbb | AaBb | Aabb |
| aB | AaBB | AaBb | aaBB | aaBb |
| ab | AaBb | Aabb | aaBb | aabb |
Counting the cells by phenotype:
- Grey body, long wing (at least one AND at least one ): 9 cells (AABB, AABb, AaBB, AaBb in their various combinations).
- Grey body, short wing (at least one AND ): 3 cells (AAbb, Aabb, Aabb — note Aabb appears twice but the cell is one box).
- Black body, long wing ( AND at least one ): 3 cells (aaBB, aaBb, aaBb).
- Black body, short wing (): 1 cell.
5. Phenotypic ratio (1 mark) — , written in the order grey-long : grey-short : black-long : black-short.
6. Phenotype names (1 mark) — The four phenotype classes must be named in the order corresponding to the ratio: grey body long wing, grey body short wing, black body long wing, black body short wing.
Key Takeaways
- A dihybrid cross between two double heterozygotes gives a phenotypic ratio provided the two genes assort independently (different chromosomes or far apart on the same chromosome) and both genes show simple complete dominance.
- The ratio is a probability statement; in a real cross of 16 offspring the observed counts are usually close to but not exactly 9, 3, 3 and 1.
- The Punnett square is a tidy way to enumerate every possible fusion of gametes; the four 1/4-frequency gamete classes from each parent give equally likely offspring genotypes.
Common Mistakes
- Writing only one gene pair's symbols, or using the same letter for both genes (e.g. for body colour and for wing length) — this loses the symbol mark.
- Forgetting to include the gametes on both axes of the Punnett square.
- Transposing the Punnett square (e.g. putting the F1 genotypes in the cells instead of the F2 offspring genotypes).
- Quoting the ratio in the wrong order or omitting the four phenotype names. The mark scheme credits only the order grey long : grey short : black long : black short.
- Confusing independent assortment with linkage: the stem explicitly says the two genes are on different chromosomes, so independent assortment applies and the ratio is correct.
Things to Be Careful About
- The cross in this question is F1 F1, not a test cross. The F2 ratio of only holds for a dihybrid cross, not for a test cross (which gives with a double-homozygous-recessive partner).
- A correct Punnett square must contain 16 different genotype cells, even though some genotypes (e.g. ) appear more than once. Examiners check both the layout and the cell contents.
- Always write the phenotypic ratio in the order that matches the question's phenotype list (here: grey long, grey short, black long, black short) — the examiner will not rearrange your numbers to fit.
- The square drawn on the paper is the candidate's own work; the printed grid in Fig. 5.2 is a template, not a marked answer.
Describe how you would determine the genotype of an F2 fruit fly with a grey body and long wings.
Answer
- Carry out a test cross by mating the F2 grey-body long-wing fly with a double homozygous-recessive fly (black body, short wing, ).
- If some offspring have a black body, the F2 fly is heterozygous for body colour (); if all offspring have a grey body, the F2 fly is homozygous dominant for body colour ().
- If some offspring have short wings, the F2 fly is heterozygous for wing length (); if all offspring have long wings, the F2 fly is homozygous dominant for wing length ().
Test cross the F2 grey-long fly with a double homozygous-recessive (aabb) fly; presence of any recessive-phenotype offspring at a locus shows the F2 parent is heterozygous at that locus, while all dominant-phenotype offspring shows it is homozygous dominant.
Background Concept
A test cross is a cross between an organism showing the dominant phenotype and an organism that is homozygous recessive for the gene(s) of interest. The homozygous-recessive partner can only contribute recessive alleles ( and ) to the offspring, so the phenotype of the offspring reveals the unknown allele(s) carried by the dominant-phenotype parent. If the dominant-phenotype parent is homozygous ( or ), every offspring receives at least one dominant allele and shows the dominant phenotype. If the parent is heterozygous ( or ), on average half the offspring inherit the recessive allele and show the recessive phenotype. Because the partner contributes only recessive alleles at every locus, a single test cross with a double-recessive partner can resolve zygosity at both genes simultaneously.
Understanding the Question
The question gives you a single F2 fruit fly whose phenotype is grey body and long wings (the two dominant traits). Because the F2 generation of a dihybrid cross contains a mixture of , , and flies all with the same grey-long phenotype, you cannot tell the genotype from the phenotype alone. The question asks you to describe a procedure that would let you work out which of those four genotypes your fly actually has. Three marks are available: one for naming the cross, plus two for the interpretation (one mark each for body colour and wing length, or two for whichever genes the examiner credits).
Approach
- Identify the cross to perform: a test cross with a fly homozygous recessive for both genes (because the unknown fly's genotype is unknown at both genes).
- State the expected offspring if the unknown fly is homozygous at each locus (all dominant-phenotype offspring) versus heterozygous (approximately 50% recessive-phenotype offspring).
- Read off the unknown fly's genotype from which recessive phenotypes actually appear in the offspring.
Step-by-Step Reasoning
- The cross — Cross the unknown grey-long F2 fly with a fly that is homozygous recessive for both genes: (black body, short wings). The double-recessive partner is available among the F2 itself (the 1-in-16 black-short class from part (b)). Award: 1 mark.
- Interpretation for body colour — Look at the offspring body colours:
- If any offspring are black-bodied, the grey-bodied parent must have been carrying an allele, so it is .
- If all offspring are grey-bodied, the grey-bodied parent was (it had no to pass on).
Award: 1 mark.
- Interpretation for wing length — Look at the offspring wing lengths:
- If any offspring are short-winged, the long-winged parent must have been carrying a allele, so it is .
- If all offspring are long-winged, the long-winged parent was .
Award: 1 mark.
Either of the two interpretation points can be credited in either order; examiners credit any two of the four body-colour or wing-length statements.
Key Takeaways
- A test cross with a single homozygous-recessive partner can resolve the zygosity at multiple genes simultaneously because the partner contributes only recessive alleles at every locus.
- The key diagnostic is the presence of recessive offspring, not their proportion: even a single recessive-phenotype fly is enough to conclude the unknown parent is heterozygous at that locus.
- "Describe how" questions on test crosses require (a) the type of cross and the genotype of the partner, and (b) the interpretation rule for at least one gene.
Common Mistakes
- Suggesting a cross with a fly that is recessive at only one gene (e.g. just for body colour). This works for body colour but cannot resolve wing length; the mark scheme wants a double homozygous-recessive partner so both genes are tested at once.
- Writing "cross with a heterozygous fly" — this is not a test cross and does not give a clean Mendelian ratio.
- Failing to state what the offspring phenotypes would tell you. The mark scheme gives a separate mark for the interpretation, so the description must include "if some offspring show the recessive trait, the parent is heterozygous; if all show the dominant trait, the parent is homozygous dominant".
- Conflating the test cross (used in F2) with the F1 x F1 cross (used to generate the F2). The F1 x F1 cross is not a test cross because the F1 is not homozygous recessive.
Things to Be Careful About
- The unknown fly is phenotypically grey-bodied and long-winged. There is no way to tell its genotype by inspection; the test cross is the only reliable method on the syllabus.
- The mark scheme credits the test cross as the first mark and the interpretations as the next two marks. A common reason candidates score only 1 is that they describe the cross but never say how the offspring would be read.
- "Describe how you would determine..." means describe the experimental procedure, not just state the principle. You should explicitly say which fly is crossed with which and what result would tell you which genotype.
- For full marks, both gene pairs must be addressed in the interpretation. If you only interpret one of the two genes, you score only 2 of the 3 marks.
Some people can develop a condition called type 2 diabetes. In people with type 2 diabetes, glucose uptake from the blood is decreased. In some cases, the pancreas cannot make enough insulin to keep blood glucose concentration within a healthy range.
A person with type 2 diabetes and a person without type 2 diabetes were given a glucose drink. The blood glucose concentration of each person was measured at regular intervals for 120 minutes.
The results are shown in Fig. 6.1.
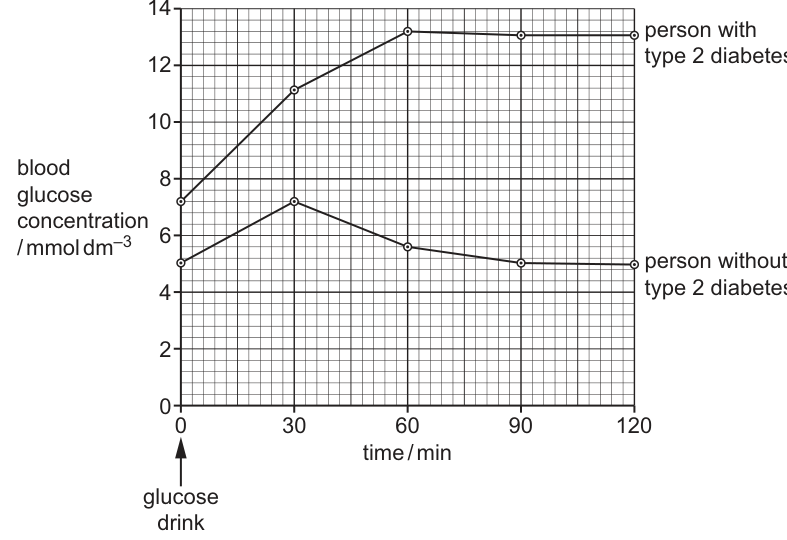
Answer
- Blood glucose concentration rises (from 5 mmol dm⁻³) to a peak of 7.5 mmol dm⁻³ at 30 minutes.
- It then decreases, returning to the original value of 5 mmol dm⁻³ by 90 minutes.
Rises to a peak at 30 minutes, then decreases back to 5 mmol dm⁻³ by 90 minutes.
Background Concept
Blood glucose concentration is tightly regulated in healthy individuals by the opposing actions of insulin (which lowers blood glucose) and glucagon (which raises it). After a glucose load, β-cells in the islets of Langerhans detect the rise in blood glucose and secrete insulin. Insulin promotes the uptake of glucose by muscle and adipose tissue (via GLUT4 transporters) and stimulates glycogenesis (glycogen synthesis) in the liver, lowering blood glucose back towards the set point (~5 mmol dm⁻³). In a person without type 2 diabetes, this response is rapid, effective and tightly controlled.
Understanding the Question
The question asks you to describe the shape of the curve for the person without type 2 diabetes in Fig. 6.1. The graph plots blood glucose concentration (y-axis) against time (x-axis) for 120 minutes after a glucose drink at time 0. You need to identify the key features: the direction of change, the timing of the peak, and the timing of the return to baseline.
Approach
Look at the lower curve (the non-diabetic person) and identify: (1) what happens immediately after the glucose drink; (2) when the peak occurs; (3) what happens after the peak; (4) when the curve returns to its starting value.
Step-by-Step Reasoning
- At time 0, the non-diabetic person's blood glucose concentration is 5 mmol dm⁻³ (the fasting baseline).
- After the glucose drink, glucose is absorbed from the gut into the bloodstream, so blood glucose concentration increases.
- The concentration reaches a peak of 7.5 mmol dm⁻³ at 30 minutes.
- The rise is detected by β-cells in the pancreas, which release insulin.
- Insulin promotes glucose uptake by cells (especially muscle and adipose tissue) and glycogenesis in the liver.
- As a result, blood glucose concentration decreases after the peak.
- By 90 minutes, blood glucose has returned to its original value of 5 mmol dm⁻³.
- It stays at this level (around 5 mmol dm⁻³) for the rest of the experiment (up to 120 min).
The two marking points are: (1) blood glucose concentration increases until 30 minutes; (2) it then decreases to the original value / returns to 5 mmol dm⁻³ by 90 minutes.
Key Takeaways
- A healthy person responds to a glucose load by secreting insulin, which rapidly brings blood glucose back to baseline.
- The peak is small (only +2.5 mmol dm⁻³ above baseline) and short-lived.
- This rapid, effective negative feedback response is what is impaired in people with type 2 diabetes (compare with the upper curve).
Common Mistakes
- Vague descriptions like "goes up then down" without specifying when the peak occurs or when the curve returns to baseline.
- Saying "returns to normal" without giving the value (5 mmol dm⁻³) or the time (90 minutes).
- Confusing the diabetic and non-diabetic curves — the non-diabetic curve is the lower one with the smaller, sharper peak.
- Forgetting that the peak is at 30 minutes (not 60 minutes, which is the peak for the diabetic person).
Things to Be Careful About
- Use specific values (5 mmol dm⁻³) and times (30 min, 90 min) in your description.
- The two mark-scheme points are: (1) increases until 30 minutes; (2) decreases to original value / 5 mmol dm⁻³ by 90 minutes. Both points are required for the 2 marks.
- The curve does NOT return to baseline at 120 minutes — it returns at 90 minutes and stays there.
Calculate the percentage increase in blood glucose concentration, between 0 and 60 minutes, for the person with type 2 diabetes.
answer ______
Working
Percentage increase = ((final value − initial value) / initial value) × 100
Reading from Fig. 6.1 (diabetic curve):
- Initial value at 0 min = 6 mmol dm⁻³
- Final value at 60 min = 11 mmol dm⁻³
Answer
83.3%
83.3%
Background Concept
Percentage increase is a way of expressing a change in a quantity as a proportion of the original (initial) value. The formula is:
This is different from the absolute increase (final − initial) and from percentage point increase. It is widely used in biology and medicine to compare relative changes between quantities that start at different levels (e.g. comparing blood glucose responses in two people whose baselines differ).
Understanding the Question
You need to calculate the percentage increase in blood glucose concentration between 0 and 60 minutes for the person with type 2 diabetes. The two values must be read from Fig. 6.1 for the upper (diabetic) curve, and the answer must be entered in the box provided.
Approach
- Read the initial value (at 0 min) from the diabetic curve.
- Read the final value (at 60 min) from the diabetic curve.
- Substitute into the percentage increase formula and calculate.
Step-by-Step Reasoning
- From Fig. 6.1, the diabetic person's blood glucose concentration at 0 min is 6 mmol dm⁻³.
- At 60 min, the concentration has risen to 11 mmol dm⁻³.
- The absolute increase is 11 − 6 = 5 mmol dm⁻³.
- Apply the percentage increase formula:
The mark scheme awards: 1 mark for the working (the formula or the substitution of values) and 1 mark for the correct final answer of 83.3%.
Key Takeaways
- Percentage increase = ((final − initial) / initial) × 100.
- Quote the answer to 3 significant figures (83.3%, not 83% or 83.33%).
- Do not include units in the final answer — it is a pure percentage.
- The diabetic person's blood glucose rises much more steeply (and stays high) compared with the non-diabetic person, who returns to baseline within 90 minutes.
Common Mistakes
- Reading the wrong curve — using the non-diabetic values (5 → 7.5) would give 50%, not 83.3%.
- Confusing percentage increase with absolute increase — 5 mmol dm⁻³ is the absolute increase, not the percentage.
- Forgetting to multiply by 100, which would give 0.83 (a ratio, not a percentage).
- Including units in the final answer (e.g. 83.3% mmol dm⁻³).
- Giving too few or too many significant figures (the mark scheme accepts 83.3% to 3 s.f.).
Things to Be Careful About
- Read the values carefully from the graph — the y-axis has major gridlines at every 2 units.
- The answer is 83.3% (to 3 significant figures), not 83% or 83.33%.
- Make sure to use the diabetic curve (the upper one), not the non-diabetic curve (the lower one).
- The two mark-scheme points are awarded for: the working/substitution, and the correct numerical answer.
Suggest ways in which people with type 2 diabetes can help to control their condition.
Answer
Any two from:
- Reduce intake of (named) carbohydrate / sugar in the diet ;
- Take regular physical exercise ;
- Inject insulin ;
- AVP e.g. weight loss, oral medications such as metformin, regular blood glucose monitoring.
Reduce intake of carbohydrate; take regular physical exercise; inject insulin.
Background Concept
Type 2 diabetes is a condition in which the body's cells become resistant to insulin, or the pancreas cannot produce enough insulin to maintain normal blood glucose levels. The goal of management is to keep blood glucose concentration within a healthy range (typically 4–7 mmol dm⁻³ before meals). This is achieved through a combination of lifestyle changes (diet, exercise, weight loss) and medical interventions (insulin injections, oral medications such as metformin).
Understanding the Question
The question asks for ways that people with type 2 diabetes can help control their condition. This is an open-ended question, and any reasonable, specific suggestion is acceptable. The mark scheme requires any two from a list of four options, and the remaining marks are gained from any other valid point (AVP).
Approach
Think about what causes high blood glucose in type 2 diabetes and what can be done to lower it. Consider both lifestyle changes (diet, exercise) and medical interventions (insulin, medication). The most common interventions are diet, exercise, and insulin — these are the three most likely answers.
Step-by-Step Reasoning
The four creditable answers are:
- Reduce intake of (named) carbohydrate / sugar — fewer carbohydrates in the diet means less glucose entering the bloodstream after meals, which reduces the post-meal blood glucose spike. This directly addresses the cause of the elevated blood glucose shown in Fig. 6.1.
- Physical exercise — exercise increases the uptake of glucose by muscle cells (via insulin-independent mechanisms, e.g. GLUT4 translocation to the membrane). This lowers blood glucose even when insulin levels are low or insulin sensitivity is reduced.
- Inject insulin — supplementing the body's own insulin production helps to lower blood glucose by promoting glucose uptake into cells. Insulin is the most direct medical intervention for type 2 diabetes.
- AVP — other valid points include: weight loss (improves insulin sensitivity), oral medications such as metformin (reduce hepatic glucose production and increase insulin sensitivity), regular blood glucose monitoring (helps with self-management).
Any two of these earn the 2 marks.
Key Takeaways
- Type 2 diabetes is managed through a combination of lifestyle changes and medication.
- The aim is to keep blood glucose concentration within a healthy range.
- Lifestyle changes (diet, exercise) are usually the first line of management; medication (insulin, metformin) is added when these are insufficient.
- Weight loss is particularly effective because it improves insulin sensitivity in muscle and liver cells.
Common Mistakes
- Vague answers like "eat healthy" or "be active" without specifying how these would help control blood glucose.
- Not mentioning any specific intervention — the question asks for ways, which suggests specific actions.
- Confusing type 1 and type 2 diabetes management — both can involve insulin, but type 1 always requires insulin while type 2 can often be managed with lifestyle changes and oral medications first.
- Giving only one answer when the question asks for any two (the mark scheme awards up to 2 marks for two correct answers).
Things to Be Careful About
- Be specific in your suggestions. "Eat less sugar" is better than "eat healthy". "Reduce carbohydrate intake" is even more specific.
- The mark scheme requires any two from the list of four options; you do not need to give all four.
- AVP (any valid point) means any other reasonable suggestion will be accepted, e.g. weight loss, oral medications, regular blood glucose monitoring, pancreatic transplant (rare, but valid).
Glucagon has a role in the control of blood glucose concentration.
Describe the cell signalling pathway involving glucagon, and describe how this pathway leads to a change in the blood glucose concentration.
Answer
- Glucagon is a cell-signalling molecule / ligand / first messenger (released from α-cells of the islets of Langerhans in the pancreas) ;
- Binds to a specific receptor on the (plasma) membrane of liver (hepatocyte) cells ;
- (The receptor is a G-protein-coupled receptor, and binding) activates a G-protein associated with the receptor ;
- (The activated G-protein) activates adenylyl cyclase, which converts ATP to cyclic AMP (cAMP) ;
- cAMP acts as a (intracellular) second messenger ;
- cAMP triggers an enzyme cascade, which amplifies the signal ;
- Glycogenolysis: (glycogen phosphorylase) hydrolyses glycogen to glucose ;
- Gluconeogenesis: amino acids (and glycerol from triglycerides) are converted to glucose ;
- Glucose is released from the liver cells into the blood, raising blood glucose concentration ;
- AVP e.g. ref to specific enzymes (phosphorylase kinase, protein kinase A).
Glucagon binds to receptors on liver cell membranes, activating a G-protein and adenylyl cyclase to produce cAMP (second messenger). An enzyme cascade amplifies the signal, activating glycogenolysis (and gluconeogenesis), so glucose is released into the blood and blood glucose concentration rises.
Background Concept
Glucagon is a peptide hormone (29 amino acids) produced by the α-cells of the islets of Langerhans in the pancreas. It is released in response to low blood glucose concentration (e.g. during fasting, between meals, or during exercise) and acts to raise blood glucose. The main target cells for glucagon are hepatocytes (liver cells). Because glucagon is hydrophilic (peptide), it cannot cross the plasma membrane, so it acts via a cell-surface receptor and an intracellular second messenger (cyclic AMP, cAMP). The signal is amplified through an enzyme cascade, allowing a small hormonal signal to produce a large metabolic response.
Understanding the Question
The question asks you to describe the cell signalling pathway involving glucagon and explain how this pathway leads to a change in blood glucose concentration. You need seven linked points covering: the nature of glucagon as a signal (first messenger), its receptor, the second messenger system, the enzyme cascade, the metabolic consequences (glycogenolysis and gluconeogenesis), and the final outcome (glucose release into the blood).
Approach
Trace the pathway step by step, starting with glucagon as the first messenger and ending with glucose release. The sequence is:
Glucagon (first messenger) → binds to GPCR on liver cell membrane → activates G-protein → activates adenylyl cyclase → produces cAMP (second messenger) → activates protein kinase A → enzyme cascade (phosphorylase kinase → glycogen phosphorylase) → glycogenolysis (and gluconeogenesis) → glucose released into blood → blood glucose rises.
Step-by-Step Reasoning
1. Glucagon as the first messenger:
Glucagon is a cell-signalling molecule (a ligand / first messenger). It is released from α-cells of the pancreatic islets when blood glucose falls below the set point. Because it is a peptide hormone, it is hydrophilic and cannot cross the plasma membrane — so it must act via a cell-surface receptor.
2. Receptor binding:
Glucagon binds to a specific receptor on the plasma membrane of liver (hepatocyte) cells. The receptor is a seven-transmembrane-domain G-protein-coupled receptor (GPCR).
3. G-protein activation:
The binding of glucagon causes a conformational change in the receptor, which activates a G-protein (specifically G_s) associated with the cytoplasmic side of the receptor. The α-subunit of the G-protein exchanges GDP for GTP and dissociates from the βγ-subunits.
4. Adenylyl cyclase activation and cAMP formation:
The activated G-protein α-subunit diffuses along the membrane and activates adenylyl cyclase, an enzyme embedded in the plasma membrane. Adenylyl cyclase converts ATP into cyclic AMP (cAMP).
5. cAMP as the second messenger:
cAMP is the intracellular second messenger. It relays the signal from the plasma membrane (where the hormone acts) to enzymes inside the cell (where the metabolic response occurs). It is short-lived, being rapidly broken down by phosphodiesterase.
6. Enzyme cascade and signal amplification:
cAMP activates protein kinase A (PKA), which phosphorylates and activates phosphorylase kinase. Phosphorylase kinase in turn phosphorylates and activates glycogen phosphorylase. This enzyme cascade greatly amplifies the original signal — one glucagon molecule can lead to the production of many thousands of glucose molecules.
7. Glycogenolysis:
Activated glycogen phosphorylase catalyses the hydrolysis of glycogen to glucose-1-phosphate (which is then converted to glucose-6-phosphate by phosphoglucomutase and finally to free glucose by glucose-6-phosphatase) in the liver. This process is called glycogenolysis. Skeletal muscle lacks glucose-6-phosphatase, so muscle glycogen cannot directly raise blood glucose.
8. Gluconeogenesis:
In addition, the cAMP/PKA cascade stimulates gluconeogenesis — the synthesis of glucose from non-carbohydrate precursors, such as amino acids (from protein, especially alanine) and glycerol (from triglycerides in adipose tissue). This is a longer-term mechanism for raising blood glucose.
9. Glucose release into the blood:
The glucose produced by glycogenolysis and gluconeogenesis is released from the liver cells into the bloodstream. This raises the blood glucose concentration back towards the set point, completing the negative feedback loop (the rise in blood glucose then inhibits further glucagon release).
The mark scheme awards up to 7 marks for any seven of these points (plus an AVP for any other valid point, e.g. naming specific enzymes like phosphorylase kinase or protein kinase A).
Key Takeaways
- Glucagon raises blood glucose through a cell signalling pathway involving cAMP as a second messenger.
- The pathway amplifies the signal through an enzyme cascade, allowing a small hormonal signal to produce a large metabolic response.
- The main target organ is the liver, where glucagon stimulates glycogenolysis (breakdown of glycogen) and gluconeogenesis (synthesis of glucose from non-carbohydrate precursors).
- This is a classic example of a hydrophilic hormone acting via a cell-surface receptor and second messenger (in contrast to hydrophobic hormones like steroids, which enter the cell and bind intracellular receptors).
- The cAMP cascade is a recurring motif in cell signalling — it is also used by adrenaline (epinephrine) acting on liver and muscle cells.
Common Mistakes
- Confusing glucagon with insulin — insulin lowers blood glucose (via glucose uptake and glycogenesis), while glucagon raises it (via glycogenolysis and gluconeogenesis). They have opposite effects.
- Saying glucagon enters the cell — peptide hormones cannot cross the plasma membrane; they act via cell-surface receptors and second messengers.
- Missing the second messenger step — the pathway must explicitly include cAMP as a second messenger; this is the key feature of the cAMP pathway.
- Not mentioning the enzyme cascade / signal amplification — this is a defining feature of the pathway and worth a mark in its own right.
- Forgetting gluconeogenesis — the pathway includes both glycogenolysis and gluconeogenesis; mentioning only one loses a mark.
- Not specifying liver cells — the target tissue for glucagon is the liver, not muscle or other tissues (although muscle also has glucagon receptors, the effect on blood glucose is via the liver).
- Saying glucagon directly hydrolyses glycogen — glucagon does not catalyse any reaction itself; it acts via the cAMP cascade which activates glycogen phosphorylase.
Things to Be Careful About
- The exact sequence of events is important: glucagon → receptor → G-protein → adenylyl cyclase → cAMP → enzyme cascade → glycogenolysis / gluconeogenesis → glucose release.
- cAMP is the second messenger; glucagon is the first messenger. Do not confuse the two.
- Glycogenolysis is the breakdown of glycogen to glucose; gluconeogenesis is the synthesis of glucose from non-carbohydrate precursors (amino acids, glycerol). Do not confuse the two.
- The pathway amplifies the signal — one glucagon molecule can lead to the release of many glucose molecules. This is a key feature and worth mentioning.
- The mark scheme accepts 7 points from a list of 9 — you do not need to give all 9, but you do need to cover the key steps (especially the second messenger and the enzyme cascade).
The kakapo, Strigops habroptila, is a species of large, nocturnal (active at night) parrot and is found only in New Zealand. The bird does not fly and lives on the ground.
The kakapo is classified as critically endangered on the International Union for Conservation of Nature (IUCN) Red List of Threatened Species™.
Fig. 7.1 shows a kakapo.
Complete Table 7.1 to show the classification of the kakapo.
Table 7.1
| taxonomic group | name |
|---|---|
| domain | Eukarya |
| kingdom | Animalia |
| ______________ | Chordata |
| class | Aves |
| ______________ | Psittaciformes |
| family | Strigopidae |
| genus | ______________ |
Answer
- Row 3: phylum
- Row 5: order
- Genus: Strigops
phylum ; order ; Strigops
Background Concept
Living organisms are classified using the Linnaean hierarchy, a nested series of taxonomic ranks. The principal ranks in order are: domain, kingdom, phylum, class, order, family, genus, species. The two-part italicised name (Strigops habroptila) is the binomial name; the first word is the genus and the second is the specific epithet. A mnemonic such as "King Philip Came Over For Good Soup" is the standard way to remember the order of the ranks.
Understanding the Question
The question gives a partially completed classification table for the kakapo. Three cells are blank: one corresponds to a missing rank label between kingdom and class, one to a missing rank between class and family, and one to the actual name of the genus. The binomial name is already printed at the start of the question, so the genus can be read directly from there.
Approach
- Look at where each blank sits in the hierarchy to identify which rank is missing. Between kingdom (Animalia) and class (Aves) the missing rank is phylum; between class (Aves) and family (Strigopidae) the missing rank is order.
- For the genus, take the first word of the binomial Strigops habroptila and write it in italics with a capital initial letter.
Step-by-Step Reasoning
- The table is laid out domain → kingdom → (blank) → class → (blank) → family → (blank). Filling in the standard Linnaean order, the blanks are phylum, order, genus.
- The genus is the first part of the binomial name given in the question stem, Strigops. It is written in italics (or underlined) with an initial capital letter; the species name is written separately in lower case italics.
- Chordata is the phylum for animals with a notochord (and in vertebrates, a backbone). Psittaciformes is the parrot order, the family Strigopidae contains the New Zealand parrots including the kakapo and kaka, and the genus Strigops contains the single living species S. habroptila.
Key Takeaways
- The Linnaean hierarchy: domain → kingdom → phylum → class → order → family → genus → species.
- The genus name is the FIRST word of the binomial and must be italicised with a capital letter.
- The phylum for all vertebrates (animals with a backbone) is Chordata.
Common Mistakes
- Writing "division" instead of "phylum" — division is the botanical equivalent, used for plant phyla; animals use phylum.
- Lower-casing the genus (strigops) or failing to italicise it.
- Writing the full binomial Strigops habroptila in the genus box instead of just Strigops.
- Confusing "order" with "family" because the two rank labels look similar in the list.
Things to Be Careful About
Italicisation matters: a genus name that is not italicised may be penalised. Always match the exact rank to its position in the hierarchy. The question already provides kingdom Animalia and class Aves, so the two missing ranks must be phylum and order in that order.
The kakapo was widely distributed before humans arrived in New Zealand. The Kakapo Recovery Programme started in 1995. Birds were moved to protected areas. In 2024 they were only found in these protected areas.
This is shown in Fig. 7.2.
Suggest the ideal features of a protected area for the kakapo.
Answer
Any three of:
- no / few humans present
- no / few predators
- sufficient vegetation / food supply
- places to hide during the day
- AVP (e.g. appropriate climate, large enough area, low risk of disease introduction).
no/few humans ; no/few predators ; sufficient food/vegetation ; places to hide in the day
Background Concept
In-situ conservation of an endangered species depends on choosing a reserve that removes the causes of the original decline and provides the resources the species needs to survive and breed. For a flightless, ground-dwelling, nocturnal bird, the threats and requirements are particular: the species cannot escape ground predators by flying, and it sleeps by day, so it needs daytime cover.
Understanding the Question
The stem tells us that kakapo were widespread before humans arrived and that the current population survives only on protected offshore islands (Fig. 7.2). The birds do not fly and are nocturnal, so they are particularly vulnerable to mammalian predators and to human disturbance. The command word is "suggest", so any reasonable feature of a suitable protected area scores, as long as it is justified by the biology given.
Approach
List the threats the species faces (humans and introduced predators are the obvious ones, because the decline coincided with human arrival) and the resources it needs (food and shelter, since it is herbivorous and hides by day). A valid protected area must therefore be free of the threats and provide the resources.
Step-by-Step Reasoning
- Few or no humans: humans are linked to the decline (the population shrank after human arrival, so hunting, habitat destruction, or disturbance by humans are likely contributors). The offshore islands in Fig. 7.2 are largely uninhabited.
- Few or no predators: the kakapo is flightless and ground-dwelling, so it cannot escape introduced mammals such as cats, stoats, rats and dogs, all of which were brought to New Zealand by humans.
- Sufficient vegetation / food: the kakapo is herbivorous, eating leaves, fruits, seeds and rhizomes. A protected area must support a viable plant community of these food plants year-round.
- Places to hide during the day: the kakapo is nocturnal and shelters in burrows, hollows or under vegetation during daylight. A reserve must contain dense ground vegetation, burrows or tree hollows to provide daytime refuge.
- A fourth reasonable answer (AVP) could include: an island setting (provides a natural barrier to reinvasion by predators/humans), an area large enough to support a viable population, a climate that supports the kakapo's preferred forest, or quarantine measures to prevent new predator/disease introductions.
Key Takeaways
- A good reserve removes the original cause(s) of decline and provides the resources the species needs.
- For flightless, ground-dwelling, nocturnal species, removal of mammalian predators and provision of daytime cover are the two most important reserve features.
- The offshore-island strategy used for the kakapo is a classic ex-situ-style, in-situ conservation method because islands are isolated from reinvasion by predators and humans.
Common Mistakes
- Vague answers like "safe" or "no danger" — the mark scheme requires specific threats (humans, predators) and specific resources (food, shelter).
- Saying "large area" or "good habitat" without saying what makes the habitat good (food plants, daytime cover).
- Mentioning breeding programmes / zoos — these are not features of the area itself.
- Confusing causes of decline (introduced predators) with consequences of small population size (inbreeding) — the latter is for part (c).
Things to Be Careful About
The mark scheme accepts any three of the listed features; pick the three that are most directly justified by the information in the stem (no/few humans, no/few predators, food, daytime hiding places). A fourth point may earn credit under "AVP" if it is biologically sensible.
DNA has shown that the kakapo population may have gone through one or more genetic bottlenecks after the arrival of humans in New Zealand.
Suggest the consequences of a genetic bottleneck to the kakapo population in New Zealand.
Answer
Any four of:
- inbreeding depression / low hybrid vigour
- low / decreased genetic diversity (or a small gene pool)
- disadvantageous recessive alleles (more likely to be) expressed
- infertility / low disease resistance / reduced fitness
- low ability to adapt (to environmental change) or increased risk of extinction
inbreeding depression ; reduced genetic diversity ; harmful recessive alleles expressed ; reduced fitness (infertility/disease) ; reduced ability to adapt / higher extinction risk
Background Concept
A genetic bottleneck occurs when a population is sharply reduced in size and then rebuilds from the few survivors. Because only a fraction of the original gene pool survives, allele frequencies are changed by chance (genetic drift) and overall genetic diversity is reduced. A small surviving population then tends to interbreed with close relatives, producing inbreeding, which exposes harmful recessive alleles and reduces the fitness of offspring (inbreeding depression). A small, genetically uniform population also has less raw material for natural selection to act on, so its ability to adapt to environmental change is reduced.
Understanding the Question
The stem tells us that DNA evidence suggests the kakapo has gone through one or more genetic bottlenecks since humans arrived. The command word is "suggest", so a candidate should outline the biological consequences of that reduced genetic diversity. The mark scheme rewards any four scientifically sound points that follow from a bottleneck.
Approach
Chain the reasoning: bottleneck → small surviving population → small gene pool → inbreeding and expression of recessives → reduced fitness of individuals → reduced ability of the population to adapt and persist.
Step-by-Step Reasoning
- Inbreeding / inbreeding depression: when a population is small, related birds are more likely to mate. Inbreeding depression means offspring have lower fitness than outbred offspring.
- Low genetic diversity / small gene pool: a bottleneck takes a non-random sample of alleles, so the rebuilt population carries only a subset of the original variation.
- Disadvantageous recessive alleles exposed: in a large, outbred population, harmful recessive alleles are usually masked by dominants; in a small, inbred population they come together in homozygotes and are expressed.
- Reduced fitness: the consequences of the previous point are infertility, lower hatching success, weakened immune systems and lower disease resistance — all of which reduce individual fitness.
- Reduced ability to adapt / higher extinction risk: with little genetic variation, natural selection has less raw material to work on. If the environment changes (new disease, climate change, new predator), the population is less likely to contain alleles that allow some individuals to survive, so the species' risk of extinction rises.
Key Takeaways
- Bottlenecks change allele frequencies by chance and reduce genetic diversity, even if the population later recovers in size.
- Small populations suffer inbreeding depression, expressed as reduced fertility, lower hatch rates and higher juvenile mortality.
- A genetically uniform population is more vulnerable to environmental change and to novel diseases.
- Conservation programmes for bottlenecked species often include managed breeding to minimise inbreeding and reintroductions from other populations to restore variation.
Common Mistakes
- Saying "the population goes extinct" as an automatic consequence — extinction is a risk, not a certainty, and the question asks for consequences of a bottleneck, not the inevitable outcome.
- Describing the cause of a bottleneck (hunting, predators) rather than its consequences — the question gives the cause.
- Confusing bottleneck with founder effect. Both reduce diversity, but a founder effect is when a new population is started by a few individuals in a new area; a bottleneck is when an existing population is reduced and rebuilds.
- Saying "mutations will occur" — that is a source of new variation, not a consequence of a bottleneck; bottlenecks reduce existing variation.
Things to Be Careful About
Use precise language: "genetic diversity" or "gene pool" (not just "variation"), "inbreeding depression" (not just "inbreeding"), and "expression of recessive alleles" (not just "more recessive alleles"). Mark points in the mark scheme are awarded for these exact concepts, not loose paraphrases.
When the water supply to a plant is reduced, the concentration of abscisic acid (ABA) in the leaves increases.
ABA binds to receptors in the cell surface membranes of guard cells. This triggers a series of events in the cells, which results in stomatal closure.
Fig. 8.1 is a diagram of part of a guard cell showing some of the events that occur when ABA binds to its receptor.
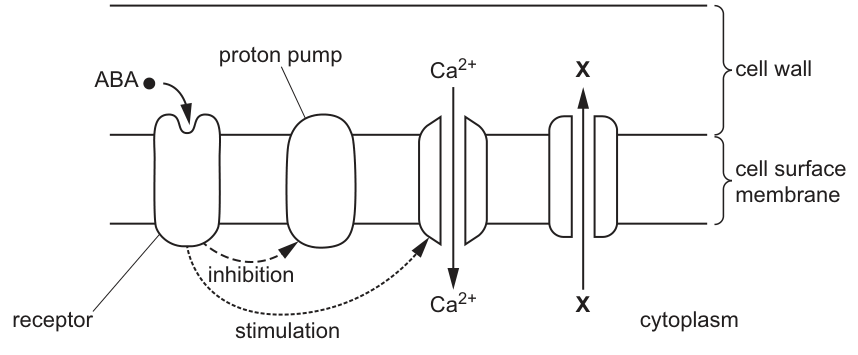
Fig. 8.1 shows that calcium ions are involved in the events within a guard cell that result in stomatal closure.
Outline the role of calcium ions in the response of the guard cell to a reduced water supply and explain how this response results in stomatal closure.
Identify X in your answer.
Answer
- acts as a second messenger inside the guard cell after ABA binds to its receptor.
- The increase in cytoplasmic concentration causes channel proteins in the cell surface membrane to open.
- = potassium ions () — these leave the guard cell through the open channels.
- The loss of (and accompanying anions) raises the water potential of the guard cell, so water leaves the cell by osmosis.
- The guard cell becomes flaccid / loses turgidity, and the stomatal pore closes.
X is potassium ions (K+); Ca2+ acts as a second messenger that opens K+ channels, K+ leaves the cell, water potential rises, water leaves by osmosis, the guard cell becomes flaccid and the stoma closes.
Background Concept
Guard cells are the specialised cells that flank each stomatal pore in the leaf epidermis. They control pore aperture by changing shape as their turgor changes: when they are turgid, the thickened inner wall is pushed into a kidney shape that bows the two guard cells apart and opens the pore; when they lose turgor, the pore closes. Turgor itself is governed by the solute concentration inside the cell — more solutes lower the water potential, water enters by osmosis and the cell swells; fewer solutes, water leaves and the cell goes flaccid.
Stomatal opening requires the active pumping of out of the guard cell by a proton pump, which hyperpolarises the membrane and opens voltage-gated channels. (with and malate counter-ions) accumulates inside, water potential falls, water enters by osmosis, the cell becomes turgid, and the pore opens.
Stomatal closure reverses this process and is triggered by the plant hormone abscisic acid (ABA), which is produced in the roots and leaves when the plant senses water deficit. ABA binds to receptors on the guard-cell plasma membrane and triggers a signal-transduction cascade in which ions act as the intracellular second messenger.
Understanding the Question
Part (a) presents Fig. 8.1, a signal-transduction diagram showing what happens when ABA binds its receptor: the proton pump is inhibited, channels are stimulated, enters the cytoplasm, and an unknown ion leaves the cell. The candidate is asked to outline the role of and explain how the response leads to stomatal closure, AND to identify . Four marks are available from five creditworthy points.
The command words are "outline" and "explain" — both require statements linked by reasoning, not isolated facts.
Approach
Trace the chain of events from the diagram in order: as second messenger → channel opening → X identified by its function in closing the stoma → change in water potential → osmotic water loss → loss of turgor → pore closes. Identify X by recognising that the cation whose efflux drives guard-cell closure is potassium.
Step-by-Step Reasoning
- as a second messenger. A second messenger is a small intracellular molecule that relays and amplifies a signal received at the cell surface. Here ABA is the first messenger; binding of ABA to its receptor triggers entry from the cell wall and from internal stores (vacuole, ER), so cytoplasmic rises sharply.
- Channel opening. The elevated cytoplasmic opens channel proteins in the cell surface membrane (and may also open anion channels that depolarise the membrane, indirectly opening further channels). Through these channels, ions leave the guard cell.
- Identifying X. The diagram shows X leaving the cell. In guard cells, the cation whose efflux drives stomatal closure is potassium (); anions such as leave with it. So .
- Water potential rises. Loss of (and its accompanying anions) reduces the solute concentration inside the guard cell, so its water potential rises (becomes less negative) relative to surrounding cells.
- Water leaves by osmosis. Water moves out of the guard cell down the water potential gradient, from the higher (less negative) water potential inside the cell to the lower (more negative) water potential in the surrounding apoplast and neighbouring cells.
- Turgor loss and pore closure. The guard cell becomes flaccid / loses turgidity. Because the inner wall is thickened and the cellulose microfibrils are radially arranged, the loss of turgor causes the cell to straighten rather than bow, and the stomatal pore closes.
Key Takeaways
- ABA is the first messenger; is the second messenger that couples ABA binding to ion efflux in the guard cell.
- (with counter-ions) leaves the cell → water potential rises → water leaves by osmosis → guard cell becomes flaccid → stoma closes. This is essentially the reverse of opening.
- The "Identify X" demand tests whether the candidate can reason from function to identity, not just memorise.
Common Mistakes
- Confusing entry with exit. enters the cytoplasm to act as a second messenger; leaves the cell.
- Stating that water enters the guard cell during closure. It leaves.
- Saying the cell "shrinks" or "dies". Guard cells simply become flaccid; the change is reversible.
- Failing to identify as . The most common wrong answer is to say is — but is shown entering the cell in the diagram, not leaving.
- Skipping the intermediate step: leaves → water potential changes → water moves by osmosis. All three steps are needed for full marks.
Things to Be Careful About
- "Water potential increases" is acceptable; "water potential becomes less negative" is more precise. Do NOT say "water potential becomes more negative" — that would mean water enters.
- The guard cell's water potential is still negative (it is in contact with dilute apoplastic solution), just less negative than before. The water potential gradient is between the guard cell and its surroundings, not relative to pure water.
- The mechanical reason the pore closes is the thickened inner wall and radial microfibril arrangement — but the marks in the mark scheme are for the osmotic / turgor change, not the wall mechanics.
Explain, using examples, why the homeostatic control involving the opening and closing of stomata is important for the efficient functioning of plants.
Answer
- Stomata must open to allow to diffuse into the leaf for use in the Calvin cycle / photosynthesis.
- Stomata must close to reduce water loss by transpiration, e.g. when the plant is in water deficit, in very hot/dry conditions, or at night when photosynthesis cannot occur.
- Homeostatic control balances these two demands, e.g. closing stomata in response to ABA when soil water is low, so that the plant keeps enough water to maintain turgidity and supply metabolic reactions.
- A daily rhythm is observed: stomata generally open in the light / during the day (when photosynthesis can occur) and close in the dark / at night, minimising water loss while is not needed.
Stomata open to admit CO2 for photosynthesis but close to limit transpiration; homeostatic control balances these demands, e.g. closure via ABA in water deficit or at night, and a daily rhythm of opening in light and closing in dark. This maintains turgidity and water for metabolism while still allowing photosynthesis.
Background Concept
Homeostasis is the maintenance of a relatively constant internal environment despite an unstable external environment. In plants, the most striking homeostatic trade-off is between photosynthesis and water loss. Both processes depend on stomata: enters through the open pore, and water vapour leaves through the same pore by transpiration. There is no way to take in without losing some water, so the plant must continuously adjust stomatal aperture to maximise photosynthetic gain per unit of water lost (an example of water-use efficiency).
Stomatal aperture is regulated by a combination of environmental signals (light, humidity, internal concentration), hormonal signals (ABA during water stress) and an endogenous circadian rhythm that pre-empts dawn and dusk. The result is dynamic, not a fixed "open" or "closed" state.
Understanding the Question
Part (b) asks the candidate to explain, with examples, why homeostatic control of stomatal opening and closing is important for the efficient functioning of plants. The command words "explain" and "using examples" mean a reason is required for each point, and at least one concrete example of a condition under which stomata open or close. Four marks are available.
Approach
Set up the trade-off first: in, water out. Then give examples of when stomata open and when they close, and link these to plant function (photosynthesis, turgor, metabolism). Mention the daily rhythm because it is the clearest example of "homeostatic control" applied systematically.
Step-by-Step Reasoning
- uptake for photosynthesis. Stomata are the entry route for atmospheric . Without open stomata, the supply to mesophyll chloroplasts is restricted and the rate of the Calvin cycle falls. Homeostatic control of aperture allows the plant to open stomata wide when light and water are plentiful and narrow them when either is limited.
- Preventing excessive water loss by transpiration. Every open stoma is a site of evaporation. Closing stomata reduces transpiration, preserving plant water status. The ABA-mediated response described in part (a) is the most important example: when soil water is low, ABA is produced and stomata close, preventing wilting.
- Examples of conditions when stomata close.
- At night, when light is absent, photosynthesis cannot use , so opening stomata would waste water.
- During water deficit, when ABA rises and triggers closure (as in part a).
- In CAM plants (e.g. Kalanchoë, pineapple), stomata open at night and close during the day, an extreme adaptation to arid environments.
- In very hot, dry or windy conditions, partial closure limits water loss.
- Maintaining turgidity and water supply for metabolism. Cell turgor is required for support in non-woody plants, for stomatal function itself, and for continued growth. By limiting water loss, homeostatic stomatal control prevents wilting and maintains the metabolic processes that depend on cell water (enzymatic reactions, transport).
- Daily rhythm. In most plants, stomata open around dawn, stay open during the day, and close around dusk. This rhythmic behaviour (controlled by an internal circadian clock and reinforced by light signals) coordinates gas exchange with photosynthetic demand and minimises unnecessary water loss at night.
- AVP — additional valid points. Examples include: transpiration-driven mass flow of water and dissolved minerals from roots to leaves; evaporative cooling of the leaf; and synchronisation of stomatal behaviour with mesophyll photosynthetic demand through internal concentration.
Key Takeaways
- Stomata mediate a trade-off between uptake and water loss; homeostatic control balances these demands.
- The system responds to environmental cues (light, water status, ) and to hormones (ABA) and shows a daily rhythm.
- Without this control, the plant would either desiccate (stomata permanently open) or starve (stomata permanently closed).
Common Mistakes
- Stating only one side of the trade-off. Both photosynthesis and water conservation must appear for full marks.
- Failing to give an example. The question says "using examples"; without one or two, marks are limited.
- Saying "stomata close to stop photosynthesis". They close to stop water loss; photosynthesis stops as a consequence.
- Confusing stomatal control with wilting: wilting is a consequence of inadequate water, not a regulatory mechanism.
- Describing stomata as a "nervous-system-like" control. Plants do not have nerves; the response is hormone- and turgor-mediated.
Things to Be Careful About
- "Open during the day and close at night" is the rule for most C3 and C4 plants, but CAM plants do the opposite — using the example of CAM shows deeper understanding.
- The question is about homeostatic control, so the answer should make the feedback nature explicit: a sensed change in water status triggers a corrective response (ABA → closure → reduced water loss → restored water status).
- "Efficient functioning" can mean both efficient photosynthesis (max per photon) and efficient water use; the answer should touch on both.
In aerobic conditions, pyruvate that has formed during glycolysis enters the mitochondrion and takes part in the link reaction.
Name the two coenzymes involved in the link reaction.
Answer
- NAD
- Coenzyme A
NAD and coenzyme A
Background Concept
Aerobic respiration has four stages: glycolysis (in the cytoplasm), the link reaction (in the mitochondrial matrix), the Krebs cycle (in the mitochondrial matrix) and oxidative phosphorylation (across the inner mitochondrial membrane). Pyruvate produced at the end of glycolysis is transported into the mitochondrion, where it undergoes the link reaction (also called pyruvate decarboxylation, or the oxidative decarboxylation of pyruvate).
In the link reaction:
- Pyruvate (3C) is decarboxylated, losing one molecule of .
- The remaining 2-carbon acetyl group is oxidised; accepts hydrogen to form reduced NAD.
- The acetyl group is then attached to coenzyme A, forming acetyl-CoA, which is the substrate for the Krebs cycle.
Understanding the Question
This is a "name" command-word question worth 2 marks. The stem reminds us that pyruvate enters the mitochondrion and takes part in the link reaction, and asks for the two coenzymes used in this reaction. A coenzyme is an organic, non-protein helper molecule that assists an enzyme.
Approach
Recall the overall equation for the link reaction:
The two coenzymes (highlighted) that participate are (the hydrogen carrier) and coenzyme A (the acyl-group carrier).
Step-by-Step Reasoning
- NAD (nicotinamide adenine dinucleotide) is the first coenzyme. It accepts a hydride ion (and a proton) from the oxidised 2-carbon fragment, becoming reduced NAD. NAD is a coenzyme in many dehydrogenase reactions, not just the link reaction.
- Coenzyme A (CoA or CoA–SH) is the second. Its thiol (–SH) group binds to the acetyl group via a thioester bond, forming acetyl-CoA. The "CoA" part is the coenzyme; the entire complex is the substrate that condenses with oxaloacetate to start the Krebs cycle.
Key Takeaways
- The link reaction uses exactly two coenzymes: NAD and coenzyme A.
- NAD is a hydrogen carrier; CoA is an acyl-group carrier.
- The end-product, acetyl-CoA, is the molecule that enters the Krebs cycle.
Common Mistakes
- Writing NADH or reduced NAD as the coenzyme. NAD is the coenzyme; reduced NAD is the product after NAD has accepted hydrogen.
- Confusing coenzyme A with acetyl-CoA. CoA is the coenzyme; acetyl-CoA is the complex it forms with the acetyl group.
- Naming FAD. FAD is a coenzyme used in the Krebs cycle (in the succinate → fumarate step), not the link reaction.
Things to Be Careful About
- The command word is "name", so just writing the names is enough — no further explanation is required for the mark.
- The two names can be given in any order, but both must be correct for both marks.
- Capitalisation: "NAD" and "Coenzyme A" are the accepted forms. "co-enzyme A" is the same compound, but the CIE mark scheme prefers "coenzyme A".
Enzymes play an important role in the functioning of the Krebs cycle.
The enzymes in the Krebs cycle can be affected by the presence of hydrogen peroxide. Hydrogen peroxide is a product of some of the reactions that occur within the mitochondrion.
An investigation was carried out to measure the effect of two different concentrations of hydrogen peroxide on an enzyme of the Krebs cycle. The activity of the enzyme was measured over 10 minutes when exposed to the two different concentrations of hydrogen peroxide.
The results are shown in Fig. 9.1.
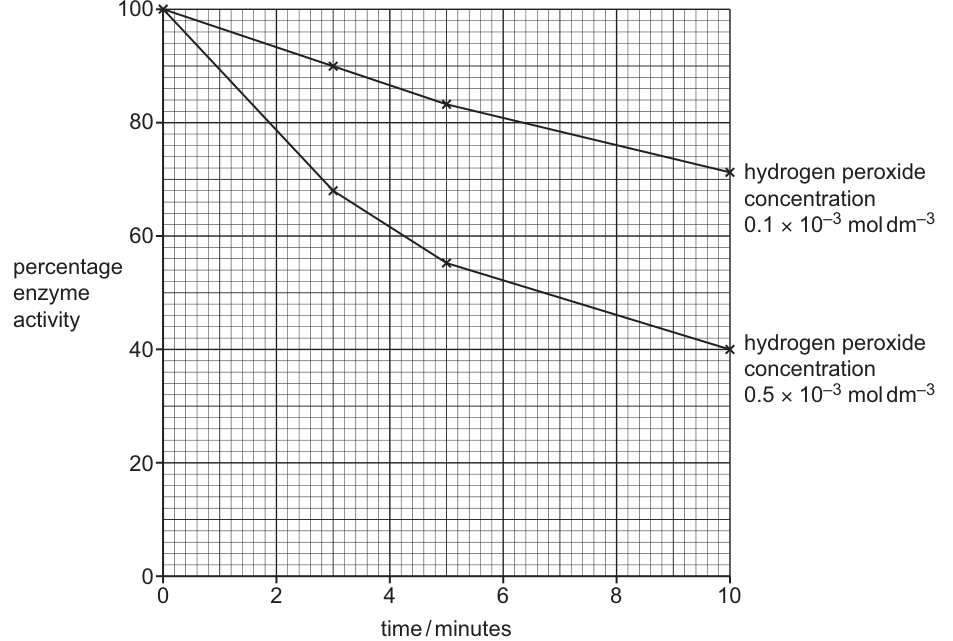
Describe the effect shown in Fig. 9.1 of hydrogen peroxide concentration on the activity of the Krebs cycle enzyme.
Answer
- Enzyme activity decreases over time at both concentrations of .
- Activity decreases more / faster at the higher concentration ().
- Paired data quote: at 5 min, activity is approximately 83% at but approximately 55% at .
- acts as an inhibitor of the Krebs cycle enzyme.
Activity decreases over time at both H₂O₂ concentrations; faster decrease at higher concentration; H₂O₂ inhibits the enzyme.
Background Concept
Enzymes are biological catalysts whose activity depends on the integrity of their tertiary structure. Many factors reduce enzyme activity: temperature extremes, inappropriate pH, and the presence of inhibitors. Hydrogen peroxide () is a reactive oxygen species (ROS) generated as a by-product of normal mitochondrial metabolism, including some Krebs cycle dehydrogenases and the electron transport chain. At high concentrations, oxidises cysteine and methionine residues in proteins, disrupting their tertiary structure and reducing catalytic activity — one route by which oxidative stress damages mitochondria.
Understanding the Question
The question presents Fig. 9.1, a line graph plotting percentage enzyme activity (y-axis, 0–100%) against time (x-axis, 0–10 min) for one Krebs cycle enzyme exposed to two concentrations of : and . The command word is "describe", so the answer must state what the data shows — trends, comparisons, and any data quotes that support the comparison.
Approach
- Identify the direction of each curve.
- Compare the rate and magnitude of change between the two concentrations.
- Quote paired data (same time-point, both concentrations) to substantiate the comparison.
- Recognise the biological role of as an inhibitor of the enzyme.
Step-by-Step Reasoning
- Both curves fall over time. At , activity drops (almost linearly) from 100% at 0 min to 70% at 10 min. At , activity drops more steeply and non-linearly from 100% to 40% at 10 min. So activity decreases at both concentrations.
- The decrease is greater and faster at the higher concentration. The curve lies below the curve for the entire experiment.
- Paired data quote to support the comparison: at 5 min, activity is approximately 83% at but only approximately 55% at — a difference of about 28 percentage points.
- Biological interpretation: is acting as an inhibitor of the Krebs cycle enzyme, and the inhibition is concentration-dependent (more → more inhibition).
Key Takeaways
- Read graphs by identifying axis variables, noting trends in each curve, and making paired data comparisons.
- "Describe" needs observations, but here the mark scheme also credits the biological explanation ( as inhibitor).
- Concentration-dependent inhibition is a recurring theme: more inhibitor → more loss of activity.
Common Mistakes
- Quoting single values without pairing them (e.g. "activity is 40% at 10 min" without saying what it is at the other concentration).
- Forgetting that BOTH concentrations show inhibition, not just the higher one.
- Saying the enzyme is "denatured" or "killed". The mark scheme credits "inhibitor" — the enzyme is less active, not necessarily destroyed.
- Reading the y-axis as an absolute number rather than a percentage of initial activity.
Things to Be Careful About
- Quote values to the precision of the grid lines; the y-axis is in 5% divisions.
- Use precise units: (equivalent to ) — not just "high concentration".
- "Describe" wants observations. The inhibitor point is a borderline observation/interpretation that the CIE mark scheme does credit here.
Reduced NAD and reduced FAD are produced during the Krebs cycle. They carry hydrogen to the inner mitochondrial membrane where oxidative phosphorylation occurs.
The first two steps in oxidative phosphorylation are:
- Hydrogen atoms split into protons and electrons.
- Electrons move along the electron transport chain, releasing energy.
Outline the steps that occur to complete oxidative phosphorylation.
Answer
- Energy from electron transport is used to pump / protons from the matrix into the intermembrane space.
- A proton gradient (electrochemical gradient) is established across the inner mitochondrial membrane.
- Protons diffuse back into the matrix through ATP synthase.
- The flow of protons through ATP synthase drives the synthesis of ATP from ADP and (chemiosmosis).
- At the end of the ETC, oxygen accepts electrons (combining with protons) to form water:
Protons pumped across the inner mitochondrial membrane creating a gradient; protons flow through ATP synthase producing ATP; oxygen is the final electron acceptor forming water.
Background Concept
Oxidative phosphorylation is the fourth and final stage of aerobic respiration. It takes place across the inner mitochondrial membrane and has two linked parts: the electron transport chain (ETC) and chemiosmosis (ATP synthesis driven by a proton gradient). The question has given the first two steps (hydrogen splitting and electron transport) and asks for the rest.
The key players are:
- Electron carriers (cytochromes, etc.) embedded in the inner mitochondrial membrane.
- ATP synthase — a large stalked-particle enzyme complex that makes ATP.
- Oxygen — the final electron acceptor.
- Protons (H⁺) — pumped into the intermembrane space.
Understanding the Question
This is an "outline" question worth 4 marks. The answer must describe, in order, what happens after the electrons have begun moving along the ETC. It needs to cover proton pumping, the resulting gradient, the role of ATP synthase, ATP production, and the role of oxygen.
Approach
Trace the fate of the protons and the electrons separately:
- Protons (H⁺): pumped out → form a gradient → flow back through ATP synthase → drive ATP synthesis.
- Electrons (e⁻): move along the ETC → released at the end → accepted by oxygen → combine with protons → form water.
The overall process is called chemiosmosis.
Step-by-Step Reasoning
- Proton pumping. As electrons pass along the ETC, the energy released is used to actively transport (protons) from the matrix across the inner mitochondrial membrane into the intermembrane space. (Some H⁺ also comes from the dissociation of the H atoms released by reduced NAD/FAD in the matrix.)
- Proton gradient forms. This creates an electrochemical gradient of H⁺ across the inner membrane — high [H⁺] in the intermembrane space, low [H⁺] in the matrix. The gradient stores potential energy (the proton-motive force).
- Protons flow through ATP synthase. Protons diffuse back into the matrix down their electrochemical gradient through the channel in ATP synthase (the stalked particles visible in EM images of mitochondria).
- ATP is made. The flow of protons through ATP synthase provides energy to phosphorylate ADP with inorganic phosphate () to form ATP. The overall process — using a proton gradient to drive ATP synthesis — is called chemiosmosis.
- Oxygen as the final electron acceptor. At the end of the ETC, electrons are passed to oxygen, which combines with protons from the matrix to form water:
Key Takeaways
- The ETC and ATP synthesis are physically separate events, coupled only by the proton gradient.
- Chemiosmosis = proton gradient + proton flow through ATP synthase + ATP synthesis.
- Without oxygen, the ETC stops (electrons have nowhere to go), the gradient dissipates, and ATP synthesis halts — that is why oxygen is essential for aerobic respiration.
Common Mistakes
- Saying oxygen is used to make ATP. It is not — oxygen accepts electrons at the end of the chain; ATP is made by ATP synthase.
- Confusing oxidative phosphorylation with substrate-level phosphorylation (the small amounts of ATP made directly in glycolysis and the Krebs cycle).
- Saying "protons move along the ETC". Electrons move along the ETC; protons are pumped across the membrane.
- Forgetting oxygen's role, or saying oxygen "produces" water without mentioning electron acceptance.
Things to Be Careful About
- The question already credits step 1 (H split) and step 2 (electron transport) — do not repeat them. Marks are for the subsequent steps.
- "Chemiosmosis" is the technical term for the ATP-synthesis phase; using it explicitly scores a mark.
- The proton gradient is a concentration gradient AND electrical gradient — together they form the proton-motive force, but the mark scheme accepts "proton gradient" alone.
Fig. 9.2 shows the oxygen consumption of a person who is carrying out a fast-running exercise.
Suggest why the oxygen consumption takes time to return to normal after exercise.
Answer
- During fast running, anaerobic respiration in muscle produces lactate from pyruvate (because the supply is insufficient for the ATP demand).
- Lactate must be broken down / oxidised, which requires oxygen (e.g. via the Krebs cycle and oxidative phosphorylation to make ATP for the liver).
- Some ATP is used to convert lactate back to glucose / glycogen in the liver.
- The extra required to clear lactate and replenish energy stores is the oxygen debt; repaying it takes time, so consumption remains elevated after exercise ends.
Oxygen debt — extra O₂ required to oxidise lactate and convert it back to glucose/glycogen after anaerobic respiration during exercise.
Background Concept
During vigorous exercise, the rate of ATP demand in skeletal muscle can exceed the rate at which oxygen can be supplied by the cardiovascular system. To keep producing ATP, muscle cells supplement aerobic respiration with anaerobic respiration (specifically, lactate fermentation in humans):
This regenerates , allowing glycolysis to continue making a small amount of ATP. However, lactate accumulates in the muscle and blood, and the body's "stores" are depleted. After exercise, oxygen consumption stays elevated to repay the oxygen debt — that is, to clear the lactate, replenish ATP and phosphocreatine (PCr) stores, and restore normal resting metabolism.
Understanding the Question
The graph (Fig. 9.2) shows oxygen consumption rising during exercise, continuing to rise after exercise ends to a peak, and then gradually falling back to baseline. The question asks us to suggest why oxygen consumption remains elevated after exercise ends. "Suggest" requires an explanation based on biological knowledge, not a description of the curve.
Approach
- Identify what happens during the exercise (anaerobic respiration → lactate accumulation).
- Identify what must happen afterwards (lactate breakdown, which needs and ATP).
- Mention the term oxygen debt and its repayment.
Step-by-Step Reasoning
- During fast running, anaerobic respiration occurs in the muscle, producing lactate from pyruvate. This happens because the supply is insufficient for the rate of aerobic respiration needed to meet the very high ATP demand.
- Lactate must be cleared. Some is oxidised directly as a respiratory substrate in the muscle, heart, and liver — this requires oxygen, with the H atoms carried by reduced NAD/FAD being passed along the ETC to oxygen. Other lactate is converted back to pyruvate.
- Some lactate is converted to glucose (gluconeogenesis) or glycogen in the liver. This is an energy-requiring process (uses ATP from oxidative phosphorylation), so further oxygen consumption is needed.
- The extra required to clear lactate and replenish ATP/PCr is called the oxygen debt. Repaying this debt takes time, which is why consumption remains elevated and only gradually returns to normal after exercise ends.
Key Takeaways
- The oxygen debt is the extra required to clear lactate and replenish energy stores after anaerobic respiration.
- Lactate is not waste — it is a useful fuel and a gluconeogenic precursor (Cori cycle).
- Recovery processes are slower than the exercise that triggered them, so consumption peaks after exercise ends and gradually falls back to baseline.
Common Mistakes
- Saying "lactic acid" or "lactate" without connecting it to anaerobic respiration.
- Saying "oxygen is used to remove ". is removed by ventilation, not directly by oxygen.
- Confusing human anaerobic respiration (lactate) with yeast anaerobic respiration (ethanol + ).
- Saying the body "needs to recover" without specifying the biochemical processes.
Things to Be Careful About
- Lactate is produced in muscle but mainly processed in the liver (Cori cycle: lactate → pyruvate → glucose → glycogen).
- The graph showing peaking after exercise ends is the key clue pointing to the oxygen debt.
- The mark scheme accepts either "oxygen needed to oxidise lactate to and " or "for the ETC to make extra ATP" — both score.
Cyclic photophosphorylation and non-cyclic photophosphorylation occur during the light-dependent stage of photosynthesis.
Outline the differences between cyclic photophosphorylation and non-cyclic photophosphorylation.
Answer
| Feature | Cyclic | Non-cyclic |
|---|---|---|
| Photosystems involved | Photosystem I (P700) only | Photosystem I (P700) and Photosystem II (P680) |
| Fate of electrons | Electrons return to (the same) photosystem I | Electrons do not return to the same photosystem; they are replaced by electrons from the photolysis of water |
| Products | ATP only | ATP and reduced NADP |
| Photolysis of water | Does not occur | Occurs (in PSII) |
| Oxygen | Not produced | Produced (as a by-product of photolysis) |
Any three of the differences above.
Any three of: photosystems involved (PSI only vs PSI + PSII); electrons return vs do not return; ATP only vs ATP + reduced NADP; no photolysis vs photolysis; no O2 vs O2 produced.
Background Concept
The light-dependent stage of photosynthesis takes place on the thylakoid membranes of chloroplasts and uses two photosystems, Photosystem I (PSI, P700) and Photosystem II (PSII, P680), each containing chlorophyll a and accessory pigments arranged in an antenna complex. When a pigment absorbs a photon of the right wavelength, the energy is passed to the reaction centre where an electron is excited to a higher energy level and leaves the chlorophyll molecule.
There are two ways this lost electron can be replaced and the energy can be harnessed:
-
Non-cyclic photophosphorylation uses both photosystems. Light energy excites electrons in PSII; these pass along an electron transport chain (via plastoquinone, the cytochrome complex and plastocyanin) to PSI, where they are re-energised and finally reduce NADP⁺ to reduced NADP (NADPH). The electron deficit in PSII is repaired by the photolysis of water (H₂O → 2H⁺ + 2e⁻ + ½O₂), so oxygen is released as a by-product. The proton gradient generated drives ATP synthesis via ATP synthase (chemiosmosis).
-
Cyclic photophosphorylation uses only Photosystem I. Excited electrons leave PSI, pass down a short electron transport chain (via plastoquinone and the cytochrome complex) back to PSI, releasing energy that pumps H⁺ across the thylakoid membrane. This generates a proton gradient and therefore ATP only — no NADPH and no O₂ are produced. It is thought to operate when the cell needs extra ATP (e.g. when the Calvin cycle is demanding more ATP than NADPH).
Understanding the Question
The command word is outline the differences. The mark scheme provides a table of five valid contrasts; the candidate is credited for any three of them. The question is testing clear, structured comparison rather than a long prose description. A tabular or paired-bullet answer is the cleanest way to present the differences.
Approach
- Select the three differences you can state most accurately and in the correct biological language.
- Present each as a paired statement: cyclic feature versus non-cyclic feature.
- Use the correct terms: PSI/P700, PSII/P680, photolysis, reduced NADP, and specify that electrons return vs do not return.
Step-by-Step Reasoning
- Photosystems involved: cyclic uses only PSI (P700); non-cyclic uses both PSI and PSII — this is the most fundamental difference and earns the first mark.
- Fate of the excited electrons: in cyclic photophosphorylation the electron that leaves PSI is passed back along an electron transport chain to the same photosystem; in non-cyclic photophosphorylation the electrons are passed from PSII → PSI → NADP⁺ and do not return to the original photosystem.
- Products of the light-dependent reaction: cyclic produces ATP only; non-cyclic produces ATP and reduced NADP (NADPH). The cell uses the ATP:NADPH ratio from these two pathways to balance supply with demand from the Calvin cycle.
- Photolysis of water: occurs in PSII during non-cyclic photophosphorylation (it is the source of the electrons that replace those lost from PSII) but does not occur during cyclic photophosphorylation.
- Oxygen: a by-product of photolysis, so O₂ is released during non-cyclic photophosphorylation but not during cyclic photophosphorylation.
Any three of these five contrasts are sufficient for full marks.
Key Takeaways
- The two photophosphorylation pathways differ in the photosystems they use, the fate of the electrons, and the products they generate.
- Cyclic photophosphorylation = PSI only, electrons recycled, ATP only, no photolysis, no O₂.
- Non-cyclic photophosphorylation = PSI + PSII, electrons reduce NADP⁺, ATP + reduced NADP, photolysis, O₂ produced.
Common Mistakes
- Writing that cyclic photophosphorylation occurs in the stroma or produces glucose — these statements are wrong; both pathways occur on the thylakoid membrane and neither directly produces glucose.
- Saying electrons "are lost" in non-cyclic photophosphorylation — imprecise. The electrons are transferred to NADP⁺, not lost from the system.
- Confusing the two photosystems: PSII acts first in the non-cyclic pathway, despite being named II. The numbering reflects the order in which they were discovered, not the order in which they operate.
- Only writing a one-sided description (e.g. just listing features of non-cyclic photophosphorylation) without explicit contrast — at least three paired differences are needed for full marks.
Things to Be Careful About
- Use the precise labels P700 (or PSI) and P680 (or PSII). Spelling "photo-system" or omitting the I/II distinction loses the mark.
- The term reduced NADP (or NADPH) is required; writing just "NADP" implies the oxidised form, which is incorrect.
- Photolysis must be mentioned by name if you are crediting that row; "splitting of water" alone is borderline — include the technical term.
- A table is a clear and efficient way to show paired differences; if you write in prose, structure it as "Cyclic … whereas non-cyclic …" for each point.
Complete the passage about the Calvin cycle using the most appropriate word or words.
A molecule of ______ combines with a five-carbon molecule, ribulose bisphosphate (RuBP), catalysed by the enzyme ______. This reaction produces a six-carbon compound that splits into two molecules of a three-carbon compound, glycerate 3-phosphate (GP).
ATP and ______ are used to convert GP molecules into molecules of a three-carbon sugar, triose phosphate (TP).
Some TP molecules are used to make ______, while others are recycled to regenerate RuBP using ATP.
Answer
A molecule of carbon dioxide combines with a five-carbon molecule, ribulose bisphosphate (RuBP), catalysed by the enzyme Rubisco (ribulose bisphosphate carboxylase/oxygenase). This reaction produces a six-carbon compound that splits into two molecules of a three-carbon compound, glycerate 3-phosphate (GP).
ATP and reduced NADP (NADPH) are used to convert GP molecules into molecules of a three-carbon sugar, triose phosphate (TP).
Some TP molecules are used to make glucose (accept: hexose / starch / cellulose / glycerol / fatty acids / lipids / amino acids / proteins), while others are recycled to regenerate RuBP using ATP.
- carbon dioxide; 2. Rubisco; 3. reduced NADP (NADPH); 4. glucose (or any of the other named end-products).
Background Concept
The Calvin cycle (also called the light-independent reactions) takes place in the stroma of the chloroplast and does not require light directly, although it depends on the ATP and reduced NADP produced by the light-dependent reactions. It is a cyclic pathway that fixes inorganic carbon dioxide into organic molecules. The cycle has three main phases:
- Carbon fixation: CO₂ is attached to the five-carbon acceptor molecule ribulose bisphosphate (RuBP) by the enzyme Rubisco (ribulose bisphosphate carboxylase/oxygenase). The unstable six-carbon intermediate immediately splits into two molecules of glycerate 3-phosphate (GP), a three-carbon compound.
- Reduction: each GP is phosphorylated by ATP (to form 1,3-bisphosphoglycerate) and then reduced by reduced NADP (NADPH) to form triose phosphate (TP), a three-carbon sugar.
- Regeneration of RuBP: five out of every six TP molecules are rearranged (using more ATP) to regenerate RuBP, so the cycle can continue. The remaining TP is the net product and is used by the cell to synthesise other organic molecules.
TP is the starting point for the synthesis of almost all other organic compounds in the plant: hexose sugars (glucose, fructose), disaccharides (sucrose), polysaccharides (starch for storage, cellulose for cell walls), lipids (glycerol + fatty acids), and amino acids/proteins (when combined with ammonium ions from nitrate reduction).
Understanding the Question
The command word is complete — the candidate fills four blanks in a passage describing the Calvin cycle. Each blank is worth one mark, and the marks reward specific biological terms rather than general ideas. The passage provides the surrounding context, so the candidate must choose a single word or short phrase that fits each gap and the surrounding sentence.
Approach
Read the passage sentence by sentence. For each gap, identify:
- What the previous molecule is reacting with or producing.
- Which enzyme or cofactor is needed at that step.
- The end-product that TP eventually becomes.
Then write the single best technical term into each blank.
Step-by-Step Reasoning
- Blank 1 — "A molecule of ____ combines with … RuBP": The Calvin cycle fixes inorganic carbon. The molecule combining with the 5-carbon RuBP is carbon dioxide (CO₂). (Some candidates write "carbon" — this is not the same and is not credited.)
- Blank 2 — "catalysed by the enzyme ____": The enzyme that carboxylates RuBP is Rubisco (ribulose bisphosphate carboxylase/oxygenase), one of the most abundant proteins on Earth. "Carboxylase" alone is incomplete; the accepted shorthand is Rubisco.
- Blank 3 — "ATP and ____ are used to convert GP … to TP": The reduction of GP to TP requires both a phosphate group (from ATP) and reducing power. The reducing cofactor is reduced NADP, written NADPH in its protonated form. Writing just "NADP" would refer to the oxidised form and is wrong.
- Blank 4 — "Some TP molecules are used to make ____": TP is the net product of the Calvin cycle and is the precursor for almost all other biomolecules the plant needs. The most common answer is glucose, but the mark scheme accepts any reasonable end-product: hexose, starch, cellulose, glycerol, fatty acids, lipids, amino acids, or proteins.
Key Takeaways
- The Calvin cycle fixes CO₂ onto RuBP using Rubisco, producing GP.
- GP is reduced to TP using ATP and reduced NADP.
- TP is the net gain from the cycle and is the precursor of all other plant organic molecules (glucose, starch, cellulose, lipids, amino acids, etc.).
- Most TP (5/6) is recycled to regenerate RuBP, requiring additional ATP.
Common Mistakes
- Writing "carbon" instead of "carbon dioxide" — the question is about the gas that diffuses into the leaf.
- Writing "ribulose" instead of "Rubisco" for the enzyme; ribulose is the substrate, not the catalyst.
- Writing "NADP" unqualified — this refers to the oxidised form. The reduced form NADPH (or "reduced NADP") is what is consumed in the reduction of GP to TP.
- Writing "glucose" for the wrong blank: TP itself is a three-carbon sugar (a triose); the question asks what TP is converted into, which is the six-carbon hexose glucose, or longer-term products like starch and cellulose.
Things to Be Careful About
- Spelling Rubisco with a capital R and lower-case letters; "rubisco" in lower case is often still accepted but is best written as the proper noun.
- The mark scheme uses AW (allow any wording) only where the alternatives listed are equivalent end-products of TP. Do not invent unrelated terms (e.g. "chlorophyll" or "glucose-6-phosphate" is not credited because the question is asking for a major biological end-product).
- The word "reduced" is essential when writing NADP in this context; without it the meaning reverses.
- Calvin cycle = light-independent stage; the two terms can be used interchangeably.