Biology 9700/43 — October/November 2025
Cambridge A-Level · A Level Structured Questions · worked solutions for every part, with the mark scheme
Topics Inheritance · Classification, Biodiversity and Conservation · Selection and Evolution · Control and Coordination · Photosynthesis · Energy and Respiration · +2 more
Guinea pigs, Cavia porcellus, vary in the length and colour of their fur.
Fig. 1.1 shows a guinea pig with short black fur.
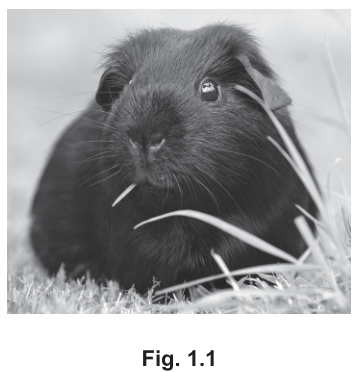
Fig. 1.1
Two genes that determine the length and colour of the fur occur at the locus and the locus. These two gene loci are on separate autosomal chromosomes.
• The allele results in short fur.
• The allele results in long fur.
• is dominant to .
• The allele results in black fur.
• The allele results in chocolate fur.
• is dominant to .
Answer
AABB, AABb, AaBB, AaBb
AABB, AABb, AaBB, AaBb
Background Concept
Every diploid organism carries two alleles at each autosomal locus, one inherited from each parent. The dominant allele is expressed in the phenotype whether the individual is homozygous dominant (AA) or heterozygous (Aa); the recessive allele is only expressed in the homozygous recessive state (aa).
When two gene loci lie on different (non-homologous) chromosomes, they are inherited independently — the gamete receiving a particular allele at one locus is unaffected by which allele it receives at the other locus. This means the possible genotypes at the two loci can be combined freely.
Understanding the Question
Two autosomal loci control the guinea pig's appearance:
- The A/a locus controls fur length — A (dominant) gives short fur, a (recessive) gives long fur.
- The B/b locus controls fur colour — B (dominant) gives black fur, b (recessive) gives chocolate fur.
We are asked for every genotype that produces the phenotype short black fur. The loci are independent, so we must enumerate the valid combinations at both.
Approach
- List the genotypes at the A/a locus that produce short fur (at least one A allele).
- List the genotypes at the B/b locus that produce black fur (at least one B allele).
- Combine the two lists — every short-fur genotype with every black-fur genotype.
Step-by-Step Reasoning
At the A/a locus, short fur requires at least one A:
- AA (homozygous dominant) → short fur
- Aa (heterozygous) → short fur (A is dominant over a)
- aa (homozygous recessive) → long fur — excluded
At the B/b locus, black fur requires at least one B:
- BB (homozygous dominant) → black fur
- Bb (heterozygous) → black fur (B is dominant over b)
- bb (homozygous recessive) → chocolate fur — excluded
Combining the two valid options at each locus (2 × 2 = 4 combinations):
| A locus | B locus | Genotype |
|---|---|---|
| AA | BB | AABB |
| AA | Bb | AABb |
| Aa | BB | AaBB |
| Aa | Bb | AaBb |
All four genotypes produce short black fur.
Key Takeaways
- A dominant phenotype can be produced by either a homozygous dominant (AA) or heterozygous (Aa) genotype.
- When two unlinked loci contribute to one phenotype, the number of possible genotypes is 2 × 2 = 4 (assuming both loci are heterozygous in the population).
- Always exclude genotypes that would produce a different phenotype (e.g. aa for short fur, bb for black fur).
Common Mistakes
- Listing only AABB — this is correct but incomplete; the heterozygous combinations also give short black fur.
- Including aaBB or aaBb — these produce long black fur, not short.
- Including AAbb or AaBb's recessive partner (aabb) — these produce chocolate fur, not black.
Things to Be Careful About
- Write the dominant allele with a capital letter and the recessive with the corresponding lowercase letter.
- The two loci are independent (separate chromosomes), so any combination of A_ and B_ is permissible.
A test cross could be used to determine the genotype of a female guinea pig with short black fur.
Describe the phenotype of the male guinea pig that could be used to carry out this test cross.
Answer
Long chocolate fur.
Long chocolate fur
Background Concept
A test cross is used to determine the unknown genotype of an individual that shows a dominant phenotype. The individual is crossed with a homozygous recessive partner (recessive at every locus of interest). Because the partner can only contribute recessive alleles, the phenotypes of the offspring reveal whether the unknown parent was homozygous dominant or heterozygous at each locus.
Understanding the Question
The female guinea pig shows the dominant phenotype short black fur — her exact genotype at the A/a and B/b loci is unknown (it could be AABB, AABb, AaBB or AaBb, as established in (a)(i)). To find out, she is crossed with a male whose contribution is genetically unambiguous: he must be homozygous recessive at both loci.
Approach
The male test-cross partner must be:
- aa at the A/a locus (homozygous recessive → long fur), AND
- bb at the B/b locus (homozygous recessive → chocolate fur).
The combined genotype is aabb, and the phenotype that genotype expresses is long chocolate fur.
Step-by-Step Reasoning
- At the A/a locus: homozygous recessive = aa, which expresses the recessive phenotype → long fur.
- At the B/b locus: homozygous recessive = bb, which expresses the recessive phenotype → chocolate fur.
- Both loci together: the male must be aabb, which expresses as long chocolate fur.
Why this works: if the female were AABB (homozygous dominant at both loci), all F1 offspring would be AaBb (short black). If she were heterozygous at any locus (e.g. AaBB), some offspring would inherit the recessive allele and show the recessive phenotype at that locus (e.g. aaBB → long black). The pattern of offspring phenotypes therefore reveals the female's hidden genotype.
Key Takeaways
- A test-cross partner is homozygous recessive at every locus being tested.
- The phenotype of a homozygous recessive individual is the recessive phenotype at every locus.
- Test crosses distinguish homozygous dominant from heterozygous individuals showing a dominant phenotype.
Common Mistakes
- Saying "homozygous" or "recessive" without specifying the actual phenotype.
- Giving only one trait (e.g. "chocolate") — both recessive traits must be mentioned because both loci are being tested.
- Confusing a test cross with a back cross to a known parent (a back cross may not be homozygous recessive).
Things to Be Careful About
- Both recessive phenotypes must be expressed — the question asks about a single male used for the cross, so he must be homozygous recessive at both loci simultaneously.
- The question only requires the phenotype, not the genotype, but writing the genotype (aabb) confirms the reasoning.
A black guinea pig with long fur that was homozygous at both loci was crossed with a chocolate guinea pig with short fur that was homozygous at both loci. The offspring of this cross had short black fur. offspring were mated together to produce the offspring.
Complete the Punnett square to:
• show the cross between the offspring
• predict the offspring genotypes.
You should include the gametes in your answer.
State the ratio of offspring phenotypes. You should include a key to link phenotypes to genotypes.
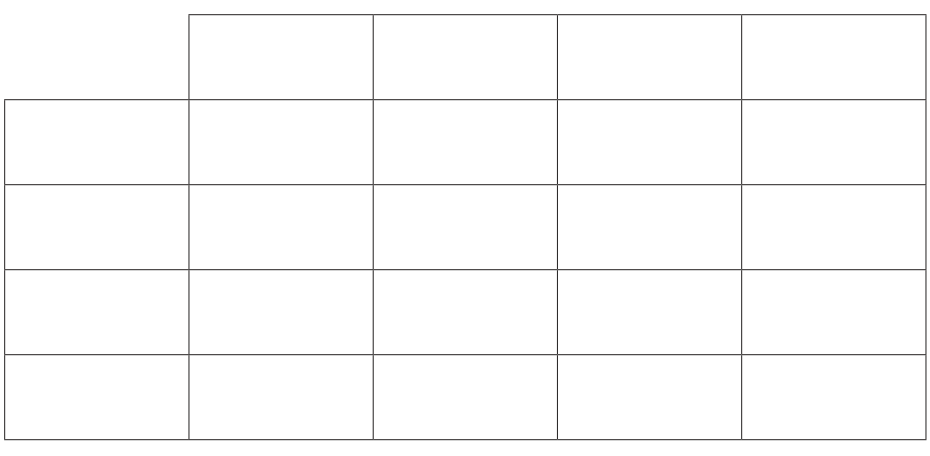
ratio of offspring phenotypes: ______
Working
The parental (P) cross is between:
- a long black guinea pig, homozygous at both loci → genotype aaBB (aa gives long; BB gives black)
- a short chocolate guinea pig, homozygous at both loci → genotype AAbb (AA gives short; bb gives chocolate)
P gametes: aB from one parent, Ab from the other → all F1 are AaBb (short black), as stated.
Each F1 parent (AaBb) produces four gamete types in equal proportions: AB, Ab, aB, ab.
Punnett square for F1 × F1:
| AB | Ab | aB | ab | |
|---|---|---|---|---|
| AB | AABB | AABb | AaBB | AaBb |
| Ab | AABb | AAbb | AaBb | Aabb |
| aB | AaBB | AaBb | aaBB | aaBb |
| ab | AaBb | Aabb | aaBb | aabb |
Counting the F2 phenotypes:
- Short black (A_B_): AABB + 2×AABb + 2×AaBB + 4×AaBb = 9
- Short chocolate (A_bb): AAbb + 2×Aabb = 3
- Long black (aaB_): aaBB + 2×aaBb = 3
- Long chocolate (aabb): aabb = 1
Answer
Ratio of F2 offspring phenotypes: 9 short black : 3 short chocolate : 3 long black : 1 long chocolate
Key (phenotype → genotype):
- short black → A_B_
- short chocolate → A_bb
- long black → aaB_
- long chocolate → aabb
9 short black : 3 short chocolate : 3 long black : 1 long chocolate
Background Concept
A dihybrid cross involves two gene loci, each with two alleles. When the loci are on different (non-homologous) chromosomes, they are inherited independently — this is Mendel's Law of Independent Assortment. A cross between two individuals who are heterozygous at both loci (AaBb × AaBb) predicts a classic 9:3:3:1 phenotypic ratio in the offspring when both genes show complete dominance.
A Punnett square is a grid that lists every possible combination of gametes from each parent. For a dihybrid cross between heterozygotes, each parent produces four gamete types (AB, Ab, aB, ab), and the square is 4 × 4, yielding 16 offspring combinations.
Understanding the Question
The question provides:
- P generation: long black × short chocolate, both homozygous at both loci.
- F1 generation: all short black.
- We are asked to cross F1 × F1, complete the Punnett square, and state the F2 phenotypic ratio with a key linking phenotypes to genotypes.
Working backwards from the F1 description: F1 are all short black, which means they are heterozygous at both loci (AaBb). The cross to perform is therefore AaBb × AaBb.
Approach
- List the four gamete types each F1 parent produces (AaBb → AB, Ab, aB, ab).
- Place one parent's gametes along the top of the square and the other parent's gametes down the side.
- Fill each cell with the combined genotype.
- Count the cells that share the same phenotype.
- Express the ratio and provide a key linking each phenotype to its underlying genotype.
Step-by-Step Reasoning
F1 gametes. Each F1 parent (AaBb) undergoes meiosis. Because the two loci are on different chromosomes, they assort independently, giving the four gametes AB, Ab, aB, ab — each with probability ¼.
Punnett square. Filling the 4 × 4 grid (combining the row gamete with the column gamete in each cell):
| AB | Ab | aB | ab | |
|---|---|---|---|---|
| AB | AABB | AABb | AaBB | AaBb |
| Ab | AABb | AAbb | AaBb | Aabb |
| aB | AaBB | AaBb | aaBB | aaBb |
| ab | AaBb | Aabb | aaBb | aabb |
Phenotype counts. Grouping the 16 offspring by phenotype (using the rules: A_ = short, aa = long, B_ = black, bb = chocolate):
- Short black (A_B_): cells containing at least one A AND at least one B → 9 cells (1 AABB + 2 AABb + 2 AaBB + 4 AaBb)
- Short chocolate (A_bb): cells with at least one A and bb → 3 cells (1 AAbb + 2 Aabb)
- Long black (aaB_): cells with aa and at least one B → 3 cells (1 aaBB + 2 aaBb)
- Long chocolate (aabb): cells with aa and bb → 1 cell (aabb)
Total = 9 + 3 + 3 + 1 = 16 ✓
Phenotype ratio: 9 : 3 : 3 : 1.
Key (phenotype → genotype). The mark scheme requires each phenotype to be linked to its underlying genotype using a recognised notation. Using the underscore convention (e.g. A_ means "either A or a"):
- short black = A_B_
- short chocolate = A_bb
- long black = aaB_
- long chocolate = aabb
Key Takeaways
- A dihybrid cross between two heterozygotes (AaBb × AaBb) on separate chromosomes gives the classic 9:3:3:1 phenotypic ratio.
- Each F1 parent produces four gamete types (AB, Ab, aB, ab) in equal proportions.
- A key linking phenotype to genotype is essential for clarity — the underscore notation (A_) is the cleanest way to express "either allele".
- Independent assortment (Mendel's second law) is the biological basis for the ratio.
Common Mistakes
- Forgetting that each F1 parent produces all four gamete types — both axes of the square must contain AB, Ab, aB, ab.
- Omitting the gametes from the Punnett square — the question explicitly asks for them.
- Giving the ratio 9:3:3:1 without the key linking each number to a phenotype and genotype.
- Writing the parents' genotypes as gametes (e.g. listing "AaBb" instead of AB, Ab, aB, ab) — gametes must be haploid.
- Mis-counting by forgetting that several different genotypes share a single phenotype.
Things to Be Careful About
- The ratio is by phenotype, not genotype, because several genotypes share a phenotype.
- The key must clearly link each phenotype to its underlying genotype — accepted forms are colour-coding, symbols, or initials; the underscore notation is the most explicit.
- All 16 cells of the Punnett square must be filled to receive full marks.
Some genes in guinea pigs are structural genes and some are regulatory genes.
Describe the difference between a structural gene and a regulatory gene.
Answer
- A structural gene codes for a structural or functional protein/polypeptide (e.g. an enzyme, a receptor or a structural component of the cell).
- A regulatory gene codes for a transcription factor or a repressor protein, which controls/restricts the expression of other genes.
Structural genes code for structural/functional proteins; regulatory genes code for transcription factors or repressor proteins that control the expression of other genes.
Background Concept
Genes fall into two broad functional categories based on the role of the protein they encode:
-
Structural genes carry the information needed to build proteins that perform specific cellular roles — enzymes that catalyse metabolic reactions, hormones that signal between cells, receptors that detect stimuli, transport proteins that move substances across membranes, and structural components like collagen or keratin.
-
Regulatory genes do not code for proteins with direct metabolic or structural roles in the cell. Instead, they code for regulatory proteins — typically transcription factors (in eukaryotes) or repressor proteins (such as the lac repressor in prokaryotes) — that bind to DNA and switch other genes on or off.
Understanding the Question
The question asks for the difference between the two gene types. To earn both marks, the answer must clearly distinguish what each gene type does, ideally identifying the protein product of each.
Approach
For each gene type, identify:
- The protein product of the gene (what it codes for).
- The functional role of that protein product.
Then contrast the two roles.
Step-by-Step Reasoning
Structural gene:
- Codes for a structural or functional protein/polypeptide.
- The protein product has a direct role in the cell's metabolism or structure.
- Examples: amylase (enzyme), insulin (signalling hormone), haemoglobin (transport protein), keratin (structural protein of hair and nails), membrane channel proteins.
Regulatory gene:
- Codes for a transcription factor or repressor protein.
- The protein product's role is to control, switch on/off, or restrict the expression of other genes.
- Examples: transcription factors that bind promoter or enhancer regions of eukaryotic genes; the lac repressor in E. coli, which binds the operator and switches off the lac operon in the absence of lactose.
The key distinction: structural genes encode proteins that do cellular work; regulatory genes encode proteins that manage the activity of other genes.
Key Takeaways
- Structural gene → functional/structural protein (the "workers" of the cell).
- Regulatory gene → regulatory protein such as a transcription factor or repressor (the "managers" of gene expression).
- A regulatory gene does still code for a protein, but that protein's role is regulatory — this is the difference from a structural gene, whose protein has a direct functional role.
Common Mistakes
- Saying a regulatory gene "controls gene expression" without naming the protein product (transcription factor/repressor). The mark scheme requires the type of protein.
- Giving the same definition for both gene types — they must be clearly distinguished.
- Saying regulatory genes "do not code for proteins" — they do, but the proteins have a regulatory role.
- Calling a structural gene one that "makes the body" — too vague; the mark scheme requires the term "structural/functional protein/polypeptide".
Things to Be Careful About
- Two separate marks are available: one for the structural gene definition, one for the regulatory gene definition. Both must be addressed.
- The mark scheme allows either alternative for the regulatory gene: (a) codes for a transcription factor/repressor, or (b) controls/restricts expression of other genes. Either wording is acceptable; combining both is safest.
Exserohilum turcicum is a fungal pathogen. The growth of the mycelium of the fungus damages the leaves of maize plants, Zea mays. Leaf damage reduces crop yield.
Complete Table 2.1 to show one structural difference and one functional difference between E. turcicum and Z. mays.
Table 2.1
| E. turcicum | Z. mays | |
|---|---|---|
| structural difference | ||
| functional difference |
Answer
| E. turcicum | Z. mays | |
|---|---|---|
| structural difference | (hyphae composed of) chitin cell walls / multinucleate cells / no chloroplasts | (cellulose cell wall / one nucleus per cell /) chloroplasts present |
| functional difference | heterotrophic / parasitic (obtains nutrients from host / does not photosynthesise) | autotrophic / photosynthetic |
One structural difference (e.g. chitin vs cellulose cell wall) and one functional difference (e.g. heterotrophic/parasitic vs autotrophic/photosynthetic).
Background Concept
Living organisms are sorted into a small number of major groups (domains and kingdoms) on the basis of shared fundamental features. The fungus Exserohilum turcicum belongs to kingdom Fungi, while Zea mays (maize) belongs to kingdom Plantae. Although both are eukaryotic, fungi and plants differ in several key ways that reflect their contrasting ways of life.
Fungi are heterotrophic — they secrete digestive enzymes externally and absorb the resulting soluble nutrients. Their cells are surrounded by a cell wall made of chitin (the same polymer found in arthropod exoskeletons), they do not contain chloroplasts and therefore cannot photosynthesise, and their bodies are made up of branching tubular filaments called hyphae, which are typically multinucleate (a coenocytic/syncytial arrangement, with many nuclei sharing one cytoplasm).
Plants are autotrophic — they make their own organic molecules by photosynthesis. Their cells have a cell wall made of cellulose, they contain chloroplasts, and each cell normally contains a single nucleus enclosed by a membrane.
Understanding the Question
The question asks for one structural and one functional difference between the two named organisms. Each row of the table is worth one mark, so the candidate must give one correctly paired point per row.
Approach
Pick one diagnostic structural feature that contrasts the two kingdoms (cell-wall chemistry, presence of chloroplasts, body form, or nuclear arrangement) and pair it correctly. Then choose one functional difference that reflects the contrasting ways of life (nutrition/photosynthesis).
Step-by-Step Reasoning
- Structural row: the mark scheme accepts any of these pairs:
- E. turcicum — chitin cell wall ↔ Z. mays — cellulose cell wall
- E. turcicum — no chloroplasts ↔ Z. mays — chloroplasts present
- E. turcicum — hyphae / long branching cells ↔ Z. mays — no hyphae
- E. turcicum — multinucleate / syncytial ↔ Z. mays — one nucleus per cell
- Functional row: the contrasting modes of nutrition must be named using precise words. "Heterotrophic" (or "parasitic", since E. turcicum lives on maize leaves) for the fungus and "autotrophic" or "photosynthetic" for the plant.
Key Takeaways
- Fungi (chitin wall, no chloroplasts, hyphae, heterotrophic) and plants (cellulose wall, chloroplasts, autotrophic) are easy to distinguish once their defining features are remembered.
- Always match a fungus to "heterotrophic" and a plant to "autotrophic/photosynthetic"; vague phrases such as "they eat different things" are not credited.
Common Mistakes
- Saying fungi have "no cell wall" — they do have one, but it is made of chitin, not cellulose.
- Saying plants are heterotrophic, or fungi are photosynthetic.
- Giving only a structural OR only a functional difference when the table requires both.
Things to Be Careful About
- "Parasitic" is accepted for E. turcicum because it derives nutrients from a living host (maize leaves).
- The mark scheme allows several alternative cell-wall / chloroplast / hyphae pairings; any one correct pairing scores the mark.
Describe the principles by which organisms such as E. turcicum and Z. mays are classified in the taxonomic hierarchy.
Answer
- Organisms are classified into a hierarchy of increasingly small groups (large groups divided into smaller groups).
- Members of the same group share similar features.
- The major ranks, in descending order, are kingdom → phylum → class → order → family (→ genus → species).
- Each species is given a binomial (two-word Linnaean) name consisting of its genus and species, e.g. Exserohilum turcicum and Zea mays.
- Both E. turcicum and Z. mays are placed in the domain Eukarya.
- They are in different kingdoms — E. turcicum in kingdom Fungi and Z. mays in kingdom Plantae.
See working — classification uses a hierarchy of groups sharing similar features, from kingdom down to species (binomial name); both organisms are in domain Eukarya but in different kingdoms (Fungi vs Plantae).
Background Concept
Biological classification (taxonomy) sorts every known organism into a series of nested ranks: kingdom, phylum, class, order, family, genus, species. At the broadest level, life is divided into three domains — Archaea, Bacteria and Eukarya — and within Eukarya are several kingdoms, including Fungi, Plantae, Animalia and Protoctista. Each rank represents a group whose members share particular features, and the ranks become more specific (and the groups smaller) as one descends the hierarchy. Every species is given a unique two-word binomial (Linnaean) name: the genus name followed by the species name.
Understanding the Question
The candidate is asked to describe the principles by which classification works, applied to the two named organisms. The mark scheme rewards up to four of the following: hierarchy structure, shared features within groups, naming three of the major ranks (kingdom/phylum/class/order/family), recognising the binomial system, recognising that both species are in domain Eukarya, and recognising that they are in different kingdoms (Fungi vs Plantae).
Approach
Lay out the underlying principle (groups nested within groups, defined by shared features), name the ranks that make up the hierarchy, explain how a species name is formed, and then place the two named organisms in their correct domains and kingdoms.
Step-by-Step Reasoning
- Hierarchy: large groups contain smaller groups, kingdom being the largest relevant group below domain.
- Shared features: members of each group share common/similar characteristics, which is why they are grouped together.
- Major ranks: kingdom, phylum, class, order, family (and below those, genus and species) — any three named correctly is credited.
- Binomial name: genus + species, written in italics with the genus capitalised (e.g. Zea mays); this is a universally recognised Linnaean/Latin scientific name.
- Domain: both organisms are eukaryotes (have a true nucleus and membrane-bound organelles), so both belong to domain Eukarya.
- Kingdom: E. turcicum is a fungus (cell wall of chitin, hyphae, heterotrophic), so kingdom Fungi; Z. mays is a flowering plant (cellulose cell wall, chloroplasts, autotrophic), so kingdom Plantae.
Key Takeaways
- Classification is hierarchical, feature-based and culminates in a unique binomial name.
- Exserohilum turcicum — domain Eukarya, kingdom Fungi; Zea mays — domain Eukarya, kingdom Plantae.
- Always write binomial names in italics with the genus capitalised.
Common Mistakes
- Listing the ranks in the wrong order (e.g. "class before phylum").
- Calling E. turcicum a bacterium or a plant — it is a fungus.
- Saying "both are in the same kingdom" — they are in different kingdoms.
- Writing the binomial with both words capitalised (e.g. Zea Mays) or not in italics.
Things to Be Careful About
- The mark scheme requires explicit reference to both the Fungi and Plantae kingdoms (or at least making clear they are in different kingdoms) to score the kingdom point.
- "Domain" must be distinguished from "kingdom"; both organisms share a domain (Eukarya) but not a kingdom.
Two inbred varieties of maize, SKV50 and CML153, were crossed. The resulting hybrids were self-crossed to produce offspring. The plants were grown, and the percentage area of leaf damage caused by E. turcicum was measured.
Fig. 2.1 shows the results for the generation. The arrows show the mean percentage area of leaf damage for the two parent varieties.
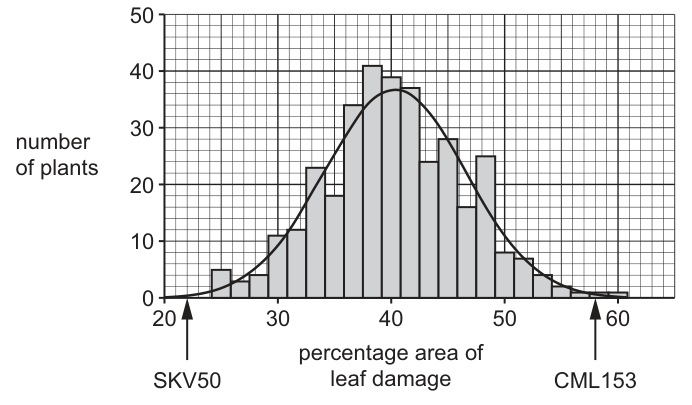
Fig. 2.1
Explain how Fig. 2.1 can be used to determine which parent maize variety shows the greatest resistance to infection by E. turcicum.
Answer
- A lower percentage area of leaf damage corresponds to greater resistance to infection by E. turcicum.
- The arrows on Fig. 2.1 indicate mean damage of about 22% for SKV50 and about 58% for CML153.
- Therefore SKV50 shows the greatest resistance to infection.
SKV50 (≈22% leaf damage, lower than CML153 at ≈58%).
Background Concept
Resistance to a pathogen is measured by how little damage the pathogen causes. In this experiment, resistance to E. turcicum is operationalised as a low percentage of leaf area damaged. The mean of each parent variety (shown by the arrows on the x-axis of Fig. 2.1) gives a single representative value for comparison.
Understanding the Question
The candidate must use Fig. 2.1 to decide which parent variety is more resistant. The arrows mark the parental means; the parent with the smaller mean percentage leaf damage is the more resistant one.
Approach
Read off the two arrow positions on the x-axis, link "low damage" to "high resistance", and identify the parent with the lower damage value.
Step-by-Step Reasoning
- The x-axis is "percentage area of leaf damage"; lower values mean less disease damage.
- SKV50 sits at roughly 22% leaf damage.
- CML153 sits at roughly 58% leaf damage.
- Because less damage = more resistance, SKV50 (22%) is more resistant than CML153 (58%).
Key Takeaways
- Resistance is inversely related to disease damage in this assay.
- Graph arrows (or means) are read directly off the axis and used to rank varieties.
Common Mistakes
- Confusing "low damage" with "susceptibility" — the smaller the damaged area, the more resistant the variety.
- Saying SKV50 has the most disease damage simply because the F₂ mean (~40%) is closer to CML153.
Things to Be Careful About
- The arrows represent the parents, not the F₂ mean; the F₂ distribution peaks at ~40%.
- Approximate read-offs (22%, 58%) are acceptable as long as the relative ordering is correct.
Answer
Continuous variation.
Continuous variation.
Background Concept
Variation among individuals of a species is either discontinuous (a small number of discrete categories with no intermediates — e.g. blood groups ABO) or continuous (a range of values with no clear categories — e.g. height, mass). Continuous variation usually produces a bell-shaped (normal) frequency distribution when plotted, with many intermediate phenotypes and few at the extremes.
Understanding the Question
Fig. 2.1 shows a bell-shaped distribution of percentage leaf damage for the F₂ generation, with the parent means near the extremes. The candidate must name the type of variation this represents.
Approach
Recognise the smooth bell-shaped curve with no discrete categories as the hallmark of continuous variation.
Step-by-Step Reasoning
- The F₂ histogram shows a smooth, single-peaked, bell-shaped distribution.
- Many intermediate values are present and there are no distinct categories.
- This is the signature of continuous variation.
Key Takeaways
- Continuous variation → bell-shaped distribution, many intermediates, no discrete classes.
- Discontinuous variation → distinct categories with sharp boundaries, no intermediates.
Common Mistakes
- Writing "polymorphic" or "polygenic" instead of "continuous" — the question asks for the type of variation, not its genetic basis.
- Confusing "continuous" with "discontinuous" because the F₂ is from a cross (a misconception that crosses always give Mendelian ratios).
Things to Be Careful About
- "Continuous" describes the phenotypic spread; the underlying cause (polygenic inheritance) is named in part (iii).
Answer
- The variation is controlled by many (multiple/several) genes — it is polygenic.
- All these genes affect the same trait — the percentage area of leaf damage / resistance to E. turcicum.
- Each allele of each gene contributes only a small effect to the phenotype.
- The effects of the different genes are additive (the more "resistance" alleles a plant carries, the smaller the leaf damage it sustains).
- Numerical illustration: with three unlinked genes each having two alleles (A/a, B/b, C/c), a plant can carry between 0 and 6 dominant (resistance) alleles, giving 7 phenotypic classes that grade continuously from most susceptible (0 dominant alleles) to most resistant (6 dominant alleles). Intermediate classes overlap, producing the smooth bell-shaped distribution seen in Fig. 2.1.
See working — polygenic inheritance: many genes affect the same trait, each allele has a small effect, and alleles at different loci act additively (e.g. 3 genes × 2 alleles → 0–6 dominant alleles → 7 graded phenotypic classes).
Background Concept
Most Mendelian traits (e.g. tall vs dwarf in peas) are governed by a single gene with two alleles, producing a small number of distinct phenotypes — this is discontinuous variation. Many important quantitative traits in plants and animals (height, mass, yield, disease resistance) are governed by many genes acting on the same character, with each allele contributing a small effect. Such traits are described as polygenic, and because the effects of many alleles add together, the phenotype takes a continuous range of values — continuous variation.
When the alleles at different loci act additively, the phenotype depends on the total number of "plus" (or "minus") alleles carried. With genes each having two alleles (one +, one –), a plant can carry plus alleles, giving phenotypic classes. Environmental variation around each genotype blurs the boundaries between classes, producing a smooth, bell-shaped distribution.
Understanding the Question
The F₂ distribution in Fig. 2.1 is bell-shaped and continuous, with the two parental means near the extremes and an F₂ mean between them. The question asks for the genetic basis of this pattern. The answer must combine: (1) the polygenic nature of resistance, (2) the additive nature of allele effects, and (3) a numerical illustration of how the additive effects generate a continuous distribution.
Approach
Identify the trait as polygenic, explain that each allele has a small additive effect, and illustrate the additive logic with a small numerical example (three genes → seven classes, intermediate classes overlap into a smooth curve).
Step-by-Step Reasoning
- Polygenic basis: percentage leaf damage is governed by many genes, not one.
- Common trait: all of these genes act on the same phenotypic character — leaf damage / resistance.
- Small allele effects: each individual allele (dominant or recessive at each locus) makes only a small contribution.
- Additive effects: the total phenotype is determined by the sum of contributions from all the relevant alleles — the more "resistance alleles" a plant has, the lower its leaf damage.
- Numerical illustration: with three independent loci A/a, B/b, C/c, each plant carries between and dominant (resistance) alleles, giving the genotypic count distribution , i.e. approximately . Seven phenotypic classes blend (especially when the environment also contributes small random effects), producing a smooth bell-shaped distribution like that in Fig. 2.1.
Key Takeaways
- Continuous variation in the F₂ of a cross between two contrasting parents is the classic signature of polygenic inheritance.
- The more genes involved, the smoother and more bell-shaped the distribution becomes.
- Allelic effects are additive at each locus, and the phenotypes across loci combine additively into a quantitative trait.
Common Mistakes
- Saying "the genes act independently" — they do not act independently on the phenotype; their effects are additive, but the genes themselves segregate independently at meiosis.
- Writing only "polygenic" without explaining why it produces a continuous distribution.
- Confusing polygenic inheritance with codominance or with multiple alleles at a single locus (these would give discrete, not continuous, classes).
- Failing to include a numerical/quantitative illustration of the additive effect (the mark scheme specifically rewards this).
Things to Be Careful About
- The two extremes of the F₂ distribution lie near, but do not coincide with, the two parental means because F₂ plants cannot assemble all of the resistance alleles from both parents.
- The fact that the F₂ mean lies roughly between the two parental means (here, ≈40%) is consistent with additive polygenic inheritance.
- Mark scheme wording: "polygenic" alone is not credited as an explanation unless it is tied to additive effects of multiple alleles on the same trait.
Plants have several different photosynthetic pigments in their chloroplasts.
A student separated and identified the chloroplast pigments present in a leaf extract from a spinach plant using two slightly different methods.
Method A
• A type of chromatography known as thin layer chromatography (TLC) was used to separate the pigments.
• A mixture of ether and cyclohexane was used as a solvent in TLC.
Method B
• The student repeated TLC but treated the spinach leaf extract with a chemical. The chemical causes a magnesium ion in a pigment to be replaced by two hydrogen ions.
• The student used a leaf from the same spinach plant, and used the same solvent as in method A.
The student calculated values and compared these to reference values to identify the pigments.
Fig. 3.1 shows the results for method A and method B.
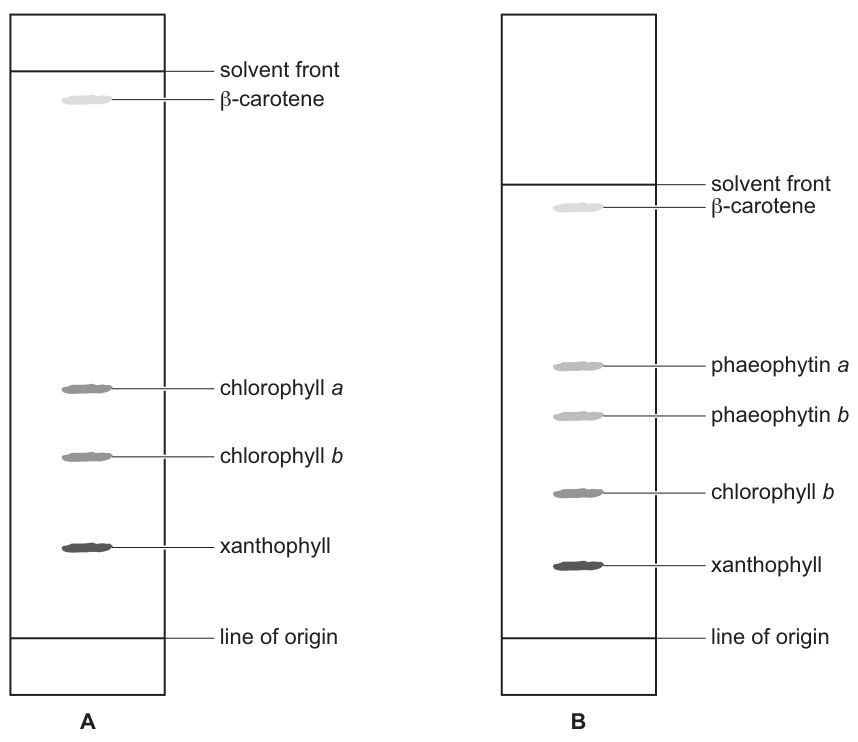
Fig. 3.1
Working
From chromatogram A in Fig. 3.1, β-carotene has travelled almost as far as the solvent front; reading the chromatogram gives a ratio of 0.95.
Answer
0.95
0.95
Background Concept
Thin-layer chromatography (TLC) separates a mixture of compounds by partitioning them between a stationary phase (the silica or alumina coating on the plate) and a mobile phase (the solvent that travels up the plate by capillary action). The retention factor, , is the ratio of the distance a spot moves to the distance the solvent front moves:
is a pure number with no units and always lies between 0 (pigment does not leave the origin) and 1 (pigment travels with the solvent front). Pigments more soluble in the mobile phase and less attracted to the stationary phase have higher values. β-carotene is a non-polar hydrocarbon pigment, so in a non-polar solvent such as ether/cyclohexane it travels close to the solvent front.
Understanding the Question
The question gives the chromatogram of spinach leaf extract (method A, Fig. 3.1) and asks for the value of β-carotene. The 2 marks are awarded for showing the formula and giving the correct numerical answer (0.95).
Approach
Identify the β-carotene spot in chromatogram A, estimate the ratio of its migration to that of the solvent front, and quote the value as a number with no units.
Step-by-Step Reasoning
- Recall the definition of .
- On chromatogram A, the β-carotene spot sits very close to the solvent front — only a thin gap remains above it.
- The ratio is therefore very close to 1; the value accepted by the mark scheme is 0.95.
- has no units, so write "0.95" alone on the answer line.
Key Takeaways
- is dimensionless and always lies between 0 and 1.
- β-carotene is the most non-polar leaf pigment, hence its very high in non-polar solvents.
- Comparing values to published reference values is the standard way to identify an unknown pigment.
Common Mistakes
- Writing a unit such as "cm" or "mm" after the number — is dimensionless.
- Inverting the ratio (solvent ÷ pigment) and getting a value slightly greater than 1.
- Measuring to the leading edge of the spot rather than its centre.
Things to Be Careful About
- Quote the answer to two decimal places as the mark scheme does.
- Do not confuse the solvent-front distance with the distance from the origin to β-carotene.
Suggest two explanations for the differences in appearance of chromatograms A and B in Fig. 3.1.
Answer
- Chromatogram B was run for a shorter time (or stopped earlier) than chromatogram A — the gap between β-carotene and the solvent front is larger in B, so the solvent had not travelled as far.
- The chemical used in method B replaced the Mg²⁺ ion in chlorophyll with two H⁺ ions, converting chlorophyll into phaeophytin — this is why B shows phaeophytin a and phaeophytin b spots instead of chlorophyll a (and the chlorophyll b spot is also affected).
1 B was run for less time / stopped early; 2 chlorophyll was converted to phaeophytin.
Background Concept
Two distinct effects explain the visual differences between chromatograms A and B:
- Running time. The further the solvent is allowed to travel, the higher the pigment spots rise on the plate. If a chromatogram is stopped early, the solvent front is closer to the top but the pigments are correspondingly lower down.
- Conversion of chlorophyll to phaeophytin. Chlorophylls contain a central Mg²⁺ ion coordinated inside a porphyrin ring. Treatment with acid (or a chemical that donates protons) replaces Mg²⁺ with 2 H⁺, producing phaeophytin, a grey-green pigment with slightly different polarity and therefore different mobility. This is essentially what happens when leaves are boiled in dilute HCl.
Understanding the Question
Method A is a normal TLC run of spinach leaf extract. Method B repeats TLC on the same extract but pre-treats it with a chemical that converts chlorophyll to phaeophytin. The student must suggest two explanations for the differences between chromatograms A and B in Fig. 3.1.
Approach
Inspect both chromatograms side by side and identify what has changed: (i) the relative position of the solvent front and β-carotene, and (ii) the appearance of new spots labelled phaeophytin a and phaeophytin b.
Step-by-Step Reasoning
- Difference 1 — running time. In A, β-carotene is only just below the solvent front; in B, β-carotene is further below the solvent front. The solvent front is higher in B because the chromatogram was stopped earlier, so the pigments have not migrated as far.
- Difference 2 — chemical conversion. Chromatogram B contains phaeophytin a and phaeophytin b spots that are absent in A, while the chlorophyll a spot has disappeared. The chemical used in method B has converted chlorophyll into phaeophytin by replacing Mg²⁺ with 2 H⁺.
- (Optional AVP): chlorophyll b may also have been partly converted, but the figure shows that some chlorophyll b remains in B — possibly because the treatment was not complete or only partial.
Key Takeaways
- The central Mg²⁺ of chlorophyll is essential for its characteristic absorption; replacing it with protons changes the pigment's identity and its chromatographic mobility.
- Comparing chromatograms requires you to consider both the chemistry of the sample and the mechanics of the run.
Common Mistakes
- Saying only that "the pigments look different" without identifying the chlorophyll → phaeophytin conversion.
- Saying "different solvent" or "different plant" — both are explicitly ruled out by the question.
- Confusing the polarity argument: phaeophytin is more polar than chlorophyll, so it travels LESS far (lower Rf) — not the same as "stops earlier".
Things to Be Careful About
- The two explanations are independent and both required for full marks.
- Always link the difference in chromatogram to its cause (chemical conversion OR running time).
The student found some different values for the chloroplast pigments of spinach in a scientific paper.
The values in the scientific paper were different from the reference values that the student originally used to identify the pigments on chromatograms A and B in Fig. 3.1.
Suggest one reason, other than measurement error, for the different values.
Answer
A different solvent / solvent mixture was used (or a different TLC plate / stationary phase was used, or the chromatography was carried out at a different temperature).
Different solvents (or different stationary phase, or different temperatures) were used.
Background Concept
values are not absolute physical constants — they depend on the exact conditions under which the chromatogram is run. Three variables are particularly important:
- Solvent composition. Different solvents (or different proportions in a solvent mixture) interact differently with each pigment and with the stationary phase, changing how far each pigment travels.
- Stationary phase. Silica gel, alumina, cellulose and reversed-phase plates all give different values for the same compound.
- Temperature. Higher temperatures reduce solvent viscosity and change partitioning equilibria; values usually rise with temperature.
Other variables (humidity, plate thickness, sample volume) can also have small effects.
Understanding the Question
The student's reference values, taken under one set of conditions, do not match those reported in a scientific paper for the same spinach pigments. The student must suggest one non-error reason for the discrepancy.
Approach
Pick the variable most likely to differ between a school laboratory and a published paper — different solvents are the commonest cause.
Step-by-Step Reasoning
- The mark scheme accepts any ONE of: different solvent, different stationary phase, or different temperature.
- In practice, scientific papers often use different solvent systems (e.g. acetone/petroleum ether, methanol/ethyl acetate) from those used in teaching laboratories (e.g. ether/cyclohexane), so different solvents is the most likely explanation.
- Whichever reason is given, it must be specific and experimentally meaningful.
Key Takeaways
- values are only comparable when chromatograms are run under identical conditions.
- Always report the solvent, stationary phase and temperature when publishing data.
Common Mistakes
- "Measurement error" or "human error" — explicitly excluded by the question.
- "Different plant species" — the question states both used spinach.
- Vague answers such as "different conditions" without saying WHICH conditions differed.
Things to Be Careful About
- One clearly-articulated point is enough — do not waste time giving three for a 1-mark question.
Fig. 3.2 shows the absorption spectra of some chloroplast pigments.
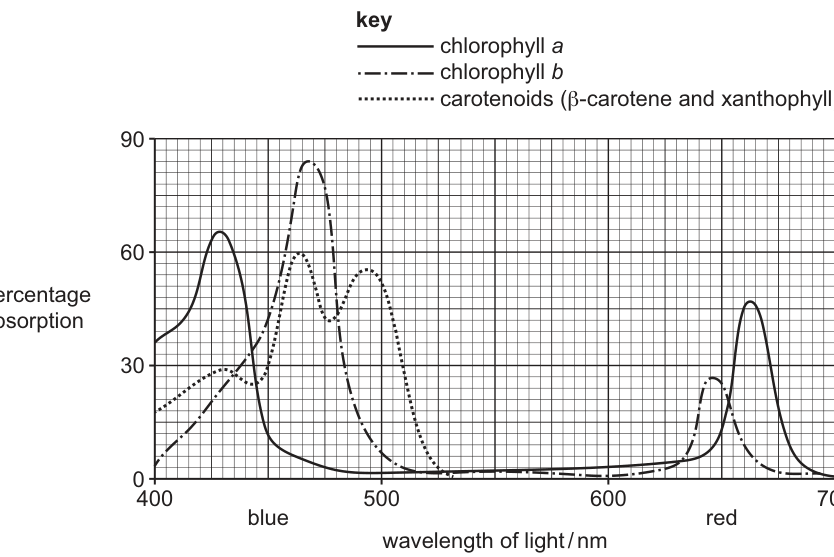
Fig. 3.2
Use Fig. 3.2 to compare the similarities and differences between the absorption spectra of chlorophyll and carotenoids.
Answer
Similarities:
- Both chlorophyll a and carotenoids absorb light in the blue/violet region (between 400 and 475 nm).
- Both pigments absorb very little or no green–yellow light (between about 525 and 630 nm).
Differences:
- Chlorophyll a absorbs at a wider range of wavelengths than carotenoids, because it also absorbs in the red region (600–680 nm), where carotenoids absorb essentially no light.
- Chlorophyll a has only two peaks (one blue at ~430 nm and one red at ~660 nm), whereas carotenoids have three peaks, all in the 400–500 nm blue region (approximately 430 nm, 460 nm and 490 nm).
- The highest blue-region peak of chlorophyll a is at ~430 nm; the highest carotenoid peak is at ~460–465 nm.
- Between 400 and 445 nm, chlorophyll a absorbs more strongly than carotenoids; between 445 and 525 nm, carotenoids absorb more strongly than chlorophyll a.
See comparison above.
Background Concept
An absorption spectrum is a graph of how strongly a pigment absorbs light at each wavelength. Each photosynthetic pigment has a characteristic spectrum determined by its molecular structure:
- Chlorophyll a has a porphyrin ring with a central Mg²⁺; it absorbs strongly in the blue (~430 nm) and red (~660 nm) regions, leaving a "green gap" between them.
- Chlorophyll b is similar but with an aldehyde group instead of a methyl group; its peaks are shifted slightly toward the centre of the spectrum.
- Carotenoids (β-carotene and xanthophylls) are long hydrocarbon chains with extensive conjugated double bonds; they absorb only in the 400–500 nm region and so appear yellow/orange (they transmit these wavelengths).
The mixture of pigments in a chloroplast allows the plant to harvest a much broader range of wavelengths than any single pigment could. Carotenoids also quench excess light energy and protect chlorophyll from photo-oxidation.
Understanding the Question
Fig. 3.2 plots percentage absorption against wavelength (400–700 nm) for chlorophyll a (solid), chlorophyll b (dashed) and carotenoids (dotted). The student must compare the chlorophyll a curve with the carotenoid curve, identifying both similarities and differences, and quote approximate wavelengths from the graph.
Approach
Read the two curves carefully:
- Chlorophyll a: peaks at ~430 nm and ~660 nm; near-zero absorption in the 500–600 nm region.
- Carotenoids: three peaks in the 400–500 nm range (around 430, 460 and 490 nm); no absorption above ~550 nm.
Identify shared features (both absorb in blue; both fail to absorb in green–yellow) and then the differences (chlorophyll a has a red peak; carotenoids have three blue peaks; the blue peaks are at different wavelengths; the relative strengths in different blue sub-regions differ).
Step-by-Step Reasoning
Similarities (any 2):
- Both pigments absorb in the blue/violet part of the spectrum, between 400 and 475 nm.
- Both pigments absorb very little (almost none) of the green–yellow light between ~525 and ~630 nm.
Differences (any 3):
3. Chlorophyll a absorbs across a wider range of wavelengths than carotenoids because it also absorbs in the red region (600–680 nm), where carotenoids show no absorption.
4. Chlorophyll a shows two distinct peaks (blue ~430 nm and red ~660 nm); carotenoids show three peaks, all within the 400–500 nm range.
5. Chlorophyll a's peak in the blue is at ~430 nm, while carotenoids' highest peak is at ~460–465 nm.
6. Between 400 and 445 nm, chlorophyll a absorbs more strongly than carotenoids; between 445 and 525 nm, carotenoids absorb more strongly than chlorophyll a.
The biological consequence is that leaves look green because both pigment groups transmit green light, while plants use the combined set of pigments to absorb across almost the entire visible spectrum.
Key Takeaways
- Photosynthetic pigments work together as an "antenna" to harvest a wide spectrum of light.
- The "green gap" (500–600 nm) explains why leaves appear green.
- Reading an absorption spectrum requires quoting wavelength ranges with units (nm).
Common Mistakes
- Stating that chlorophyll a "absorbs more wavelengths" without naming the red region specifically.
- Confusing carotenoids with chlorophyll b (note that chlorophyll b is the dashed line in Fig. 3.2).
- Vague answers such as "chlorophyll absorbs more" without giving wavelength values.
- Counting both chlorophyll a peaks AND carotenoid peaks without comparing them.
Things to Be Careful About
- Always include numerical wavelengths from the graph (e.g. "~430 nm", "600–680 nm") to support each point.
- For "compare" questions the mark scheme wants both similarities AND differences, with a maximum on the differences side.
In some species of plant, the absorption of light stimulates seed germination.
The absorption of light increases the production of gibberellin in the embryo of a seed.
Describe the role of gibberellin in the germination of a seed.
Answer
- Gibberellin produced by the embryo diffuses to and acts on the aleurone layer surrounding the endosperm.
- Gibberellin binds to its receptor GID1 in aleurone cells.
- This binding triggers breakdown of DELLA proteins (transcriptional repressors).
- The released PIF (phytochrome-interacting factor) transcription factor switches on genes encoding hydrolytic enzymes, particularly α-amylase.
- α-amylase is secreted into the endosperm where it hydrolyses starch → maltose (and then to glucose).
- The soluble sugars are transported to the embryo and used for respiration and growth of the embryo.
Gibberellin acts on the aleurone layer, binds GID1, causes DELLA breakdown, releases PIF to switch on amylase genes; amylase hydrolyses starch to sugars which fuel embryo respiration and growth.
Background Concept
Gibberellin (GA) is a plant hormone that promotes seed germination. In cereal grains (and similar seeds with persistent endosperm), the embryo produces gibberellin in response to water uptake and (in many species) light. Gibberellin then diffuses to the aleurone layer, a protein-rich tissue surrounding the starch-filled endosperm. The molecular pathway involves:
- Receptor binding. Gibberellin binds to the soluble receptor GID1 (Gibberellin Insensitive Dwarf 1) in aleurone cells.
- DELLA degradation. The GID1–GA complex recruits and activates an E3 ubiquitin ligase that tags DELLA proteins (transcriptional repressors) for destruction by the proteasome.
- Transcription factor release. With DELLA removed, PIF (Phytochrome-Interacting Factor) transcription factors are released and can activate target genes.
- Gene expression. PIF switches on genes encoding hydrolytic enzymes, particularly α-amylase (and also maltase, proteases).
- Starch hydrolysis. α-Amylase is secreted into the starchy endosperm where it hydrolyses starch → maltose → glucose.
- Embryo nutrition. Soluble sugars are transported to the embryo, providing substrate for respiration (ATP) and biosynthesis (growth).
Understanding the Question
The question has already told the student that light absorption by the seed increases gibberellin production in the embryo. It now asks the student to describe the role of gibberellin in germination — i.e. to trace the chain of events from gibberellin release to embryo growth. Four marks are available, so the response must combine the cellular target, the molecular mechanism and the physiological outcome.
Approach
Write the answer as a chain of events: gibberellin → target tissue → receptor → DELLA breakdown → transcription factor → gene expression → enzyme action → substrate breakdown → embryo nutrition.
Step-by-Step Reasoning
- Target tissue: gibberellin produced by the embryo moves to (acts on) the aleurone layer around the endosperm.
- Receptor: gibberellin binds to GID1, its intracellular receptor.
- Repressor removal: binding causes breakdown (ubiquitin-mediated proteolysis) of DELLA proteins.
- Transcription factor release: freed PIF transcription factors enter the nucleus.
- Gene expression: PIF activates transcription of genes for amylase (and other hydrolytic enzymes).
- Enzyme action: α-amylase hydrolyses the starch stored in the endosperm to maltose (and maltase to glucose).
- Embryo nutrition: the soluble sugars diffuse to the embryo, where they are respired to provide ATP and used as building blocks for growth.
Key Takeaways
- Gibberellin does NOT break down starch directly — it induces the production of the enzyme that does.
- The DELLA-repressor mechanism is a recurring motif in plant signalling: many hormones (GA, auxin, brassinosteroids, jasmonate) act by removing a repressor protein rather than by directly activating a transcription factor.
- Seed germination is fundamentally the mobilisation of stored reserves by hormone-induced enzymes, fueling the embryo until photosynthesis can take over.
Common Mistakes
- Stating that gibberellin "breaks down starch" — it does not; it triggers enzyme synthesis.
- Confusing gibberellin's role with that of auxin (auxin promotes cell elongation; gibberellin here promotes enzyme synthesis).
- Omitting any of the molecular detail (GID1, DELLA, PIF) — the mark scheme specifically rewards each of these.
- Spelling "aleurone" as "alerone" or "aleurine"; the correct spelling is aleurone.
Things to Be Careful About
- Use the exact terminology in the mark scheme: aleurone layer, GID(1), DELLA protein, PIF (transcription factor), amylase, starch → maltose/glucose, respiration/growth of embryo.
- Mention the ENDOSPERM as the source of the starch — the enzymes are made in the aleurone layer but act on starch in the endosperm.
The wolf, Canis lupus, lives in North America. Wolves may have a grey or a black coat colour. The colour of an individual wolf depends on the DNA it inherits at the CPD103 gene locus.
• Wolves inherit two copies of CPD103, one from each parent.
• Wolves that inherit one copy of the black form of the CPD103 gene have a black coat.
State the term used to describe:
• an organism that has two copies of each gene ______
• a form of a gene ______
• a form of a gene that gives a phenotypic effect in a heterozygote. ______
Answer
- an organism that has two copies of each gene: diploid
- a form of a gene: allele
- a form of a gene that gives a phenotypic effect in a heterozygote: dominant
diploid; allele; dominant
Background Concept
Genetics has its own vocabulary that must be used precisely. CIE mark schemes reward the exact term, not a paraphrase, so three standard definitions are needed here:
- Diploid: a cell or organism that contains two complete sets of chromosomes (and therefore two copies of every gene, one inherited from each parent). The wolf is diploid because it inherits one copy of CPD103 from each parent.
- Allele: one of the alternative forms of a gene that occupies the same locus (position) on homologous chromosomes. The CPD103 gene has at least two alleles — the grey form and the black form.
- Dominant: an allele that is expressed in the phenotype even when paired with a different allele (i.e. in the heterozygote). Because one copy of the black CPD103 allele is enough to give a black coat, the black allele is dominant over the grey allele.
Understanding the Question
This is a "state the term" question — three short, independent definitions, each worth one mark. The descriptions are given in the stem, and the candidate simply supplies the correct technical word. No working, no explanation is required.
Approach
Read each description carefully, match it to the standard CIE term, and write only that term. Avoid giving a definition when only the word is wanted.
Step-by-Step Reasoning
- "Two copies of each gene" describes the ploidy of the organism. The word is diploid (do not write "diploidy", which refers to the state, not the organism).
- "A form of a gene" is the textbook definition of an allele.
- "A form of a gene that gives a phenotypic effect in a heterozygote" is the textbook definition of a dominant allele. The mark scheme accepts "dominant" alone, but "dominant allele" is also fine and slightly more precise.
Key Takeaways
- Diploid, allele and dominant are three of the most frequently tested CIE terms — they must be learnt as one-line definitions.
- The heterozygote clue is the diagnostic feature of a dominant allele, distinguishing it from recessive and codominant alleles.
Common Mistakes
- Writing "diploidy" instead of "diploid" (diploidy is the condition; diploid describes the cell/organism).
- Writing "gene" instead of "allele" for the second blank — a gene is the locus; an allele is one variant.
- Writing "recessive" for the third blank by misreading "gives a phenotypic effect in a heterozygote" as "masked in a heterozygote".
Things to Be Careful About
- Keep the three answers as single words/short phrases; definitions written out as sentences are not credited when the command word is "state".
In addition to producing black coat colour, the protein coded for by the CPD103 gene also defends against infectious lung disease.
Canine distemper virus (CDV) causes serious lung disease in wolves. Wolves that have been previously infected by CDV have antibodies against CDV (anti-CDV antibodies) in their blood.
CDV can be passed from domestic dogs to wolves.
• Domestic dogs are more numerous in the southern part of the area occupied by wolves.
• Domestic dogs are less numerous in the northern part of the area occupied by wolves.
• The relative frequency of black wolves compared to grey wolves increases from the north to the south of the area they occupy.
Explain how natural selection causes this trend in the distribution of black wolves.
Answer
- CDV is a selection pressure acting on the wolf population.
- The (dominant) allele for black coat confers resistance to CDV / gives a selective advantage when CDV is common.
- In the south, domestic dogs are more numerous, so more CDV is transmitted to wolves.
- Black wolves are more likely to survive CDV infection (selective advantage) than grey wolves.
- Surviving black wolves are more likely to breed and reproduce, passing on the black allele.
- Over generations, the frequency of the black allele (and of black-coated wolves) increases, especially in the south where CDV pressure is highest.
Natural selection by CDV (more prevalent in the south) favours black wolves, which are more likely to survive, reproduce and pass on the black allele, increasing its frequency from north to south.
Background Concept
Natural selection is the differential survival and reproduction of individuals due to differences in phenotype, leading to a change in allele frequency in a population across generations. For natural selection to operate, three conditions are required:
- Variation in the population (here, grey vs. black coat, caused by different CPD103 alleles).
- A selection pressure — an environmental factor that affects survival or reproduction (here, infection by canine distemper virus, CDV).
- The variation must be heritable so that successful phenotypes pass their alleles to the next generation. The black coat allele is heritable because it is a DNA variant at CPD103.
Because the CPD103 protein also defends against CDV, the same allele that determines coat colour influences disease resistance — a classic example of pleiotropy (one gene affecting multiple, apparently unrelated, phenotypic traits).
Understanding the Question
The stem gives the geographical context: domestic dogs (the CDV reservoir) are commoner in the south, and black wolves are commoner in the south. The command word is "explain", so the candidate must give a chain of cause-and-effect statements that link these two observations through natural selection. Four marks are available, and the mark scheme requires at least one explicit reference to the southern context.
Approach
Structure the answer as a logical sequence: state the selection pressure → describe the advantage the black allele gives → apply the geographical gradient → explain the consequences for survival → explain the consequences for reproduction → explain the change in allele frequency. Use comparative wording (black vs. grey) and the "ORA" (or reverse argument) phrasing that the mark scheme explicitly allows.
Step-by-Step Reasoning
- Selection pressure: CDV, transmitted from domestic dogs, is a selection pressure acting on wolves.
- Heritable advantage: the black allele at CPD103 codes for a protein that defends against CDV infection, so black wolves have a selective advantage in areas where CDV is common.
- Geographical gradient: in the south, more dogs → more CDV → stronger selection pressure; in the north, fewer dogs → less CDV → weaker selection pressure.
- Differential survival: black wolves are more likely to survive CDV infection; grey wolves are more likely to die (ORA — the reverse argument is also creditworthy).
- Differential reproduction: surviving black wolves reproduce, so they pass on the black allele to their offspring (ORA for grey wolves).
- Change in allele frequency: over generations, the frequency of the black allele increases in the south, producing the observed increase in the proportion of black wolves from north to south.
Key Takeaways
- Natural selection is a chain: variation → selection pressure → differential survival → differential reproduction → change in allele frequency.
- A single allele can be under selection for more than one reason — here, the black allele is selected because of the protection it gives, not because of the colour itself. This is a key insight that distinguishes selection on a phenotype from selection on an underlying function.
- Selection pressures can vary geographically, producing clines (gradients) in allele frequency.
Common Mistakes
- Stating that wolves "choose" to be black — natural selection has no foresight.
- Describing the trend without naming the selection pressure (CDV) or the mechanism (differential survival and reproduction).
- Saying black wolves "are immune" — the mark scheme wording is "resistance" / "(selective) advantage"; overstating the protection suggests the candidate has over-simplified.
- Failing to mention the north–south context; the mark scheme explicitly states that this context must be established at least once for full marks.
Things to Be Careful About
- The trend in the data is in the wolves, not the dogs. Make sure the survival/reproduction statements refer to wolves.
- The ORA (or reverse argument) phrasing means that explicit comparison with grey wolves is credited wherever the mark scheme uses "ORA greys".
Several different populations of wolves were compared.
Fig. 4.1 shows the relationship between the percentage of wolves in a population that have anti-CDV antibodies in their blood and the percentage of wolves in that population that are black. The line of best fit was calculated after comparing the different populations of wolves.
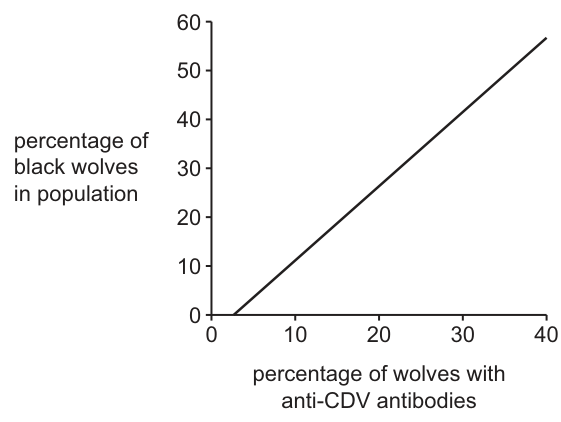
Fig. 4.1
With reference to Fig. 4.1, state the relationship between the percentage of wolves with anti-CDV antibodies and wolf coat colour, and suggest reasons for this relationship.
Answer
Relationship (from Fig. 4.1):
There is a positive (linear) correlation — as the percentage of wolves with anti-CDV antibodies in a population increases, the percentage of black wolves in that population also increases.
Reasons for the relationship:
- Wolves that have survived a previous CDV infection retain anti-CDV antibodies in their blood.
- A high percentage of wolves with anti-CDV antibodies therefore indicates a population that has experienced a high level of past CDV exposure.
- In populations with high CDV exposure, grey wolves (without the protective black allele) are more likely to have died, leaving a higher proportion of black wolves.
- The CPD103 allele that codes for black coat colour also codes for a protein that defends against CDV, so the black allele confers a survival advantage in populations where CDV is common.
- (AVP) The two variables co-vary because both are driven by the same underlying factor — the prevalence of CDV in the local wolf population.
Positive correlation: as % with anti-CDV antibodies rises, % of black wolves rises. Explained by higher CDV exposure selecting for the black allele, which gives CDV resistance, leaving more black survivors.
Background Concept
When a pathogen infects a vertebrate, the adaptive immune system produces specific antibodies against it; these antibodies persist in the blood long after recovery. The presence of antibodies in a blood sample is therefore used as a marker that the individual has previously been exposed to (and survived) that pathogen. In ecology and epidemiology, the percentage of individuals in a population carrying antibodies to a particular disease is used as a proxy for how commonly that disease circulates in that population.
Combined with the previous part, the question is testing the candidate's ability to:
- Read a graph — describe the trend shown by the line of best fit, including direction and (qualitative) strength.
- Infer causation — connect antibody prevalence to past disease prevalence, and disease prevalence to differential mortality by coat colour.
Understanding the Question
The stem tells the candidate that Fig. 4.1 plots two percentages for several wolf populations: the x-axis is the % of wolves with anti-CDV antibodies, and the y-axis is the % of black wolves. The line of best fit slopes upward from lower-left to upper-right. The candidate must (1) describe the relationship shown and (2) suggest biological reasons for it. Four marks are available: one for the relationship and three for the reasoning.
Approach
- Description (1 mark): state that there is a positive correlation and, ideally, that it is (approximately) linear. The mark scheme accepts "positive correlation / positive relationship / direct relationship / directly proportional / as % with antibodies increases the % of black wolves increases".
- Reasoning (3 marks): build a chain — antibodies indicate past CDV exposure; high exposure means high selection pressure; in high-exposure populations, grey wolves die more often because they lack the protective protein; black wolves survive and so make up a larger fraction of the population; the protective protein is encoded by the same black allele that determines coat colour (pleiotropy).
Step-by-Step Reasoning
- Reading the graph: at 0% antibodies, the line of best fit starts near 0% black; at 40% antibodies, it reaches about 58% black. The slope is positive and approximately straight, indicating a strong positive linear correlation.
- Antibodies as a marker: anti-CDV antibodies are produced by wolves that have survived a CDV infection; they remain in the blood afterwards. A high proportion of wolves with antibodies therefore implies that CDV has been common in that population.
- Link to coat colour: in populations where CDV has been common, the black CPD103 allele has given its carriers a survival advantage (the protein also defends against CDV). Grey wolves lacking this advantage have died in greater numbers.
- Consequence for the ratio: because grey wolves have been removed from the population by selection while black wolves have survived, the percentage of black wolves is higher in populations that have experienced more CDV.
- Connecting the two axes: the two plotted variables are not independent — they are both downstream effects of the same underlying cause, the prevalence of CDV. Antibody prevalence is a measure of past CDV exposure; black-coat prevalence is a measure of the selective mortality that CDV has imposed.
- (AVP): candidates can add the insight that the CPD103 gene is pleiotropic — the same allele codes for both coat colour and disease resistance — which is why the two variables are so tightly correlated.
Key Takeaways
- Antibody prevalence in a population is a useful proxy for the historical prevalence of a disease.
- Phenotypes and molecular markers can co-vary because they are produced by the same gene (pleiotropy) or by tightly linked genes.
- A correlation on a graph does not by itself prove causation — here, both variables are linked through a third (CDV prevalence), and the candidate should articulate that link.
Common Mistakes
- Describing the correlation as "causal" (i.e. claiming antibodies cause black coats, or vice versa). The correct framing is that both are caused by CDV prevalence.
- Reading the graph imprecisely — for example, saying the line "goes through the origin" when it clearly intercepts the y-axis at a small positive value. The mark scheme does not require intercept analysis, but loose description costs marks.
- Failing to mention the gene/protein connection. The mark scheme explicitly requires reference to "gene / DNA / allele / protein that gives black coat, helps survival / gives resistance to CDV / defends against CDV". A purely phenotypic answer ("black wolves are tougher") is not credited.
Things to Be Careful About
- The graph is a correlation across populations, not within a single population over time. The candidate should phrase the explanation in terms of comparing populations, not individuals.
- The line of best fit is statistical; one mark is for the description, three for the explanation. Do not spend all four marks on graph reading.
The endocrine system and the nervous system both coordinate responses in mammals.
Complete Table 5.1 to show the features of three cell-signalling molecules of the endocrine system: antidiuretic hormone (ADH), glucagon and insulin.
Use a tick (✓) if the molecule has the feature and a cross (✗) if the molecule does not have the feature.
Put a tick (✓) or a cross (✗) in every box.
Table 5.1
| feature | ADH | glucagon | insulin |
|---|---|---|---|
| binds to receptors on cell surface membranes | |||
| results in molecules moving from cells into the blood | |||
| is secreted as a result of detection by osmoreceptors |
Answer
| feature | ADH | glucagon | insulin |
|---|---|---|---|
| binds to receptors on cell surface membranes | ✓ | ✓ | ✓ |
| results in molecules moving from cells into the blood | ✓ | ✓ | ✗ |
| is secreted as a result of detection by osmoreceptors | ✓ | ✗ | ✗ |
ADH ✓✓✓; glucagon ✓✓✗; insulin ✓✗✗
Background Concept
The endocrine system coordinates responses through hormones released into the bloodstream. The three hormones in this question (ADH, glucagon, insulin) are all peptide/protein hormones. Because they are water-soluble they cannot pass through the phospholipid bilayer of the cell-surface membrane and instead bind to receptors on the outer surface of target cells, triggering intracellular second-messenger cascades (e.g. the cAMP cascade for glucagon).
- ADH (antidiuretic hormone, also called vasopressin) is produced by the hypothalamus and released from the posterior pituitary. It increases the permeability of the collecting duct to water, so more water is reabsorbed from the filtrate back into the blood.
- Glucagon is secreted by α (alpha) cells of the islets of Langerhans in the pancreas. It raises blood glucose by stimulating glycogenolysis (breakdown of glycogen) and gluconeogenesis in liver cells, releasing glucose into the blood.
- Insulin is secreted by β (beta) cells of the islets of Langerhans. It lowers blood glucose by promoting the uptake of glucose into body cells (especially muscle and adipose tissue) and by stimulating glycogenesis.
Understanding the Question
A feature-comparison table is given with three rows (features) and three columns (hormones). The candidate must decide for each cell whether the feature applies, and place a tick (✓) or cross (✗). Every box must be filled.
Approach
For each cell, evaluate whether the property applies based on the mechanism of that hormone:
- Cell-surface receptor binding — applies to all three because they are peptide hormones.
- Molecules moving from cells into the blood — ADH causes water to leave cells (reabsorbed); glucagon causes glucose to leave liver cells; insulin does the opposite (glucose enters cells).
- Secretion in response to osmoreceptors — only ADH is released when osmoreceptors in the hypothalamus detect raised blood solute concentration (low water potential). Glucagon and insulin are released in response to changes in blood glucose detected by pancreatic islet cells.
Step-by-Step Reasoning
-
Row 1 (binds to receptors on cell surface membranes): ADH, glucagon and insulin are all peptide hormones. They are hydrophilic and cannot diffuse across the phospholipid bilayer, so they bind to specific transmembrane receptors on the outer surface of target cells. All three receive a tick. ✓ ✓ ✓
-
Row 2 (results in molecules moving from cells into the blood):
- ADH increases water reabsorption from the collecting duct, so water moves from the filtrate (and ultimately cells) into the blood. ✓
- Glucagon stimulates glycogenolysis in liver cells, releasing glucose from intracellular stores into the blood. ✓
- Insulin has the opposite effect: it increases glucose uptake into cells, so glucose moves from the blood into cells, NOT from cells into blood. ✗
-
Row 3 (is secreted as a result of detection by osmoreceptors):
- ADH is released when osmoreceptors in the hypothalamus detect a fall in blood water potential. ✓
- Glucagon is released by α cells of the islets of Langerhans in response to LOW blood glucose. ✗
- Insulin is released by β cells of the islets of Langerhans in response to HIGH blood glucose. ✗
Key Takeaways
- All three hormones are peptides and bind to cell-surface receptors.
- ADH and glucagon both cause molecules to leave cells and enter the blood; insulin causes molecules to enter cells (the opposite direction).
- Only ADH is released in response to osmoreceptor detection; glucagon and insulin respond to blood glucose levels.
Common Mistakes
- Putting a tick for insulin in the second row (insulin moves glucose INTO cells, not out).
- Confusing the triggers of glucagon and insulin: both respond to blood glucose, but glucagon responds to LOW and insulin to HIGH; neither responds to osmoreceptors.
- Thinking peptide hormones enter the cell directly. Only lipid-soluble hormones (steroids, thyroid hormones) cross the membrane; peptide hormones bind externally.
Things to Be Careful About
- The question asks about the TRIGGER for secretion, not the target cell. ADH's target is the collecting duct, but its trigger is osmoreceptor detection.
- Cell-surface receptor binding is a feature of water-soluble hormones, distinguishing them from lipid-soluble hormones (steroids) that bind intracellular receptors.
- A tick or cross in every cell is required — a blank box is a lost mark.
The endocrine system has a slower transmission speed than the nervous system.
Describe other ways in which the endocrine system and the nervous system differ.
Answer
Any four of:
- The nervous system transmits impulses / action potentials / neurotransmitters, whereas the endocrine system transmits hormones.
- The nervous signal is electrical (along the axon) and chemical (across the synapse), whereas the endocrine signal is chemical (hormones in the blood).
- The nervous signal travels along neurones, whereas the endocrine signal travels in the blood.
- The nervous system produces a localised / specific effect on particular target cells, whereas the endocrine system produces a widespread effect on any cell with the appropriate receptor.
- The nervous response is rapid, whereas the endocrine response is slow. (Already given in stem — do not repeat.)
- The nervous response is short-lived, whereas the endocrine response is long-lasting.
See comparison list
Background Concept
The nervous system and the endocrine system are the two main coordination systems in mammals. They use different signals, follow different routes, and have different speeds and durations of action:
- Nature of signal: Nervous — electrical (action potentials) and chemical (neurotransmitters across the synapse). Endocrine — chemical (hormones).
- Transmission pathway: Nervous — along neurones (axons); chemical only across the synaptic cleft. Endocrine — through the bloodstream.
- Specificity of effect: Nervous — localised to the cells innervated by a particular neurone or those postsynaptic to it. Endocrine — widespread, because hormones travel in the blood to any cell with the appropriate receptor.
- Speed: Nervous — very fast (milliseconds). Endocrine — slower (seconds to hours).
- Duration: Nervous — short-lived (milliseconds to seconds). Endocrine — long-lasting (minutes to hours or days).
Understanding the Question
The stem already gives one difference: the endocrine system has a slower transmission speed than the nervous system. The candidate is therefore asked for OTHER differences. The marks reward contrasts phrased within a single point ('nervous system X, and endocrine system Y'), not separate statements about each system.
Approach
Use the standard comparison framework. The mark scheme credits contrasts phrased as 'nervous system X, and endocrine system Y' (or vice versa) within one point. For each of the four marks, pick a distinct dimension from the list above and express the contrast within one sentence. Do NOT repeat the speed difference.
Step-by-Step Reasoning
- Signal type: Nervous system — impulses / action potentials / neurotransmitters. Endocrine system — hormones. (Nervous uses electrical AND chemical signals; endocrine uses only chemical.)
- Transmission route: Nervous — along neurones. Endocrine — in the blood.
- Specificity of effect: Nervous — localised to specific target cells. Endocrine — widespread (any cell with the receptor can respond).
- Duration: Nervous — short-lived. Endocrine — long-lasting.
(A fifth possible point, the speed difference, is excluded by the stem.)
Key Takeaways
The mark scheme's 'any four from' list provides six creditable contrasts. Any four earn full marks. The contrasts cover: signal nature, transmission route, specificity, speed, duration, and 'AVP' (any other valid point).
Common Mistakes
- Repeating the speed difference (already in the stem) — wasted point.
- Giving only one side of the contrast ('nervous is fast') without the corresponding endocrine statement.
- Listing similarities rather than differences.
- Vague wording such as 'the nervous system is more direct' without specifying the contrast in signal type, route, or specificity.
Things to Be Careful About
- The mark scheme uses 'and' within each marking point: the contrast must be made within a single point, not split into two.
- 'AVP' (any valid point) means the candidate can earn marks for additional sensible contrasts not on the list.
- Avoid vague words like 'hormones are slower' when the stem has already given that point — credit would not be awarded for a repeat.
The endocrine system and the nervous system can affect muscle function.
Fig. 5.1 shows a transmission electron micrograph of a longitudinal section of striated muscle tissue that is in a relaxed state.
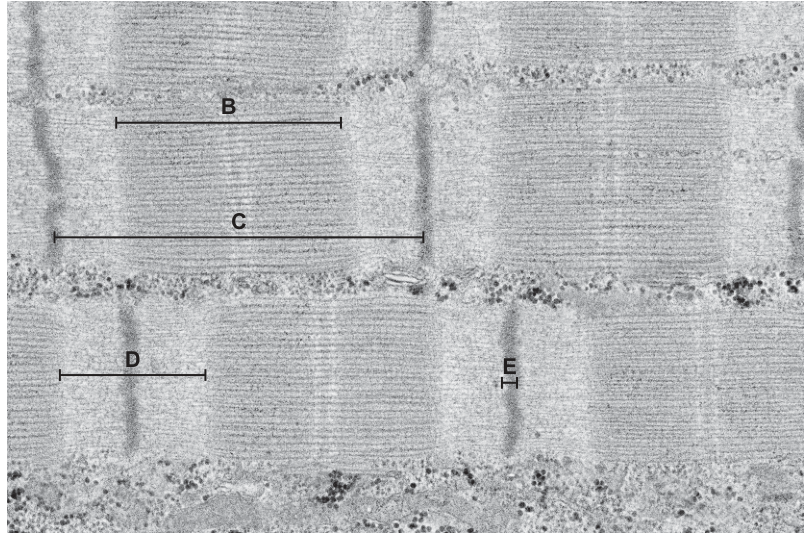
Fig. 5.1
Answer
C
C
Background Concept
A sarcomere is the functional contractile unit of striated muscle. It is defined as the region between two adjacent Z-lines. On an electron micrograph of striated muscle:
- Z-line: dark line bisecting the I-band; marks the sarcomere boundary.
- I-band: light region containing only thin (actin) filaments.
- A-band: dark region containing the full length of the thick (myosin) filaments, including the lateral overlap with actin.
- H-zone: centre of the A-band containing only myosin (no actin overlap).
- M-line: centre of the H-zone; midline of the sarcomere.
Understanding the Question
Fig. 5.1 is a TEM of relaxed striated muscle with four labelled regions: B (A-band width), C (distance between two Z-lines), D (I-band width) and E (H-zone width). The candidate must state which letter marks the length of one sarcomere.
Approach
Recall the definition of a sarcomere (Z-line to Z-line) and match it to the labels:
- C spans from one Z-line to the next Z-line.
- B is the A-band (myosin, with or without actin overlap).
- D is the I-band (actin only).
- E is the H-zone (myosin only).
Step-by-Step Reasoning
The sarcomere is, by definition, the distance from one Z-line to the next. On the micrograph, label C is the bar that spans this exact distance. Therefore C indicates the length of one sarcomere.
Key Takeaways
Sarcomere = Z-line to Z-line. On a TEM, the Z-lines are the dark vertical lines, and a sarcomere is the repeating unit between them.
Common Mistakes
- Choosing B (A-band) — the A-band is the dark band of myosin, not the sarcomere.
- Choosing D (I-band) — the I-band is the light band of actin only.
Things to Be Careful About
The labels can be confused if the candidate does not know the band structure. Memorise: Z = boundary, I = light, A = dark, H = lighter centre of A.
Answer
B
B
Background Concept
In a striated muscle sarcomere:
- The A-band is the full width of the myosin filaments. It includes both the lateral regions where actin and myosin OVERLAP and the central H-zone where myosin is present but actin is absent.
- The H-zone is the centre of the A-band, containing only myosin filaments (no actin overlap).
- The I-band is the region of actin filaments that does NOT overlap with myosin.
So the region of overlap is the A-band MINUS the H-zone — i.e. the lateral portions of the A-band. The A-band as a whole is the region where myosin is present and, around its edges, where actin and myosin overlap.
Understanding the Question
The candidate must state which letter on Fig. 5.1 marks a region of actin and myosin overlap.
Approach
Eliminate the distractors:
- D (I-band) = actin only, no myosin → no overlap.
- E (H-zone) = myosin only, no actin → no overlap.
- B (A-band) = full width of myosin, includes the overlap with actin → OVERLAP region.
- C = the sarcomere (Z to Z), not a band.
Step-by-Step Reasoning
The dark A-band (B) is the region where the myosin filaments are located. The lateral portions of the A-band (the parts outside the H-zone) are where the myosin and actin filaments interdigitate — this is the overlap region. Therefore B indicates a region where actin and myosin overlap.
Key Takeaways
- A-band = myosin region, including the overlap with actin at the edges.
- H-zone = myosin only, no overlap.
- I-band = actin only, no overlap.
Common Mistakes
- Choosing E (H-zone) — this is where myosin is present but actin is NOT, so there is no overlap there.
- Choosing D (I-band) — this is where actin is present but myosin is NOT.
Things to Be Careful About
The question asks for 'a region where actin and myosin overlap' — the answer is the A-band (B), not the H-zone (E). A common error is to think 'the centre of the A-band' is the overlap, but the centre of the A-band is actually the non-overlap region (H-zone).
Describe and explain how the region labelled D on Fig. 5.1 changes during muscle contraction.
Answer
- D (the I-band) shortens / contracts / decreases in width during contraction.
- Calcium ions / bind to troponin.
- Tropomyosin moves / shifts position, exposing the myosin-binding sites on actin.
- Myosin heads bind to actin / myosin–actin cross-bridges form.
- The myosin head performs the power stroke, pulling the actin filament toward the centre of the sarcomere.
- More actin is pulled into the A-band / the overlap between actin and myosin increases, so the I-band (region containing actin only) becomes narrower.
The I-band (D) shortens because actin filaments are pulled into the A-band by myosin cross-bridges, increasing actin–myosin overlap.
Background Concept
The sliding filament model of muscle contraction explains how a sarcomere shortens. The key idea is that the thin (actin) filaments slide over the thick (myosin) filaments toward the M-line (centre of the sarcomere). The filaments themselves do NOT shorten; the sarcomere shortens because the overlap between them increases.
Molecular events of contraction:
- An action potential travels along the sarcolemma and down the T-tubules, triggering the sarcoplasmic reticulum to release into the sarcoplasm.
- binds to troponin, causing a conformational change.
- Troponin moves tropomyosin away from the myosin-binding sites on actin.
- Myosin heads (already energised by hydrolysis of ATP to ADP + Pi) bind to the exposed sites on actin, forming cross-bridges.
- The myosin head releases Pi, causing the power stroke — the myosin head pivots, pulling the actin filament toward the M-line.
- ADP is released. A new ATP binds to the myosin head, causing it to detach from actin.
- ATP is hydrolysed, re-energising the myosin head for the next cycle.
How the bands change during contraction:
- I-band (D): shortens — actin is pulled into the A-band, so less of the 'actin only' region is visible.
- A-band (B): stays the same length — myosin filaments do not change length.
- H-zone (E): shortens — actin is pulled into the H-zone, so the 'myosin only' central region decreases.
- Sarcomere (C): shortens — the Z-lines are pulled closer together.
Understanding the Question
The candidate must DESCRIBE how the I-band (D) changes during contraction AND EXPLAIN why. The 'describe' part is the observation (shortens); the 'explain' part is the molecular mechanism that causes it.
Approach
- State the observable change (D shortens).
- Walk through the molecular mechanism in the order: → troponin → tropomyosin → myosin–actin binding → power stroke → actin pulled into A-band.
- Link the molecular mechanism to the structural change in the I-band.
Step-by-Step Reasoning
- Description: D (the I-band) shortens / contracts / decreases in width during muscle contraction.
- Explanation (mechanism):
- released from the sarcoplasmic reticulum binds to troponin on the actin filament.
- Troponin changes shape, moving tropomyosin off the myosin-binding sites on actin.
- The energised myosin head binds to actin, forming a myosin–actin cross-bridge.
- The myosin head performs the power stroke: it pivots and pulls the actin filament toward the centre of the sarcomere.
- As actin is pulled inward, more of the actin filament enters the A-band (the region of myosin), so the actin-only region (the I-band) narrows.
Key Takeaways
- The I-band shortens because actin is pulled into the A-band, increasing the overlap between actin and myosin.
- The trigger for contraction is binding to troponin, which moves tropomyosin to expose the binding sites on actin.
- The filaments themselves do not shorten; the sarcomere shortens because the filaments slide past each other.
Common Mistakes
- Saying the I-band 'disappears' or 'becomes zero' — it narrows but does not vanish (unless the muscle shortens maximally and all actin is pulled into the A-band, which is not the typical state described).
- Saying the A-band also shortens — the A-band length is determined by the myosin filament length, which does not change.
- Missing one of the key mechanism steps (, troponin, tropomyosin, cross-bridge, power stroke).
- Confusing the direction of the pull (actin moves toward the M-line / centre of the sarcomere, not outward).
Things to Be Careful About
- The mark scheme requires BOTH the description (shortens) AND three of the mechanism points. The first mark is for the description, the next three are for the mechanism.
- The H-zone (E) also shortens, but the question is specifically about the I-band (D).
- 'Power stroke' is the term for the myosin pivoting step; 'cross-bridge' refers to the myosin–actin attachment; do not use these interchangeably.
The distribution of the large blue butterfly, Phengaris arion, extends across Europe and Asia. It is assessed by the International Union for Conservation of Nature (IUCN) on the Red List™ as ‘Near Threatened’ globally and ‘Endangered’ in Europe.
In Europe, P. arion became extinct in the Netherlands in 1964 and in the United Kingdom in 1979.
Fig. 6.1 lists the conservation status categories in the IUCN Red List™.
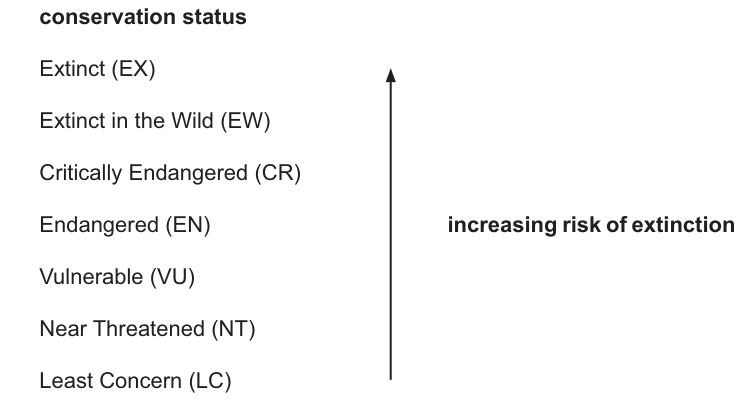
Fig. 6.1
Fig. 6.2 shows P. arion.
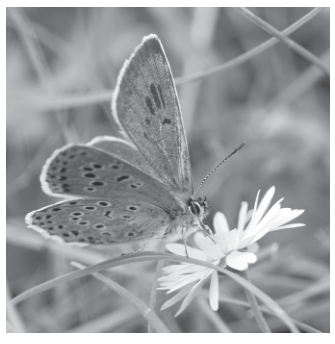
Fig. 6.2
Answer
- Identify, prioritise and protect the species most at risk of extinction.
- Provide data and advice to governments, scientists, conservation organisations and industry so that informed decisions can be made.
- This allows action to be taken to protect the species, e.g. habitat restoration, captive breeding, or legal protection (CITES listings).
See working
Background Concept
The International Union for Conservation of Nature (IUCN) maintains the Red List™, a global inventory of the conservation status of biological species. Each species is assessed against quantitative criteria (population size, rate of decline, geographic range) and placed in a category ranging from Least Concern (LC) through Near Threatened (NT), Vulnerable (VU), Endangered (EN) and Critically Endangered (CR), to Extinct in the Wild (EW) and Extinct (EX). The Red List is not a law itself, but it underpins national and international conservation policy, including the Convention on International Trade in Endangered Species (CITES), the Convention on Biological Diversity (CBD), and many national wildlife laws.
Understanding the Question
This part asks you to explain the conservation value of the IUCN Red List — i.e. what the assessments do that helps biodiversity survive. The command word is explain, so each point should make clear how the Red List leads to a useful conservation outcome, not merely describe what the categories are.
Approach
Think about the chain: assessment → who uses it → what action follows. The mark scheme rewards points that cover (1) the act of identifying and prioritising at-risk species, (2) the way the data inform stakeholders, and (3) the conservation actions that are triggered. Any three of the five listed creditable points will earn full marks.
Step-by-Step Reasoning
- Identification and prioritisation. The Red List sorts species by their risk of extinction, so conservation effort and funding can be directed first at those most in need (CR, EN, VU before NT and LC). This is itself a form of conservation benefit because limited resources are targeted efficiently.
- Data and advice to stakeholders. Governments use the categories when drafting wildlife law and listing protected species; scientists use them to identify research priorities; zoos and botanical gardens use them to choose species for captive breeding; industry (e.g. mining, forestry, agriculture) uses them in environmental impact assessments. The Red List therefore feeds evidence-based decision making.
- Triggering action. Because stakeholders have reliable, internationally comparable information, specific conservation actions can be taken — for example, habitat restoration, legal protection from trade (via CITES), reintroduction programmes, or the establishment of protected areas.
- Examples of action. Specific actions that follow from a Red List assessment include the ex situ conservation of a Critically Endangered species in a zoo, the creation of a nature reserve to protect habitat, or a ban on international trade in a listed species.
- Additional valid points (AVP). Many answers would also credit raising public awareness and supporting international cooperation on biodiversity.
Key Takeaways
- The IUCN Red List is a tool for prioritising and directing conservation effort globally.
- It links scientific assessment to policy and on-the-ground action.
- It is the evidence base that bodies such as CITES, CBD, national governments and NGOs draw on.
Common Mistakes
- Describing only what the categories mean, without saying how they help conservation (this is a state answer, not an explain answer).
- Listing one point in two different wordings (each ; in the mark scheme is a separate mark).
- Forgetting to mention an action that follows from the assessment.
Things to Be Careful About
- Use the exact term IUCN Red List — not just "Red List".
- An explain command word means stating the mechanism or consequence, not just a feature.
- A single example (e.g. CITES listing) can earn the action mark on its own.
With reference to Fig. 6.1 and the IUCN assessments for P. arion, suggest how the abundance of the butterfly differs across its distribution.
Answer
- In Europe, where P. arion is classified as Endangered (EN), the population is smaller / less abundant and faces a higher risk of extinction.
- In Asia (and other parts of its range where the global assessment of Near Threatened applies), the population is larger / more abundant, so the overall risk of extinction is lower.
See working
Background Concept
IUCN categories describe the risk of extinction, which is closely linked to the abundance and trend of a population. A species classified as Endangered has either a very small population or one that is declining rapidly, or both, whereas a species classified as Near Threatened is close to qualifying for a threatened category or is likely to qualify soon. The same species can be assessed at different scales: a global assessment and regional (national) assessments. These can differ because local conditions vary across the range.
Understanding the Question
You are given two IUCN assessments for P. arion: globally it is Near Threatened (NT) but in Europe it is Endangered (EN). The question asks you to suggest how the abundance of the butterfly differs across its distribution. The key is to read off Fig. 6.1 that EN is higher on the risk ladder than NT, and to translate that into a statement about population size/abundance.
Approach
Compare the two positions on the Fig. 6.1 ladder: Endangered is two steps above Near Threatened. A higher category means smaller populations and/or faster declines, i.e. fewer individuals and a greater chance of local extinction.
Step-by-Step Reasoning
- In Europe, the regional IUCN assessment is Endangered. Endangered species have small, declining populations; therefore P. arion is less abundant in Europe (e.g. the UK population was lost in 1979 and the Dutch one in 1964 — these are local extinctions, confirming small European populations).
- The global assessment is Near Threatened, so across the rest of the range (largely in Asia), the species is in better condition — populations are larger and more stable, hence the lower risk category overall.
- The combined picture is that the species is more abundant and secure in the Asian part of its range, and more threatened and scarce in Europe, which is why the European assessment is more severe than the global one.
Key Takeaways
- The IUCN category reflects both current abundance and the rate of decline.
- A more severe (higher) category on Fig. 6.1 implies a smaller, more threatened population.
- The same species can be assessed differently in different regions; the regional assessment applies only within that region.
Common Mistakes
- Saying only that the species is "endangered" without reference to Europe (the mark scheme requires the geographic context).
- Confusing Near Threatened (NT) with Not Threatened — NT means close to qualifying for a threatened category.
- Describing the categories without saying anything about abundance, which is what the question asks.
Things to Be Careful About
- Quote the categories exactly: Near Threatened (NT) and Endangered (EN), and name the region (Europe).
- Direction of comparison matters: state that Europe has fewer/scarcer populations compared with Asia (or the rest of the range), not just "there are fewer butterflies somewhere".
P. arion has been successfully re-introduced in the United Kingdom at 12 sites. These sites were restored to flower-rich grassland.
The conservation management actions designed for P. arion also resulted in the re-establishment or increase of other species at the restored sites. These included 12 species of flowering plant, 8 other butterfly species and 4 species of other insects.
Use the information given to suggest why P. arion went extinct in the United Kingdom in 1979.
Answer
- The flower-rich grassland habitat on which P. arion depended was degraded, changed or lost, so the butterfly could no longer survive there.
- This was due to changes in farming practice / agricultural intensification / land development, which removed the wild flowers that provided nectar for adults and food plants for larvae, leaving the butterfly without the resources it needed.
See working
Background Concept
Most butterflies have a close ecological relationship with specific plants: adults need nectar sources, while caterpillars (larvae) usually feed on one or a few host plants. The large blue Phengaris arion is a specialist: the adults feed on nectar from wild flowers in unimproved grassland, and the larvae initially feed on specific host plants (thyme, Thymus) before being adopted by red ant colonies (Myrmica), which they parasitize for the rest of their development. Such tight, multi-partner ecological dependencies make a species extremely vulnerable to habitat change — lose the flowers or the host ants and the entire life cycle breaks.
Understanding the Question
The stem states that successful reintroduction required restoring the sites to flower-rich grassland and that the same management benefited 12 plant species, 8 other butterflies and 4 other insects. From this, you can infer that what was missing in 1979 was the flower-rich grassland itself and the ecological community it supports. The question asks you to suggest why the butterfly went extinct in 1979, so the answer must connect habitat change to the butterfly's disappearance.
Approach
Work backwards from the reintroduction data: the missing component that had to be restored was flower-rich grassland. What destroys such grassland in the modern UK? Mostly agricultural intensification (ploughing, fertilising, re-seeding, herbicide use) and built development. The mark scheme rewards both the habitat-loss point and the cause, plus the food/flower point.
Step-by-Step Reasoning
- Habitat loss/change. P. arion went extinct because its habitat — flower-rich, unimproved grassland — was lost or degraded.
- Cause of habitat loss. The most common reason in the UK in the second half of the 20th century was a change in farming practice (intensification, ploughing of old meadows, use of fertilisers and herbicides, conversion to improved pasture or arable) and/or development (housing, roads, industry). Either of these gives the second marking point.
- Consequence for the butterfly. With the wild flowers gone, both adult nectar sources and larval host plants disappeared, so the butterfly could not complete its life cycle and the local population died out. (Ant hosts would also have been lost with the habitat, but the mark scheme credits the food-plant/flower point.)
Key Takeaways
- Habitat loss is the leading cause of insect extinctions in the UK and across Europe.
- Specialist species with tight ecological dependencies disappear first when habitat is simplified.
- A successful reintroduction requires first restoring the habitat, then the species.
Common Mistakes
- Saying the butterfly was "killed by pesticides" without naming the habitat change — the mark scheme wants the habitat, the cause, and the loss of food.
- Giving a generic answer such as "climate change" or "hunting" — neither is supported by the question.
- Forgetting that the information given explicitly mentions flower-rich grassland restoration.
Things to Be Careful About
- The mark scheme's third point is about food plants/flowers for food; be specific that adults need nectar and/or larvae need host plants, not just "food".
- Stay close to the evidence in the question: the reintroduction sites were restored to flower-rich grassland, so that is the habitat that was missing.
Answer
- Prevents extinction and allows the endangered species to survive.
- Maintains and increases biodiversity — in this case, the same restoration that helped P. arion also brought back 12 flowering plants, 8 other butterflies and 4 other insects.
- Provides aesthetic, recreational and wellbeing benefits for people visiting or living near the restored sites.
- Provides opportunities for scientific research and education about the species and its habitat.
- Fulfils an ethical/moral obligation to look after other species (stewardship of nature).
- Maintains stability of food chains and food webs (e.g. pollination, predator–prey relationships) so the ecosystem continues to function.
See working
Background Concept
Conservation can be justified for many overlapping reasons, which the A-level syllabus groups under three or four broad headings:
- Ecological — maintaining species, populations, communities, ecosystems and the services they provide (pollination, nutrient cycling, soil formation, climate regulation, pest control, food-web stability).
- Economic — direct income from ecotourism, sustainable harvesting, genetic resources for crops and medicines; indirect value from ecosystem services (which, if lost, would have to be replaced at great cost).
- Social / cultural / aesthetic — scenery, recreation, cultural identity, education, scientific research, mental wellbeing.
- Ethical / moral — a sense of stewardship, that other species have a right to exist and that humans are responsible for not driving them to extinction.
Restoring habitat for a single umbrella species frequently delivers benefits across all these categories — this is sometimes called the conservation bonus or umbrella effect.
Understanding the Question
The stem tells you that restoring sites for P. arion also brought back 12 plant species, 8 other butterflies and 4 other insects. The question asks you to outline the advantages of restoring habitats for endangered species. You are free to draw on any of the categories of justification, but you should pick four clearly distinct points; the mark scheme lists eight acceptable points and any four earn full marks.
Approach
Before writing, think of advantages under the headings above and pick the four that are most distinct from each other. A common mistake is to give four aesthetic/recreational points that say the same thing in different words — each must be a separate, identifiable reason. Tying one point to the P. arion case (e.g. the umbrella effect on plants and other insects) makes the answer specific to the question.
Step-by-Step Reasoning
- Preventing extinction. The most direct advantage: restoring habitat gives the endangered species a place to live and reproduce, preventing its extinction. (Mark scheme point 1.)
- Maintaining/increasing biodiversity. Because habitat restoration benefits whole communities, biodiversity is maintained or increased. The P. arion case is a literal example: 12 plants, 8 other butterflies and 4 other insects re-established or increased. (Point 2.)
- Aesthetic, recreational and wellbeing benefits. Restored habitats are attractive, support walking, wildlife watching and improved mental health for visitors and locals. (Point 3.)
- Scientific and educational value. Restored sites allow study of the species, its ecology and the success of conservation methods, and provide a resource for teaching. (Point 4.)
- Ethical / moral. Many people hold that humans have a duty to protect other species and not cause their extinction. (Point 5.)
- Cultural / heritage / ecotourism. Local communities may value a species as part of their heritage, and visitors may come to see it, supporting local economies. (Point 6.)
- Food web / food chain stability. Restored habitats support complex feeding relationships, so removing the habitat would destabilise the ecosystem. (Point 7.)
- Ecosystem services. Healthy habitats provide pollination, pest control, soil conservation, water purification and carbon storage. (Point 8.)
Key Takeaways
- Restoring habitat for one endangered species often delivers biodiversity, ecosystem-service, economic, social and ethical benefits at the same time.
- There are at least four independent categories of justification for habitat restoration; you should be able to name points from more than one.
- The umbrella-species concept explains why single-species projects can have whole-community pay-offs.
Common Mistakes
- Giving four points that all say "it's nice to look at" or "it's good for biodiversity" in slightly different words — the mark scheme requires four distinct points.
- Confusing aesthetic (how it looks) with recreational (what you can do there) and wellbeing (mental health benefits) — these are three separate points on the mark scheme.
- Forgetting to mention the P. arion umbrella effect on the other 24 species given in the stem.
Things to Be Careful About
- Match the mark scheme's wording where you can: prevent extinction, maintain biodiversity, aesthetic / recreational / wellbeing, scientific interest, ethical, cultural / ecotourism, food webs, ecosystem services / pollination.
- For an outline command word, a brief sentence per point is sufficient; do not write a long essay.
In aerobic respiration, most ATP is produced by oxidative phosphorylation.
Answer
- ATP is hydrolysed to ADP and , releasing energy that can be used in cellular reactions.
- The hydrolysis reaction is readily reversible, so ATP can be continuously regenerated (e.g. by respiration), giving a high turnover.
- ATP is a small, soluble molecule, so it can diffuse freely around the cell to wherever energy is required.
ATP hydrolyses to ADP + Pi, releasing energy; the reaction is reversible so ATP can be regenerated; ATP is small and soluble so it can diffuse freely within the cell.
Background Concept
ATP (adenosine triphosphate) is a nucleotide derivative consisting of the nitrogenous base adenine, the pentose sugar ribose, and a chain of three phosphate groups. The bonds between the phosphate groups (particularly the terminal phosphoanhydride bonds) are high-energy bonds. When the terminal phosphate bond is hydrolysed (by ATP hydrolase enzymes), ATP is converted to ADP (adenosine diphosphate) and an inorganic phosphate ion (), and approximately 30.5 kJ mol⁻¹ of energy is released under standard conditions.
For ATP to function as a universal energy currency, several properties are essential:
- It must be able to release its energy quickly and controllably, on demand, in any part of the cell.
- The reaction must be reversible, so that the same molecule can be recharged (rephosphorylated) over and over again.
- It must be physically small and chemically compatible with the aqueous cytoplasm.
Understanding the Question
Part (a) is a recall question with the command word "outline", which means the candidate should give the main features without necessarily going into great depth. Three marks are available, so three distinct points are needed. The question is testing knowledge of why ATP, rather than other energy-rich molecules such as glucose, is the immediate energy source in cells.
Approach
Think about what makes ATP special compared with, say, glucose or triglycerides:
- The energy yield per molecule is small enough to be controllable, but large enough to drive individual reactions.
- The bond is hydrolytically stable until an enzyme specifically cleaves it, so energy is not released spontaneously.
- It is regenerated continuously by respiration and photosynthesis.
- It moves easily around the cell to wherever it is needed.
Step-by-Step Reasoning
- Energy release on hydrolysis: ATP → ADP + releases a usable amount of energy in a single, manageable step. This is the energy that powers essentially all energy-requiring processes in the cell (active transport, biosynthesis, mechanical work, etc.).
- Reversibility and turnover: The same ATP molecule can be re-phosphorylated thousands of times a day. This means cells do not need to keep synthesising new ATP from scratch; the small pool turns over extremely rapidly, keeping the ATP/ADP ratio high.
- Size and solubility: ATP is a small, polar, water-soluble molecule. It can therefore diffuse through the cytosol and enter organelles such as mitochondria and chloroplasts to deliver energy where it is needed, without being sequestered or requiring special transport.
A reasonable additional credit point would be that the hydrolysis reaction releases a smaller amount of energy than, say, glucose oxidation, so the energy is released in controlled, usable "packets" rather than all at once.
Key Takeaways
- ATP is the immediate energy currency of the cell, not the long-term energy store (that role belongs to carbohydrates, lipids and proteins).
- Its usefulness comes from the combination of: a hydrolytically accessible high-energy bond, a readily reversible reaction, and small physical size.
- The ATP–ADP cycle is extremely fast; a single ATP molecule may be turned over thousands of times per day.
Common Mistakes
- Confusing ATP's role as an energy currency with its role as an energy store (lipids and carbohydrates are stores; ATP is the carrier).
- Saying ATP "stores" energy rather than "releases" or "supplies" energy on hydrolysis.
- Suggesting ATP is "too reactive" — it is in fact kinetically stable until enzymes cleave the terminal phosphate bond.
- Forgetting the reversibility/regeneration point, which is what makes a "currency" different from a one-off fuel.
Things to Be Careful About
- The mark scheme accepts either "energy donor" or "releases energy" — either is fine, but do not write both as if they were separate points.
- "Reversible" alone is not enough; the mark scheme wants the idea that ATP can be regenerated, so include a phrase such as "can be regenerated" or "high turnover".
- "Small, soluble, can diffuse" must appear together for the fourth marking point — quoting just one of the three ideas does not earn the mark on its own.
Rotenone is a compound that affects oxidative phosphorylation.
Rotenone disrupts the first carrier in the electron transport chain by stopping the transfer of electrons from this carrier.
Suggest and explain how rotenone reduces the production of ATP and water in aerobic respiration.
Answer
- Rotenone blocks the first carrier in the electron transport chain (ETC), so electron flow along the chain stops / is greatly reduced.
- Without electron flow, no energy is released to drive the pumping of ions from the matrix into the intermembrane space.
- Therefore no / a much smaller gradient is established across the inner mitochondrial membrane.
- Few / no ions flow back through ATP synthase, so the rate of oxidative phosphorylation is greatly reduced and little ATP is produced.
- Electrons cannot reach the final carrier, so oxygen is not reduced and no / little water is formed.
- Oxidised NAD (NAD⁺) is not regenerated, so the link reaction and Krebs cycle slow down or stop, reducing substrate-level ATP production and the supply of reduced NAD to the chain.
Rotenone blocks the first ETC carrier, halting electron flow; this prevents H+ pumping, abolishes the proton gradient, stops ATP synthase activity (less ATP), prevents reduction of O2 to water, and stops NAD+ regeneration, slowing the link reaction and Krebs cycle.
Background Concept
Oxidative phosphorylation takes place on the inner mitochondrial membrane and depends on three linked processes:
- Electron transport. Reduced NAD (and reduced FAD) donate electrons to the first carrier of the electron transport chain (ETC). The electrons pass along a series of carrier proteins, losing energy at each step. This energy is used to pump ions from the matrix into the intermembrane space.
- Chemiosmosis. The resulting electrochemical (proton) gradient across the inner membrane is a store of potential energy. ions flow back into the matrix down their gradient through the channel protein ATP synthase, and this flow is coupled to the synthesis of ATP from ADP and .
- Terminal electron acceptor. At the end of the chain, the final carrier donates the (now low-energy) electrons to oxygen, which combines with to form water.
The ETC is also the route by which NADH is re-oxidised to NAD⁺, which is essential because NAD⁺ is needed for glycolysis, the link reaction and the Krebs cycle to continue.
Understanding the Question
The stem tells us that rotenone blocks the first carrier in the ETC, so electrons cannot leave it. The candidate is asked to "suggest and explain" how this reduces both ATP and water production. Six marks are available, so six developed points are required. The reasoning has to flow logically: blockage of the first carrier → no electron flow → no proton pumping → no gradient → no ATP synthase activity → no terminal reduction of O₂ → no water. The downstream effect on NAD⁺ regeneration (and therefore on the earlier stages of respiration) is also expected.
Approach
Work through the ETC sequentially in your head, starting from the blocked first carrier:
- What happens to the electrons?
- What does that mean for the rest of the chain?
- What does that mean for the proton gradient and ATP synthesis?
- What does that mean for the final reduction of oxygen to water?
- What does that mean for the supply of NAD⁺ to the rest of respiration?
Step-by-Step Reasoning
- Electron flow stops. Rotenone binds to the first carrier, so electrons donated by NADH cannot be passed on. The chain effectively becomes "jammed" at this point, and electron flow along the rest of the carriers stops or is greatly reduced.
- No energy release from electron transport. The energy that normally powers pumping is released as electrons pass from carrier to carrier. With the chain blocked, this energy release does not occur.
- No pumping. The carrier proteins in the ETC that act as proton pumps cannot function without electron flow. Therefore no / far fewer ions are moved from the matrix into the intermembrane space.
- No proton gradient. Without pumping, the concentration difference and electrical potential difference across the inner membrane cannot be maintained, so the proton-motive force is lost.
- No ATP synthase activity. ATP synthase depends on flowing back into the matrix down its gradient. With the gradient collapsed, protons do not flow through the enzyme, and the synthesis of ATP from ADP and is greatly reduced (only the small amount of ATP from substrate-level phosphorylation in glycolysis and the Krebs cycle can still be made).
- No water formation. At the end of the chain, electrons are passed to , which combines with to form . If no electrons reach the final carrier, oxygen cannot be reduced, and no / little water is produced.
- NAD⁺ is not regenerated. Electrons cannot leave NADH via the chain, so NADH accumulates and NAD⁺ is in short supply. The link reaction (pyruvate → acetyl-CoA) and the Krebs cycle both require NAD⁺, so they slow down or stop. This reduces the production of reduced NAD (and therefore reduces the supply of electrons to the chain even further) and reduces the small amount of ATP made by substrate-level phosphorylation in the Krebs cycle.
Key Takeaways
- Oxidative phosphorylation requires electron flow, a proton gradient, and ATP synthase working together; disrupting any one of these collapses the whole system.
- The ETC also serves to regenerate NAD⁺, so blocking the chain has knock-on effects on glycolysis, the link reaction and the Krebs cycle.
- The final electron acceptor in the chain is oxygen; without electron flow, oxygen cannot be reduced, so no water is produced.
- Rotenone is a real example of an ETC inhibitor (so are cyanide, which blocks complex IV, and oligomycin, which blocks ATP synthase) and is used in research as a tool to study mitochondrial function.
Common Mistakes
- Saying "no ATP is made" — a small amount is still made by substrate-level phosphorylation in glycolysis and the Krebs cycle; the mark scheme wants "less ATP" or "little ATP", not zero.
- Confusing the site of the block: rotenone blocks the FIRST carrier (closest to NADH), not the last. Candidates who place the block at complex IV are describing cyanide, not rotenone, and will get confused about which parts of the chain still work.
- Forgetting the link to NAD⁺ regeneration and the slowdown of the Krebs cycle. This is a high-value mark (and the only mark scheme point that is non-obvious from a simple mechanistic description).
- Saying "no H+ gradient means no ATP" without explaining the link through ATP synthase.
- Saying "water is not made because there is no oxygen" — the question states the cell is respiring aerobically, so O₂ is present; the problem is that electrons cannot reach it.
Things to Be Careful About
- "Pumped" is a specific verb the mark scheme rewards for ions crossing the inner mitochondrial membrane — do not write "moved" or "diffused".
- "Diffuse through ATP synthase" is the correct phrasing for flowing back into the matrix; the proton-motive force is consumed by this flow, not by the synthase "pumping" backwards.
- The mark scheme accepts "electrons reach the last carrier" or "electrons reach the end of the chain" — both are fine, but be clear that it is the END of the chain that matters.
- Six marks require six distinct points; do not waste time re-stating the same idea in different words. Each mark is for a different link in the causal chain.
LibertyLink® soybean is a genetically modified crop. It was first grown in 1996 and used in food products from 1998. It has been grown in 6 countries and used in food products in 21 countries.
Table 8.1 summarises the modifications made to the soybean plant to produce LibertyLink® soybean.
Table 8.1
| name of introduced gene | gene donor organism | gene product | function of gene product |
|---|---|---|---|
| pat | Streptomyces viridochromogenes | phosphinothricin -acetyltransferase | stops action of glufosinate, a herbicide |
Explain how the modification made to produce LibertyLink® soybean may help to solve the global demand for food.
Answer
- LibertyLink® soybean is resistant to / not killed by the herbicide glufosinate.
- Glufosinate, sprayed on the crop, kills weeds / unwanted plants.
- This reduces competition (from weeds) for the soybean.
- The crop therefore has more access to (sun)light / water / (named) soil minerals.
- A higher yield / more crop is harvested.
See working.
Background Concept
LibertyLink® soybean is an example of a herbicide-tolerant genetically modified (GM) crop. The introduced pat gene, taken from the bacterium Streptomyces viridochromogenes, codes for the enzyme phosphinothricin N-acetyltransferase. When the plant makes this enzyme, it can inactivate glufosinate (the active ingredient in the Liberty® / Basta® herbicide), so the plant survives a herbicide spray that would normally kill it. This trait is the agronomic foundation of the crop: it does not itself increase the photosynthetic rate, but it lets the farmer control weeds chemically without damaging the soybean.
Weeds compete with crop plants for the same limited resources — light, water, mineral ions (e.g. nitrates, phosphates, potassium) and space. Reducing this competition by killing weeds typically translates into a bigger harvest from the same area of land.
Understanding the Question
The question asks for an explanation, which means each statement must carry a reason. The mark scheme rewards a logical chain: the GM crop survives the herbicide → the herbicide kills the weeds → the weeds no longer compete with the crop → the crop gains better access to resources → yield rises. A list of unconnected benefits (e.g. "the crop is better" or "farmers earn more") will not earn marks because they are not the biology the question is testing.
Approach
Start with the GM trait itself (resistance to glufosinate), then describe what the herbicide does to other plants, then explain the biological consequence (reduced competition), name the resources no longer competed for, and finish with the agronomic outcome (higher yield). This sequence mirrors the marking points in order.
Step-by-Step Reasoning
- The crop is resistant to glufosinate. The pat gene product detoxifies glufosinate, so the soybean survives a spray that would otherwise kill it. This is the direct effect of the modification (mark 1).
- Glufosinate kills weeds. The same herbicide spray is lethal to any plant that does not carry pat — so unwanted plants in the field are removed (mark 2).
- Competition is reduced. With fewer weeds in the field, the soybean no longer shares resources with them (mark 3).
- More resources are available to the crop. Specifically, the soybean has better access to sunlight, water and named soil minerals such as nitrates or phosphates (mark 4).
- Yield is higher. Because the crop grows with less competition, more of it is harvested from the same area of land (mark 5). The mark scheme lists this as a creditable point alongside the resource-access point, so either may be credited.
An AVP (any valid point) might be that the farmer no longer needs to plough or hand-weed as often, lowering fuel/labour costs and soil disturbance, or that the crop can be grown on land that was previously too weedy to cultivate.
Key Takeaways
- Genetic modification of a crop is rarely a direct yield trait; more often it is a management trait (here, herbicide tolerance) that allows other agronomic factors to be optimised.
- "Herbicide resistance" only has value because it removes the side-effect of the herbicide on the crop itself, allowing broad-spectrum weed control.
- The pathway from gene → phenotype → farmer's field is gene product (PAT) → trait (glufosinate tolerance) → agronomic benefit (cleaner field, more yield).
Common Mistakes
- Writing only "the crop is better quality" or "the crop is bigger" — these are vague and do not show the chain of reasoning required.
- Saying "the crop kills the weeds" — the crop does not kill weeds; the herbicide does. The crop merely survives the herbicide.
- Forgetting to name a competed resource (light / water / mineral ion). Stating "less competition" alone is half a mark; the resource must follow.
- Confusing the role of the gene product (it detoxifies the herbicide, it does not repel insects or confer drought tolerance).
Things to Be Careful About
- Use the term "resistant" (or "tolerant") rather than "immune" — plants do not have immune systems.
- Glufosinate is a herbicide, not a pesticide or fungicide; calling it a "pesticide" is rejected.
- Do not over-credit "higher yield" without first establishing reduced competition, otherwise the answer floats without a biological mechanism.
Name the type of enzyme that could be used to cut out the pat gene from S. viridochromogenes.
Answer
Restriction enzyme (endonuclease).
Restriction enzyme (endonuclease).
Background Concept
A restriction enzyme (more formally, a restriction endonuclease) is a bacterial enzyme that recognises a specific short sequence of bases in double-stranded DNA — usually a 4-, 6- or 8-base palindrome — and cuts the phosphodiester backbone at or near that site. Each enzyme cuts at its own unique recognition sequence, which is what allows genetic engineers to cut DNA at precise, predictable positions. Hundreds of different restriction enzymes are now known, each isolated originally from a different bacterial species (e.g. EcoRI from E. coli, HindIII from Haemophilus influenzae).
The bacterium that makes the restriction enzyme protects its own DNA by methylating the same recognition sequence; foreign DNA entering the cell is unmethylated and so is cut. Genetic engineers exploit this to excise a target gene cleanly from a donor genome.
Understanding the Question
The question is part of a sequence: the candidate has just been told that the pat gene from Streptomyces viridochromogenes needs to be transferred into soybean. The first step in any gene transfer is to release the gene from the donor DNA. The command word is "name" — a one- or two-word answer is enough for the mark.
Approach
Identify the enzyme class that recognises a specific DNA sequence and cleaves it: the restriction endonuclease. There is no calculation or application here — pure recall.
Step-by-Step Reasoning
- "Type of enzyme that could be used to cut out the pat gene from S. viridochromogenes" → an enzyme that cuts DNA at a specific sequence.
- Such an enzyme is a restriction enzyme (or restriction endonuclease).
- The mark scheme accepts either term; "restriction enzyme" is the everyday form, "restriction endonuclease" the more technical one.
Key Takeaways
- Restriction enzymes cut DNA at specific recognition sequences, producing fragments with predictable ends (blunt, 5′ overhang or 3′ overhang depending on the enzyme).
- The same enzyme is used to cut the plasmid vector, so that the gene fragment and the vector have compatible ends to be joined.
Common Mistakes
- Writing "DNA ligase" (the joining enzyme, not the cutting one).
- Writing "endonuclease" alone without the word "restriction" — in the context of genetic engineering the unqualified term is ambiguous; "restriction endonuclease" or "restriction enzyme" is required.
- Spelling "restrictase" or similar invented words.
Things to Be Careful About
- "Endonuclease" technically means any enzyme that cuts within a nucleic acid chain; "restriction endonuclease" is the precise term. The mark scheme accepts either phrasing, but the restriction part is what makes it useful for gene transfer.
Name the enzyme that could be used to join the pat gene to a plasmid by forming phosphodiester bonds.
Answer
(DNA) ligase.
(DNA) ligase.
Background Concept
DNA ligase is the enzyme that seals nicks in a DNA backbone by catalysing the formation of phosphodiester bonds between the 3′-OH of one nucleotide and the 5′-phosphate of the next. In the cell it performs this job during DNA replication (joining Okazaki fragments on the lagging strand) and during DNA repair. In the test tube it is the workhorse of recombinant DNA technology: once a restriction enzyme has cut both the donor DNA and the plasmid vector, ligase stitches the desired fragment into the open vector.
For the join to succeed, the fragment and the vector must have compatible ends — usually the same restriction enzyme is used on both so that complementary sticky (or blunt) ends are produced.
Understanding the Question
This is the second half of the recombinant-DNA pair: cutting (b)(i) and joining (b)(ii). The question explicitly mentions the function of the enzyme — "forming phosphodiester bonds" — which is the diagnostic clue pointing to ligase. As with (b)(i), the command word "name" requires only a one-word answer.
Approach
Recognise that the question describes the chemistry of DNA ligation (phosphodiester bond formation) and recall the enzyme that performs it.
Step-by-Step Reasoning
- An enzyme that joins two pieces of DNA by forming phosphodiester bonds between the sugar-phosphate backbones → DNA ligase.
- The mark scheme accepts either "DNA ligase" or just "ligase".
Key Takeaways
- Restriction enzymes cut phosphodiester bonds; ligase forms them — opposite reactions catalysed by different enzymes.
- Sticky ends produced by a restriction enzyme are held together by hydrogen bonds between complementary overhanging bases, but the backbone is still nicked; only ligase closes the backbone to make a stable recombinant molecule.
Common Mistakes
- Writing "restriction enzyme" again, confusing cut with join.
- Writing "polymerase" (which synthesises a new strand, it does not simply join existing ends).
- Spelling "ligase" as "ligaze" or "lygase".
Things to Be Careful About
- The qualifier "(DNA)" is helpful but not strictly required for the mark — "ligase" alone is accepted, although "DNA ligase" is unambiguous and preferred.
Suggest reasons why LibertyLink® soybean is used in food products in 21 countries but only grown in 6 countries.
Answer
- Some countries have an unsuitable climate / weather / soil for growing soybean.
- Other countries have not granted regulatory approval / have banned GM (or LibertyLink) crops.
- Some countries have activist / public opposition to GM crops.
- Some countries may not have enough land / arable space available.
- Some countries have banned the herbicide glufosinate itself.
- (AVP) e.g. countries only import the processed soybean as a food ingredient rather than grow the raw crop.
See working.
Background Concept
A GM crop can be grown in one country and used (imported, processed and eaten) in many others. The 21 countries that "use" LibertyLink® soybean are not necessarily growing it; they may be importing processed soy products (oil, flour, lecithin, animal feed) from the six producing nations. The split between 6 growers and 21 users therefore reflects a mix of:
- Agronomic factors — climate, soil type, day length, water availability determine whether soybean can be grown at all.
- Regulation — each country sets its own rules on GM cultivation and on GM food imports; some allow imports of approved GM food but forbid cultivation (e.g. several EU countries for many years).
- Public opinion and activism — anti-GM campaigns can deter cultivation even where regulation allows it.
- Trade and land use — limited arable land or competing high-value crops can preclude soybean cultivation, but processed soy is still cheap to import.
- Pesticide regulation — the benefit of the crop depends on glufosinate being legal; if a country has banned the herbicide, there is no point in growing a crop designed to tolerate it.
Understanding the Question
The question exploits the 6 vs 21 numbers to push the candidate beyond the biology of gene transfer and into the social, economic and regulatory implications of GMOs. The command word is "suggest", which means plausible reasons based on the information given (and general knowledge of food trade) — there is no single correct answer, but marks are awarded for distinct, credible ideas.
Approach
Read the question carefully: it is the same product in both groups of countries. The difference lies not in the crop itself but in the conditions for growing it and the rules or attitudes surrounding it. Generate at least three distinct reasons, each drawing on a different domain (physical environment / legal framework / public attitude / market).
Step-by-Step Reasoning
- Climate/soil mismatch. Soybean needs warm temperate or subtropical conditions and particular soil types. Countries in the 21-user group may simply be too cold, too dry or have the wrong soil for soybean cultivation, but they can still import soy products.
- Regulatory approval. A country may have authorised the import of LibertyLink® food products (after a safety assessment by, for example, EFSA in Europe or the FDA in the USA) while still refusing to authorise its cultivation. The EU historically took this split approach. (mark 2)
- Public/activist opposition. Some countries have strong anti-GM movements (e.g. parts of Europe, parts of Africa) that deter governments from authorising cultivation, even when imports are accepted. (mark 3)
- Land pressure. A country may not have enough arable land, or the land is more profitably used for other crops, so growing soybean is uneconomic; importing is cheaper.
- Banned herbicide. The benefit of LibertyLink® is the ability to spray glufosinate. If a country has banned glufosinate on environmental or human-health grounds, there is no agronomic reason to grow the resistant variety.
- AVP — e.g. countries only use soybean derivatives (oil, lecithin, animal feed) and have no history of growing the raw bean; or the 21-user list is dominated by trading partners of the 6 grower nations.
Key Takeaways
- A GM crop is rarely a single national decision: its production and its consumption are governed by different rules in different jurisdictions.
- "Allowed to import" and "allowed to grow" are separate regulatory decisions and frequently diverge.
- Social, economic and physical-geography factors can be as important as the biology in determining where a crop is actually planted.
Common Mistakes
- Repeating the same idea in different words, e.g. "the public are against it" + "the public protest" — only one mark is earned.
- Confusing the question: answers about why GM crops are used in 21 countries at all, rather than why they are not grown there.
- Vague generalisations such as "politics" or "the economy" without specifying what aspect.
- Saying "the herbicide kills people" — this is an unsupported claim and is not what the mark scheme accepts.
Things to Be Careful About
- The mark scheme uses the language "may have"; the candidate should phrase each reason as a plausible suggestion rather than as a definite statement about a specific country.
- "GM crops are banned" is not the same as "GM food imports are banned"; both are valid but only one mark can be earned per point.
- The answer should be restricted to reasons that explain the split between 6 and 21 — reasons that would apply equally to growers and users (e.g. "people don't like the taste") do not answer the question.
Fig. 9.1 shows a longitudinal section of a human kidney.
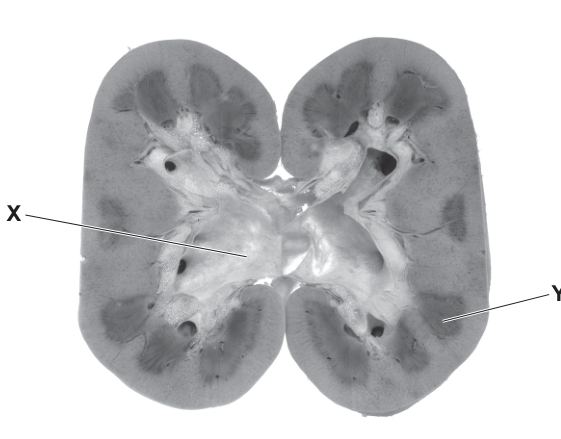
Fig. 9.1
Name the regions of the kidney labelled X and Y in Fig. 9.1.
X ______
Y ______
Answer
X: renal pelvis
Y: medulla
X = (renal) pelvis; Y = medulla
Background Concept
The mammalian kidney, when cut in longitudinal section, shows three gross regions arranged concentrically. The cortex is the thin, darker, granular outer band lying just beneath the tough fibrous capsule. The medulla lies internal to the cortex and is paler, with a visibly striated appearance produced by the parallel loops of Henle and collecting ducts grouped into pyramids. At the very centre is the renal pelvis, a funnel-shaped, fat-lined cavity that collects urine emerging from the papillae of the medullary pyramids and channels it into the ureter.
Understanding the Question
The question gives a longitudinal section of a bisected human kidney and asks the candidate to name two labelled regions, X and Y. The image shows the classic three-zone appearance: a dark outer rim (cortex), a paler striated middle zone, and a bright/white central space. The pointer X is directed at the central cavity, and Y is directed at the striated zone between the cortex and the cavity.
Approach
Read the position of each label relative to the kidney:
- X lies in the central, hollow-appearing region → this is where urine collects before leaving via the ureter, i.e. the renal pelvis.
- Y lies in the paler, striated zone internal to the dark outer rim → this is the medulla (containing the renal pyramids).
Step-by-Step Reasoning
- The kidney is organised from outside to inside as: capsule → cortex (dark) → medulla (paler, striated) → pelvis (central cavity).
- The pointer for X enters the bright central region where the major calyces and ureteric origin are visible; this is the renal pelvis.
- The pointer for Y terminates in the pale band between the dark outer cortex and the central pelvis; this striated region is the medulla.
- Therefore X = renal pelvis and Y = medulla.
Key Takeaways
- In a longitudinal section, the kidney shows three regions arranged from outside in: cortex (dark), medulla (pale, striated) and renal pelvis (central cavity).
- The pelvis is continuous with the ureter and receives urine from the medullary papillae.
Common Mistakes
- Confusing medulla and cortex because they are both internal layers — the cortex is always the outer, darker band; the medulla is internal to it.
- Calling the pelvis the 'ureter' — the pelvis is the funnel-shaped cavity inside the kidney, while the ureter is the tube that leaves it.
Things to Be Careful About
Use the exact CIE term (renal) pelvis (accepting 'pelvis' alone). 'Central cavity' or 'calyces' would not earn the mark on its own.
A biosensor can be used to measure the concentration of glucose in urine.
Outline how a biosensor measures the concentration of glucose in urine.
Answer
- The biosensor contains immobilised glucose oxidase.
- Glucose in the urine is oxidised to gluconic acid, producing hydrogen peroxide.
- The hydrogen peroxide is then oxidised at an electrode, releasing electrons (e⁻) / oxygen.
- The magnitude of the resulting current / voltage is proportional to the concentration of glucose in the urine, giving a digital / numerical reading on a screen.
Glucose oxidase catalyses glucose → H₂O₂; H₂O₂ is oxidised at an electrode, producing a current proportional to glucose concentration, displayed as a digital reading.
Background Concept
A biosensor combines a biological recognition element (an enzyme, antibody, or whole cell) with a physical transducer that converts the biochemical event into a measurable electrical signal. The most common glucose biosensor uses glucose oxidase (GOx), an enzyme that is highly specific for β-D-glucose. Because the reaction produces a stoichiometric amount of hydrogen peroxide, the concentration of glucose in the sample can be inferred indirectly from the amount of H₂O₂ generated.
Understanding the Question
The question asks the candidate to outline (give the main steps of) how a biosensor determines the glucose concentration of urine. The mark scheme offers six creditable points and asks for any four, so a complete answer should describe: the enzyme used, the reaction it catalyses, the electrochemical detection step, the proportionality between signal and glucose concentration, and the final quantitative readout.
Approach
Trace the chain of events from sample application to numerical display:
sample applied → enzyme catalyses glucose + O₂ → gluconate + H₂O₂ → H₂O₂ oxidised at electrode → e⁻ flow produces a current → current magnitude ∝ [glucose] → reading displayed digitally.
The answer is built by picking the four most informative links in this chain; combining the enzyme identity, the reaction, the electrode step and the proportionality-to-reading gives a complete four-mark answer.
Step-by-Step Reasoning
- Enzyme identity. A glucose biosensor contains immobilised glucose oxidase fixed at the electrode surface. The word 'immobilised' is the technical reason the enzyme is not washed away with the sample and can be reused.
- Enzymic reaction. Glucose oxidase catalyses:
So the amount of H₂O₂ produced is directly proportional to the amount of glucose that reacted.
3. Electrode step. The hydrogen peroxide diffuses to the electrode, where it is oxidised:
This generates a flow of electrons — a tiny current — in the external circuit.
4. Proportionality and readout. The magnitude of this current (or voltage) is proportional to the rate of H₂O₂ production, which in turn is proportional to the original glucose concentration in the urine. A transducer converts this current into a digital, numerical reading that is displayed on the biosensor screen.
Key Takeaways
- A biosensor = biological recognition element (enzyme) + transducer (electrode) + display.
- Glucose oxidase converts glucose into a stoichiometric amount of H₂O₂; H₂O₂ is then detected electrochemically.
- The signal (current / voltage) is proportional to the analyte concentration, allowing quantitative measurement.
- Biosensors are rapid, specific (enzyme specificity), sensitive and can be reused because the enzyme is immobilised.
Common Mistakes
- Stating only that 'an enzyme detects glucose' without naming glucose oxidase — the mark scheme requires the enzyme's name.
- Saying the sensor 'measures the colour change' — that is the principle of a urine test strip, not a biosensor; biosensors give an electrical readout.
- Skipping the proportionality step and just saying 'a reading is shown' — without explaining that the current is proportional to glucose concentration, the answer is incomplete.
- Confusing glucose oxidase with glucose dehydrogenase; CIE mark schemes credit glucose oxidase.
Things to Be Careful About
- The enzyme is glucose oxidase (not 'glucose enzyme' or 'oxidase').
- The biosensor gives a digital / numerical value — not a colour — so a vague 'result' wording is not enough.
- The signal measured is the current / voltage / electron flow generated at the electrode, not the H₂O₂ itself.
Explain the relationship between genes, proteins and phenotype, with reference to two examples of genetic diseases in humans.
Answer
General principle — a gene is a sequence of DNA that codes for a protein; a mutation in a gene may produce a non-functional or abnormal protein, which alters the phenotype and may cause disease.
Example 1 – Albinism (4 marks available)
- A mutation in the TYR gene codes for non-functional tyrosinase.
- Albinism is caused by a recessive allele.
- Without tyrosinase, tyrosine cannot be converted to melanin, so no melanin is produced.
- The phenotype is pale/fair skin and hair, and a transparent/pink iris.
Example 2 – Sickle cell anaemia (4 marks available; any 2 of these credit)
5. A mutation in the HBB gene codes for abnormal β-globin, producing haemoglobin S (HbS).
6. Sickle cell anaemia is a codominant disorder.
7. HbS is less soluble / sticky and forms rod-shaped structures that distort red blood cells into a sickle shape.
8. The sickle cells block capillaries and cause pain, especially in low O₂ conditions.
(For 6 marks, write both examples in full: the examiner will take the best six of the eight points.)
A mutation in a gene produces an abnormal or non-functional protein, which alters the phenotype; e.g. mutant TYR → non-functional tyrosinase → no melanin → albinism (recessive); and mutant HBB → abnormal β-globin (HbS) → sickled red blood cells that block capillaries → sickle cell anaemia (codominant).
Background Concept
The central dogma of molecular biology states that information flows from DNA → RNA → protein. A gene is a length of DNA that codes for a particular polypeptide, and the phenotype of an organism is the observable expression of its genotype, arising largely from the actions of the proteins coded for by its genes.
When a mutation (a change in the base sequence of DNA) occurs, the protein produced may be:
- non-functional (e.g. an enzyme that can no longer bind its substrate), or
- abnormally functional (e.g. a structural protein that misfolds and aggregates).
Either way, the protein can no longer carry out its normal role, and the cells, tissues or whole organism show a changed phenotype. In humans, such changes are often the cause of genetic diseases.
The syllabus highlights four classic examples:
- TYR → albinism (recessive)
- HBB → sickle cell anaemia (codominant)
- F8 → haemophilia (recessive, X-linked)
- HTT → Huntington's disease (dominant)
Understanding the Question
This is a 6-mark explain question, so you must do more than state facts — you must draw a chain from mutated gene → abnormal protein → physiological effect on the phenotype. The question asks for two examples of human genetic diseases, so a safe strategy is to write two compact four-point blocks; the examiner will then take the best six marks.
The command word explain means: describe what happens AND why, so for each disease you need to show the molecular link (which protein is faulty and how) AND the visible/clinical link (what the patient shows).
Approach
- Open with the general principle (gene → protein → phenotype; mutation disrupts the protein, which changes the phenotype) — this frames the whole answer.
- Choose two diseases that you can describe confidently. The two best-studied, with the cleanest gene-to-phenotype chain, are albinism and sickle cell anaemia.
- For each disease, give:
- the mutated gene and the protein affected;
- the mode of inheritance;
- the biochemical consequence (what the protein can no longer do);
- the phenotypic effect (what is seen in the patient).
- Mirror the mark scheme's exact key terms (gene symbols in italics, TYR / HBB, and the precise names tyrosinase and β-globin).
Step-by-Step Reasoning
Example 1 – Albinism
- A mutation in the TYR gene alters the amino-acid sequence of the enzyme tyrosinase, so the enzyme is non-functional.
- Albinism is caused by a recessive allele (so the disease appears only in homozygotes tyr/tyr; heterozygotes are unaffected carriers).
- Tyrosinase catalyses the conversion of the amino acid tyrosine into melanin in melanocytes. With no working enzyme, no melanin is produced.
- The lack of melanin produces a recognisable phenotype: pale/fair skin and hair and a transparent/pink iris (because the blood in the eye shows through).
Example 2 – Sickle cell anaemia
- A single-base substitution (point mutation) in the HBB gene changes one amino acid in β-globin, producing the abnormal protein that forms haemoglobin S (HbS).
- Sickle cell is a codominant disorder: heterozygotes (HbA HbS) have the sickle cell trait (mostly normal, but some sickling at very low O₂), while homozygotes (HbS HbS) have full sickle cell anaemia.
- HbS molecules are less soluble and become sticky at low oxygen tension, polymerising into long rod-shaped structures that distort the red blood cell into a sickle shape.
- The rigid, pointed sickle cells block capillaries, reducing blood flow and causing painful crises and tissue damage, particularly when oxygen levels are low.
Combining the two — together these cover the central theme: a single-gene mutation produces a single faulty protein, and the resulting loss (or change) of protein function is what the patient experiences as disease. This is the gene → protein → phenotype relationship the question is testing.
Key Takeaways
- A gene codes for a protein; the phenotype of an organism depends on those proteins working correctly.
- A mutation in a gene can produce a non-functional or abnormal protein, which changes the phenotype and may cause a genetic disease.
- The mode of inheritance (recessive / codominant / dominant / X-linked) determines how the disease allele is transmitted, but the molecular cause — a faulty protein — is the same principle for all four example diseases.
Common Mistakes
- Writing only "gene → protein → phenotype" in general terms with no named example. The question requires two named diseases; an answer without them cannot score more than a couple of marks.
- Confusing sickle cell and cystic fibrosis biology — do not say that sickle cell affects a transport protein or that the mutation is a deletion; it is a single base substitution in HBB producing HbS.
- Saying "haemoglobin is less oxygenated" instead of "haemoglobin is less soluble / sticky". The mark scheme wants the property of HbS that causes the cells to sickle, not the symptom in the patient.
- Forgetting the mode of inheritance — albinism is recessive, sickle cell is codominant (not dominant, not recessive), and Huntington's is dominant. Mixing these up loses a clear marking point.
- Omitting the clinical effect — for a 6-mark explain you must end each example with what the patient actually shows (pale skin/hair; painful crises from blocked capillaries).
Things to Be Careful About
- Use italics for gene symbols (TYR, HBB) and roman text for protein names (tyrosinase, β-globin / haemoglobin S).
- In the sickle cell example, use the precise term β-globin (or "abnormal β-globin") and the variant name haemoglobin S / HbS — vague phrases like "wrong haemoglobin" do not earn the mark.
- The mark scheme is structured so that the best two groups of four points are credited up to a maximum of six. Writing one full example plus a couple of points from a second example is the safest way to guarantee the full 6 marks.
- For albinism, the mark scheme accepts either pale/fair skin or hair OR transparent/pink iris as the phenotypic effect — you do not need both, but giving both is a quick way to demonstrate breadth.